INTEGRATED OPTICAL MACH-ZEHNDER INTERFEROMETER FOR BIOSENSOR
APPLICATION
by
KHOR KANG NAN (1130110614)
A thesis submitted in fulfillment of the requirements for the degree of Master of Science (Microelectronic Engineering)
School of Microelectronic Engineering UNIVERSITI MALAYSIA PERLIS
2015
© Thi
s i tem
is pr ot ec ted by
or igi nal
c opy
right
ii
DECLARATION OF THESIS
Authors’ full name : KHOR KANG NAN Date of Birth : 6 JUNE 1988
Title : INTEGRATED OPTICAL MACH-ZEHNDER
INTERFEROMETER FOR BIOSENSOR APPLICATION Academic Session : 2011 – 2014
I hereby declare that the thesis becomes the property of Universiti Malaysia Perlis (UniMAP) and to be placed at the library of UniMAP. This thesis is classified as:
CONFIDENTIAL (Contains confidential information under the Official Secret Act 1972)*
RESTRICTED (Contains restricted information as specified by the organization where research was done)*
OPEN ACCESS I agree that my thesis is to be made immediately available as hard copy or on-line open access (full text)
I, the author, give permission to the UniMAP to reproduce the thesis in whole or in part for the purpose of research or academic exchange only (except during a period of ___ years, if so requested above).
Certified by:
__________________ __________________
SIGNATURE SIGNATURE OF SUPERVISOR
KHOR KANG NAN DR. MUKHZEER MOHAMMAD SHAHIMIN IC NO: 880602-35-5377
Date: Date:
© Thi
s i tem
is pr ot ec ted by
or igi nal
c opy
right
iii
GRADUATE SCHOOL UNIVERSITI MALAYSIA PERLIS
PERMISSION TO USE
In presenting this thesis in fulfillment of a post graduate degree from Universiti Malaysia Perlis, I agree that permission for copying of this thesis in any manner, in whole or in part, for scholarly purposes may be granted by my supervisor or, in their absence, by Dean of the Graduate School. It is understood that any copying or publication or use of this thesis or parts thereof for financial gain shall not be allowed without my supervisor’s written permission. It is also understood that due recognition shall be given to me and to Universiti Malaysia Perlis for any scholarly use which may be made of any material from my thesis.
Requests for permission to copy or make other use of material in whole or in part of this thesis are to be addressed to:
Dean of Centre for Graduate Studies Universiti Malaysia Perlis
No. 112 & 114, Tingkat 1,Blok A, Taman Pertiwi Indah Jalan Kangar-Alor Setar, Seriab
01000 Kangar Perlis Indera Kayangan
Malaysia
© Thi
s i tem
is pr ot ec ted by
or igi nal
c opy
right
iv
ACKNOWLEDGEMENTS
I would like to express my deepest gratitude to my supervisor, Dr Mukhzeer Mohamad Shahimin for his assistance, patience and continued support throughout my project. His guidance his been essential to the progress of this project.
I would like to thank the staff of University of Malaysia Perlis, School of Microelectronic Engineering, Institute Nanoelectronic Engineering (INEE), School of Material Engineering for thier endless help in my project.
I also extend my special thanks to my family; my parents; Khor Hee Chuan and Heng Lang Hwang who have been tireless in giving me moral support and whom always pray for my success. I would like to thank my friend who have accompanied and supported me which had made my life bearable. Special thank to my girlfriend, Chong Pei Tee who has been supportive and patience throughout my project.
© Thi
s i tem
is pr ot ec ted by
or igi nal
c opy
right
v
TABLE OF CONTENTS
PAGES
DECLARATION OF THESIS ii
COPYRIGHT iii
ACKNOWLEDGEMENTS iv
TABLE OF CONTENTS v
LIST OF TABLES viii
LIST OF FIGURES ix
LIST OF NOMENCLATURE xiv
LIST OF SYMBOLS xvii
ABSTRAK xxi
ABSTRACT xxii
CHAPTER 1: INTRODUCTION
1.1 Background 1
1.2 Problem Statement 11
1.3 Research Aim and Objectives 14
1.4 Research Approach, Scope and Limitation 15
1.5 Thesis Organization 16
CHAPTER 2: LABEL-FREE OPTICAL BIOSENSOR FOR IDEAL SURVEILLANCE RDT
2.1 Introduction 18
2.2 Overview of Biosensor 19
2.3 Biomarkers of Dengue Diagnosis 22
2.4 Ideal Surveillance Rapid Diagnostic Test 27
2.5 Review on Dengue Biosensor 30
2.5.1 Piezoelectric Transducer 30
2.5.2 Fluorescent Spectroscopy 32
© Thi
s i tem
is pr ot ec ted by
or igi nal
c opy
right
vi
2.5.3 Fiber Optic 33
2.5.4 Surface Plasmon Resonance 35
2.5.5 Surface Photonic Crystal 37
2.5.6 Magnetic Bead Counter 37
2.5.7 Raman Spectroscopy 39
2.5.8 Comparison of Existing Dengue Biosensor 40 2.6 Fundamental of Integrated Optic for Evanescent Field Sensing 42
2.6.1 Optical Waveguide Theory 44
2.6.1.1 Total Internal Reflection 45
2.6.1.2 Transverse Resonance Condition 46
2.6.2 2D Mode Solver 48
2.6.3 Evanescent Field Sensing 52
2.7 Advantages of Integrated Optical Mach-Zehnder Interferometer (IO-
MZI) Biosensor 55
2.8 Principal of IO-MZI Biosensor 59
2.9 Detection Limit of IO-MZI Biosensor 63
2.9.1 Sensitivity of IO-MZI Biosensor 64
2.9.2 Minimum Detectable Phase Change of IO-MZI Biosensor 66
2.10 Optimization of IO-MZI Biosensor 68
2.11 Discussion 75
CHAPTER 3: METHODOLOGY
3.1 Introduction 78
3.2 Introduction to OptiBPM 78
3.3 Simulation Configuration 83
3.4 Simulation Process Flow 84
3.5 Design of Rib Waveguide 85
3.5.1 Modal Behaviour 85
3.5.2 Evanescent Field Penetration Depth 86
3.5.3 Bulk Sensitivity 87
3.5.4 Leakage Loss 88
3.5.5 Selection of Rib Waveguide Configuration 88
3.6 Design of Y-branch Splitter 89
© Thi
s i tem
is pr ot ec ted by
or igi nal
c opy
right
vii
3.7 Design of Mode Size Converter 89
3.8 Design of IO-MZI 90
CHAPTER 4: RESULT AND DISCUSSION
4.1 Rib Waveguide 93
4.1.1 Modal Behaviour 93
4.1.2 Evanescent Field Penetration Depth 94
4.1.3 Bulk Sensitivity 95
4.2 Y-Branch Splitter 100
4.3 Mode-Size Converter 101
4.4 Optimized IO-MZI Biosensor 103
4.5 Discussion 104
CHAPTER 5: CONCLUSION AND FUTURE WORKS
5.2 Conclusion 106
5.3 Future works 108
REFERENCES 109
APPENDIX 118
© Thi
s i tem
is pr ot ec ted by
or igi nal
c opy
right
viii
LIST OF TABLES
TABLE PAGE
2.1 Type of Transduction mechanism and the corresponding Label-free detection method
25
2.2 WHO – Ideal characteristics of surveillance RDT (Mabey et al., 2004)
15
2.3 Summary of dengue biosensor in term of detection limit, biomarkers, time and equipment
41
2.4 Comparison of effective index obtained by using the in- house 2D mode solver and the commercial OptiWave 2D mode solver
57
2.5 Advantages of integrated optical Mach-Zehnder Interferometer biosensor compared to other biosensors
45
2.6 Methods to increase sensitivity of IO-MZI biosensor 71 2.7 Comparative study of IO-MZI biosensor of different
interaction length, waveguide material, thickness, wavelength and polarization in term of detection limit, sensitivity and minimum detectable phase change
72
3.1 The component of IO-MZI included in the simulation with the aim and the related design parameters
83
4.1 Optimized design parameters and the corresponding loss for rib waveguide, Y-branch splitter, mode-size converter and IO-MZI for WG_75 and WG_250 respectively
102
5.1 Comparison of performance of various IO-MZI biosensor configurations with current work
© Thi
108s i tem
is pr ot ec ted by
or igi nal
c opy
right
ix
LIST OF FIGURES
FIGURE PAGE
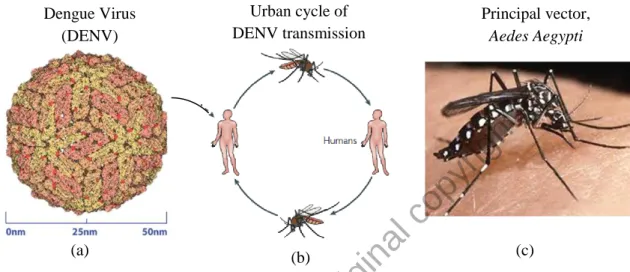
1.1 Urban cycle (b) of dengue virus (DENV) (a) transmission between Aedes aegyti (c) and humans (Whitehead et al., 2007).
2
1.2 Distribution of countries or areas at risk of dengue transmission, worldwide, 2008 with the corresponding co- circulating serotypes. (Maria G. Guzman et al., 2010;
WHO, 2008)
3
1.3 Number of dengue cases reported to World Health Organization from 1955 – 2007. (WHO, 2009)
4
1.4 Incidence rate of dengue in Malaysia. Estimated case is referred the estimated actual case with the expansion factor of 3.42 (Shepard et al., 2013)
5
1.5 Ideal surveillance model based on survey and recommendation carried out by Gubler et al, Runge- Ranzinger et al. and PDVI. Size of circle indicate the importance of the surveillance elements
9
1.6 Example of commercial (a) ELISA kit and (b) immunochromatography rapid diagnostic test (ICT-RDT)
13
1.7 Sensitivity and specificity of commercial immunochromatographic rapid diagnostic tests (RDT) for rapid dengue diagnosis.
14
2.1 Elements of biosensor for Point of Care (POC) diagnostic.
(Vasan et al.)
19
2.2 Primary biomarkers for dengue diagnosis and the corresponding period for sensitive detection. (Rosanna W.
Peeling et al., 2010)
23
2.3 Immunoassay to detect IgG (a), IgM (b) and NS1 (c) 27 2.4 Ideal surveillance rapid diagnostic test for dengue
surveillance
28
2.5 Ultimate lab-on-a-chip for point-of-care diagnostic (Tudos et al., 2001)
30
© Thi
s i tem
is pr ot ec ted by
or igi nal
c opy
right
x
2.6 Schematic of flow injection system for immunology characterization. Inset shows the structure of 10MHz QCM formed by 8mm AT quartz wafer sandwiched by 4mm gold electrode (T. Z. Wu et al., 2005)
31
2.7 (a) Magnetic particle based immunoassay for dengue biomarker detection. (b) Schematic of PDMS based microfluidic system (Y. F. Lee et al., 2009).
33
2.8 Chemiluminescent optical fiber immunosensor (OFIS) for dengue diagnostic. Chemiluminescent signal produced from reduction of HRP is reflected into optical fiber tip and detected by a photomultiplier tube (PMT) (Atias et al., 2009)
34
2.9 Dengue specified IgM antibody detection based on surface Plasmon resonance technique provided by Biacore (Jahanshahi et al., 2014). The inset shows the immunochip that contains slab SPR waveguide (gold layer) for SPR sensing.
35
2.10 Integrated optical biosensor with LSPR channel waveguide:
(a) top view of the biosensor and (b) cross section of the LSPR channel waveguide (Wong et al., 2014)
36
2.11 Magnetic bead bioassay platform for dengue detection: (a) CMOS manufactured hall sensor to detect the quantity of magnetic bead with integrated amplifier and signal processing circuit and (b) reader system consist of custom electromagnet triggered by computer. AC signal is generated to trap the magnetic bead while DC signal is generated for magnetic washing. (Aytur et al., 2006)
38
2.12 Total internal reflection of electromagnetic wave within waveguide: (a) planar waveguide and (b) channel waveguide
43
2.13 a) Asymmetric planar waveguide with the total internally reflected optical ray zigzagging along waveguide. (b) Two orthogonal component of propagating optical ray namely transverse wavevector, kx and longitudinal wavevector, β.
Optical rays must fulfills Two conditions for mode formation: 1) total internal reflection and 2)transverse resonance condition
45
2.14 Effective index as function of thickness for the 6 lowest waveguide mode of silicon nitride planar waveguide ( Nc = 1.33, Ng =2.0, and Ns =1.46 ) with wavelength of 633nm for TE and TM polarization. Mono-mode region and multi- mode region is defined by the cut-off thickness of first-
49
© Thi
s i tem
is pr ot ec ted by
or igi nal
c opy
right
xi order mode
2.15 MATLAB numerical solution of the waveguide mode effective index for silicon nitride waveguide ( Nc = 1.33, Ng =2.0, and Ns =1.46 ) with a thickness of 1000nm and TE-polarized light with a wavelength of 633nm. (a) Graphical solution of transverse resonance condition of waveguide for TE and TM-polarization light. (b) Number of mode and the regarding effective index.
50
2.16 Modal distribution of fundamental mode for silicon nitride planar waveguide ( Nc = 1.33, Ng =2.0, and Ns =1.46 ) with thickness of 1000nm and wavelength of 633nm
51
2.17 Evanescent field sensor for the application of bio-molecules detection.
52
2.18 Calculated Bulk sensitivity and Surface sensitivity for silicon nitride planar waveguide ( Nc = 1.33, Ng =2.0, and Ns =1.46 ) as function of thickness with wavelength of 633nm.
54
2.19 Schematic of integrated optical Mach-Zehnder Interferometer (Prieto et al., 2003).
55
2.20 Integration of LED (excitation element) and photodetector (readout element) with IO-MZI biosensor (sensing chip).
(Misiakos et al., 2013)
57
2.21 Basic structure of integrated optical Mach-Zehnder interferometer (IO-MZI) biosensor. Left inset shows the rib waveguide structure and corresponding modal distribution.
Right inset shows the typical output response of IO-MZI biosensor
59
2.22 \Output response of IO-MZI as function of phase change,
∆φ showing the fringe pattern and the associated intrinsic problems for determination of ∆φ from the measured output response known as “sensitivity fading”
65
2.23 Double sensitivity with the use of Bragg grating at the output end of MZI. Light is reflected by bragg grating and thus double the path length of light passing through the sensing window. This method virtually double the interaction length of sensing window
71
2.24 Calculated sensitivity of IO-MZI as function of Ng and waveguide thickness, H with interaction length of 15mm and TE-polarized light with wavelength of 633nm
72
2.25 Calculated sensitivity of IO-MZI as function of wavelength, λ and waveguide thickness, H with interaction length of
73
© Thi
s i tem
is pr ot ec ted by
or igi nal
c opy
right
xii
15mm, TE-polarized light and waveguide index, Ng of 2.0.
2.26 Calculated sensitivity of IO-MZI as function of waveguide thickness, H and interaction length, Lint with the selected TE-polarized light, wavelength of 633nm and waveguide index, Ng of 2.0
75
2.27 Summary of parameters that affect the performance of IO- MZI biosensor
77
3.1 Amplitude (a) and phase (b) of guided mode viewed in x-z plane by using 3D-FD BPM with semi-vectorial (SV) formulation
81
3.2 Effective index approximation is used to transform 3D optical waveguide into 2D optical waveguide
82
3.3 Process flow for design and simulation of IO-MZI biosensor
85
3.4 Schematic of IO-MZI with the length parameters, L and loss parameter, α of each component.
91
4.1 Single-mode condition (maximum allowable rib width for monomode) of rib waveguide as function of rib depth, d and rib thickness, H with a W resolution and a d resolution of 0.1µm and 2nm respectively. The wavelength and polarization used are 632.8nm and TE-polarization
respectively. Results for TM polarization are almost similar with TE polarization. The well-known single-mode
condition of Soref et al. (Soref et al., 1991) is shown (dashed line ---) for comparison
94
4.2 (a) Penetration depth of evanescent field as function of thickness for both TE and TM polarization. Calculated penetration depth of an equivalent slab waveguide (dashed line ---) is shown for comparison. (b) Penetration depth as function of rib width for thickness of 75nm and 250nm respectively. Different type of data point represents different rib depth
95
4.3 a) Normalized output power of IO-MZI as function of cover index change for thickness of 75 and 250nm respectively.
Fitting of the simulation result with the power function (represented by dashed line ---) is performed to obtain actual sensitivity of waveguide. See the inset for the simulated XZ distribution of IO-MZI with thickness of 250nm at phase of π (b) Comparison between simulated and calculated sensitivity of IO-MZI
96
4.4 XZ field intensity of IO-MZI when = π for rib width of 97
© Thi
s i tem
is pr ot ec ted by
or igi nal
c opy
right
xiii
4µm (a) and 3µm (b) with rib height of 250nm and rib depth of 2nm.
4.5 Correlation between bulk sensitivity and evanescent field penetration depth for TE and TM polarization. Calculated value is shown for comparison
98
4.6 Comparison of waveguide mode with thickness of 75nm (a) and 250nm (b) with the dark line indicates the boundary of rib waveguide. The penetration depth of mode into cladding and substrate layer is 1um and 1µm and 0.5µm for
waveguide thickness of 75nm and 250nm respectively
99
4.7 Power transfer ratio as function of bending length for WG_75 and WG_250. See the inset for the simulated XZ distribution of Y-branch splitter. Separation of Y-branch splitter is 100µm. The optimized bending length for WG_250 and WG_75 are 2mm and 5mm respectively
100
4.8 (a) Basic structure of vertical taper used to convert the mode size of SMF with the waveguide IO-MZI. (b) Simulated YZ field intensity of vertical taper.
101
4.9 (a) Insertion loss of rib waveguide with Gaussian beam of 4.7um in mode size as function of input rib waveguide thickness. See the insets for modal distribution of SMF and input rib waveguide of different thickness. (b) Insertion loss of mode-size converter as function of taper length for WG_75 and WG_250. See the inset for YZ distribution and structure of mode-size converter
102
© Thi
s i tem
is pr ot ec ted by
or igi nal
c opy
right
xiv
LIST OF NOMENCLATURE
µTAS Miniaturized total analysis system 3D Three dimensions
AC Alternating current AFM Atomic force microscopy
AFRIM Armed Forces Research Institue of Medical
Ar Argon
ASSURED Affordable; Sensitive; Specific; User-friendly; Rapid;
Equipment free; Delivered to those who need it BAW Bulk acoustic wave
BPM Beam propagation method CDC Center for disease control CF Complement fixation test CF4 Tetrafluoromethane CFR Case fatality rate
CMOS Complementary metal-oxide silicon transistor CMOS Complementary metal-oxide-semiconductor
dB Decibels
DC Direct current DENV Dengue virus DF Dengue fever
DHF Dengue hemorrhagic fever DI Deionized water
DL Detection limit
DSS Dengue shock syndrome
ELISA Enzyme linked immunosorbent assay
© Thi
s i tem
is pr ot ec ted by
or igi nal
c opy
right
xv F-20 Filmetric 20
FCCS Fluorescence cross-correlation spectroscopy FD-BPM Finite difference beam propagation method FET Field effect transistor
FFT Fast fourier transform FWHM Full width at half maximum GIS Geographical information system GOF Goodness of fit
HI Hemaggluitnation inhibition assay HPM High power microscope
HRP Horse-raidsh peroxidase ICP Inductive coupled power ICT Immunochromatography IgA Immunoglobulin A IgE Immunoglobulin E IgG Immunoglobulin G IgM Immunoglobulin M IO Integrated optic
IO-MZI Integrated optical Mach-Zehnder Interferometer IUPAC International Union of Pure and Applied Chemistry JEV Japanese encephalitis virus
LED Light emitting diode
LPCVD Low pressure chemical vapor deposition LSPR Long range SPR
MZI_250 MZI with waveguide thickness of 250nm MZI_75 MZI with waveguide thickness of 75nm NAAT Nucleic acid amplification test
© Thi
s i tem
is pr ot ec ted by
or igi nal
c opy
right
xvi NEP Noise equivalent power NS1 Non-structural protein 1 OFIS Optical fiber immunosesnor PCR Polymerase chain reaction PMT Photomultiplier tube POC Point of care
POI Power overlap integral
PRNT Plaque reduction neutralization technique PVDI Pediatric Dengue Vaccine Initiative QCM Quartz crystal microbalance
RDT Rapid diagnostic test RF Radio frequency RIU Refractive index unit
RPD Relative power versus distance S/N Signal to noise ratio
SAW Surface acoustic wave SDS Sodium dodecyl sulfate SF6 Sulfur hexafluoride Si3N4 Silicon nitride SiON Silicon oxynitride SMF Single-mode fibre SOI Silicon-on-insulator
SPR Surface Plasmon resonance TBEV Thick-borne encephalitis virus TE Transverse electric
TIR Total internal reflection TM Transverse magnetic
© Thi
s i tem
is pr ot ec ted by
or igi nal
c opy
right
xvii UV Ultraviolet
VCSEL Vertical-cavity-surface-emitting laser
WG_250 Rib waveguide with thickness of 250nm, depth of 1nm and width of 4µm
WG_75 Rib waveguide with thickness of 75nm, depth of 1nm and width of 3µm
WHO World Health Organization WNV West Nile virus
XRD X-ray diffraction YFV Yellow Fever virus
Sensitivity Sensitivity of IO-MZI sensor which is defined as rate of change of phase of guided mode as cover refractive index varies. ∂φ/∂ nc
Bulk Sensitivity
Sensitivity of evanescent field on cover layer which is defined as rate of change of effective index of guided mode as cover refractive index varies, ∂Neff/∂ Nc
Surface Sensitivity
Sensitivity of evanescent field on adlayer layer which is defined as rate of change of effective index of guided mode as thickness of adlayer varies, ∂Neff/∂ df
© Thi
s i tem
is pr ot ec ted by
or igi nal
c opy
right
xviii
LIST OF SYMBOLS
∂Neff/∂ df Surface sensitivity
∂Neff/∂ Nc Bulk sensitivity
∆df Change in adlayer thickness
∆nc Change in bulk index
∆Neff Change in effective index
∆φmin Minimum phase change detectable A and B Process coefficient of oxidation process A and B Process coefficient of oxidation process
d Rib depth
dc Penetration depth of mode into cladding layer deff Effective thickness
ds Penetration depth of mode into substrate layer Eo Electric field strength (V/m)
Em Electric field intensity H Rib height or thickness
h Height of slab region of rib waveguide h Strain of polysilicon
Hx Lateral width of Gaussian beam Hc Cladding thickness
Hm Magnetic Field
Ho Thickness of waveguide for single mode behavior Hopt Optimized thickness
Hs Substrate thickness
© Thi
s i tem
is pr ot ec ted by
or igi nal
c opy
right
xix Hy Vertical width of Gaussian beam k wavevector of optical ray
kx transverse wavevector
L Wafer length of simulation window Lin Input waveguide length
Ly Y-branch bending length
Lint Interaction length of sensing window
m Mode index
Nad Refractive index of antibody Nc Refractive index of cladding layer Neff Effective index
Neffm Discrete effective index
Ng Refractive index of guide layer Ns Refractive index of substrate layer Nsi Refractive index of silicon wafer
P(z) Power as function of propagation distance P2π Maximum power detectable by photodetector Pin Power of laser source
Pmin Minimum power change detectable Pol Polarization
Pout Output power of IO-MZI
Px Lateral position of Gaussian beam Py Vertical position of Gaussian beam S Sensitivity of IO-MZI
Sad Surface sensitivity
© Thi
s i tem
is pr ot ec ted by
or igi nal
c opy
right
xx Sc Bulk sensitivity of waveguide Ssur Surface sensitivity
t Oxidation time
tox Oxide thickness
V Visibility factor of power transfer function
W Rib width
WTl Lower wafer thickness of simulation window WTu Upper wafer thickness of simulation window WW Wafer width of simulation window
α/ αtotal Total insertion loss
αin Input insertion loss
αy Excess loss of Y-branch splitter αp Propagation loss of rib waveguide
β Longitudinal wavevector or propagation constant βm Discrete propagation constants
Δx Lateral mesh for simulation Δy Vertical mesh for simulation Δz Propagation constant
θc,c Critical angle at cladding interface θc,s Critical angle at substrate interface θim Incidence angle of each mode (mth) λ Wavelength of laser source
Ρ Power
ρ Index for polarization
© Thi
s i tem
is pr ot ec ted by
or igi nal
c opy
right
xxi
Interferometer Mach-Zehnder Bersepadu Optik untuk Aplikasi Penderia Biologi
ABSTRAK
Denggi merupakan masalah kesihatan yang semakin ketara dan melibatkan lebih daripada separuh populasi dunia. Disebabkan oleh kepesatan pertumbuhan penduduk dan perubahan iklim dunia, lebih 2.5-3 bilion orang, merangkumi lebih daripada 40% daripada penduduk dunia kini berisiko tinggi untuk menghidapi deman denggi. Malaysia, yang terletak berhampiran dengan garisan khatulistiwa, merupakan salah satu negara yang paling terjejas oleh denggi di rantau Pasifik Barat. Kes-kes deman denggi di Malaysia telah melebihi sasaran negara, iaitu 50 kadar insiden deman denggi bagi setiap 100,000 penduduk sejak 2005 sehingga kini. Kit ujian denggi amat diperlukan kerana ia boleh mempercepatkan process pengesanan awal denggi di mana- mana dengan masa yang singkat. Namun begitu, penggunaan kit ujian ini bagi pengawasan denggi amat terhad kerana disebabkan kos ujian yang tinggi dan kelemahan ketepatan ujian. Oleh sebab itu, kajian ini bertujuan untuk membangunkan penderia biologi yang menenuhi keperluan kit ujian bagi pengawasan denggi terutamanya di negara-negara membanggun, di mana sumber adalah terhad. Kajian ini menggunakan teknologi penderia biologi optik tanpa tanda dalam mereka-bentuk penderia biologi ini. Reka-bentuk Interferometer Mach-Zehnder bersepadu optik telah dijalankan berdasarkan kaedah simulasi yang menggunakan perbezaan terhingga tiga dimensi secara perambatan alur. Perisian OptiBPM dipilih kerana ia adalah mesra- pengguna dan ia membolehkan simulasi tiga dimensi yang diperlukan dalam kajian ini dilaksanakan. Konsep utama kajian ini adalah untuk mengoptimumkan prestasi Interferometer Mach-Zehnder bersepadu optik melalui pengoptimuman setiap komponen, iaitu pandu gelombang optik rabung, pemecah-Y dan penukar mod-saiz.
Prestasi optima telah mencapai had pengesanan 5.448x10⁻⁷ unit indeks biasan, yang merupakan dapatan yang baru bagi penyelidikan seumpamanya, dengan menggunakan pandu gelombang rabung dengan lebar 3.5µm, kedalaman 1nm dan ketebalan 75nm.
Tambahan pula, kepekaan penderia ini telah meningkat ke 5011* 2π rad disebabkan oleh panjang interaksi yang optima, iaitu 16mm.
© Thi
s i tem
is pr ot ec ted by
or igi nal
c opy
right
xxii
Integrated Optical Mach-Zehnder Interferometer for Biosensor Application
ABSTRACT
Dengue is an emerging global health problem affecting over half the world’s population. With the rapid pace of population growth and climate change, the population at risk of dengue has reached the figure of 2.5-3.0 billions, approximately 40% of the world’s population. Malaysia, a dengue hyperendemic country located near the equator, is one of the most affected countries by dengue in Western-Pacific region.
The national target for the incidence rate of DF/DHF cases, 50 cases per 100,000 populations, has long been exceeded since 2005 until now. Rapid diagnostic test is in great demand ever since, however the current RDT is not sufficient as an effective passive surveillance system due to the high cost and lack of accuracy. Hence, this study aimed to develop a dengue RDT that is not only have the characteristics of point-of- care (POC) diagnostic but also suits the criteria needed to achieve a large scale disease surveillance in most developing countries where resources are limited. Label-free optical biosensor had been proposed to realized an ideal surveillance RDT. The design of integrated optic Mach-Zehnder Interferometer (IO-MZI) biosensor had been carried out based on the simulation and fabrication method. Simulation of IO-MZI was carried out by using three-dimensional finite difference beam propagation method with the aim of sensitivity and detection limit optimization. OptiBPM software is selected because it is user-friendly and it allows three-dimensional simulation which is needed in this research. The main concept of this research is to optimize performance of IO-MZI through the optimization of each individual component which are rib waveguide, Y- branch splitter and mode-size converter. The optimized IO-MZI achieved detection limit of 5.448x10⁻⁷ RIU, which is the novelty of this research, with the use of rib waveguide with width of 3.5µm, depth of 1nm and thickness of 75nm. Besides, the sensitivity, S of the IO-MZI biosensor has been improved to 5011*2π rad because of the optimized interaction length of 16mm.
© Thi
s i tem
is pr ot ec ted by
or igi nal
c opy
right
1
INTRODUCTION
1.1 Background
Dengue is an emerging global health problem affecting over half the world‟s population (Duane J. Gubler & Clark, 1995; Guzman et al., 2010; Monath, 1994; E.-E.
Ooi & Gubler, 2008). Due to the current induced disease burden in developing countries, dengue is considered as neglected tropical disease by World Health Organization (WHO). It is also the most important and widespread arthropod-borne viral infection in tropical and subtropical countries, mostly between latitudes 35oN and 35oS where dengue viruses (DENVs) were easily transmitted by the principal vector, Aedes aegypti.
Aedes aegypti, the primary vector of dengue original from Africa had evolved as
a peridomestic mosquito species that is highly associated with human habitation (Monath, 1994). Dengue viruses is a flavivirus within the Flaviviradae family and there are four distinct serotypes of DENV namely DENV-1, DENV-2, DENV-3 and DENV-4 (WHO, 2009). Each of them can infect human and cause similar spectrum of illness.
Flaviviradae family contains more than 70 viruses with some of them poses a threat to
public health as Yellow Fever virus (YFV), West Nile virus (WNV), Japanese encephalitis virus (JEV) and thick-borne encephalitis virus (TBEV) (Rigau-Perez et al., 1998; Whitehead, Blaney, Durbin, & Murphy, 2007). Non-human primates are the original host of DENVs where the virus evolved slowly and entered urban cycle independently an estimated 500-1,000 years ago (Whitehead et al., 2007). Virus transmission cycle between human and vector mosquito is shown in Figure 1.1. The cycle is started with the non-infective mosquito vector taking a blood meal from a
© Thi
s i tem
is pr ot ec ted by
or igi nal
c opy
right
2
1994). The infective mosquito can then easily transmit the DENVs by simply probing the skin or taking a blood meal of humans.
Figure 1.1: Urban cycle (b) of dengue virus (DENV) (a) transmission between Aedes aegyti (c) and humans (Whitehead et al., 2007).
After an incubation period of 3-8 days, infection of DENV in human body produce a broad spectrum of clinical presentation ranging from asymptomatic, undifferentiated febrile illness, dengue fever (DF) and more severe dengue hemorrhagic fever (DHF) and dengue shock syndrome (DSS) (Ministry of Health, 2010; WHO, 2009). The non-complicated dengue fever had been recognized for >200 years. The systemic DF is not life threatening but it can be fatal in its severe form; DHF and DSS.
These severe dengue had only been recognized recently and the first report of DHF is being made in 1950s. (Whitehead et al., 2007) The case fatality rate (CFR) of DSS is 12-44% and it is this DSS that claims most life of dengue patients (Rigau-Perez et al., 1998).
With the rapid pace of population growth and climate change, the population at risk of dengue has reached the figure of 2.5-3.0 billion, approximately 40% of the world‟s population (Guzman et al., 2010; PDVI, 2009). According to the report of
Urban cycle of DENV transmission Dengue Virus
(DENV)
Principal vector, Aedes Aegypti
(a) (b) (c)
© Thi
s i tem
is pr ot ec ted by
or igi nal
c opy
right