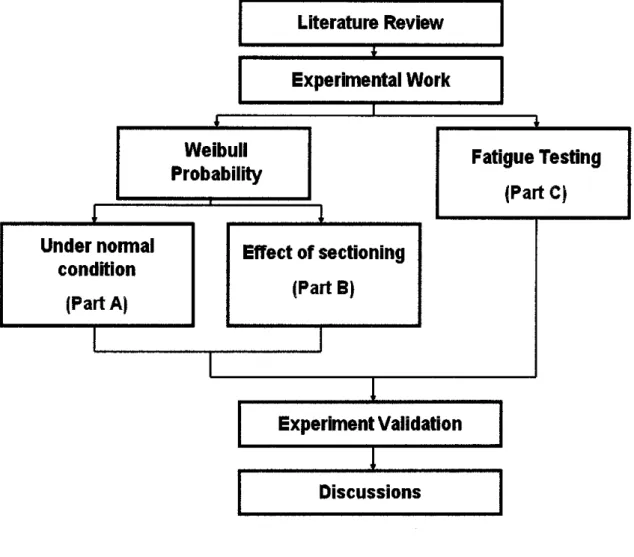
As smelting processes become more refined, the size of the inclusions falls below the level of detectability by the non-destructive testing methods. In the first part of the project, Weibull probability was used to predict the largest oxide inclusion size and compare with the actual observation under the scanning electron microscope. In the third part of the project, rotary fatigue tests were performed under cantilever loading using two sets of medium carbon steel specimens.
With a limited solubility of oxygen in solidified steel, steelmakers use total oxygen content as an adequate measure of the total oxide inclusions present in steel. The idea of the study is obtained from books and journals as cited in the reference. For fatigue strength application, this is insufficient as inclusion critical size and the probability that specimen will not cut to the center of the inclusion does not exist.
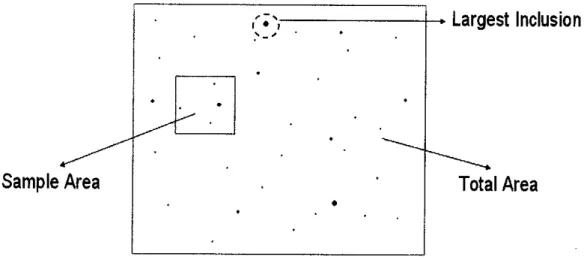
Therefore, the initial part of the teeming string has higher inclusion content than the later part. Sampling can also be done earlier in the process by removing liquid metal from the ladle or sump to estimate the total oxygen content. TheJarea is defined as the square root of the area by projecting the small defect on the plane perpendicular to the maximum tensile stress.
The proposed prediction equation of the fatigue strength of specimens with a small defect subjected to uniaxial cyclic loading under the stress ratio R= -1 [17]:.
![Figure 1: Locations that Oxide may be introduced in Continuous Casting [8]](https://thumb-ap.123doks.com/thumbv2/azpdforg/10269624.0/14.846.132.675.789.1043/figure-1-locations-oxide-introduced-continuous-casting-8.webp)
Jareaf
Many models for small defects have been proposed, but they mostly cover only simple geometries. For this situation, Murakami and Endo [17] proposed a geometric parameter Jarea, which succeeded in deriving a simple equation to predict the fatigue strength of steel with small defects. The Weibull probability is a statistical distribution used to predict the probability of an event given a set of prior knowledge.
Murakami and co-workers [lc] have used Weibull distribution to predict the largest inclusion size of steel product based on a given sample.
Y = fi\nx + lna
Perform Weibull probability of predicting presence of largest inclusion in each sample
Compare results obtained from step 2 against step 3
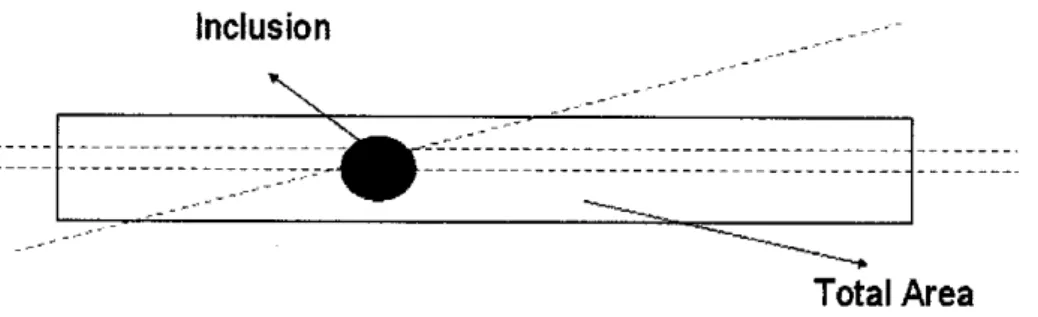
Idea overview: When the incision is made, there is a good chance that the incision does not cross the center of the inclusion (see Figure 11). This is important to investigate because the order of magnitude of oxide inclusion is small. In order to test the effect of the apparent size of oxide inclusions on the Weibull probability, the inclusions must be of known size and well distributed.
With this in mind, it is suggested to use nodular castiron representing nodules as inclusions [lg]. Apparent oxide inclusion size is defined as the size of the inclusion measured when the sample is cut not through the center of the oxide inclusion. If it is divided through the center of the oxide inclusion, it is known as the true size of the oxide inclusion.
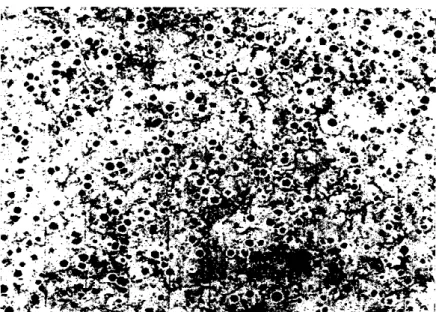
By drawing equally spaced lines, whereby each line passes over each individual nodule only once, the inclusion apparent sizes are measured as if the observer were looking from the side. Since the top view of the nodular cast iron can be seen (see Figure 12), the true inclusion size is directly known for each line. Equally spaced parallel lines are drawn with the condition that the two adjacent lines do not cross through the same single graphite nodule.
The Weibull probability procedure is applied, except that /max truej represents the maximum true nodule size while Imsx_ apparent, j represents apparent.
Procedure ofWeibull probability is applied, except that /max truej represents true maximum size ofnodule while Imsx_ apparent,j represents apparent
Overview of idea: Fatigue fracture is initiated by stress, in this case by globular oxide inclusion (defect). Once initiated at the fault, the edge of the crack acts as a stress intensifier and thus helps propagate the crack until final fracture. This Part shall prove that the specimen labeled in Part A as having good or poor fatigue strength actually exhibits the expected result.
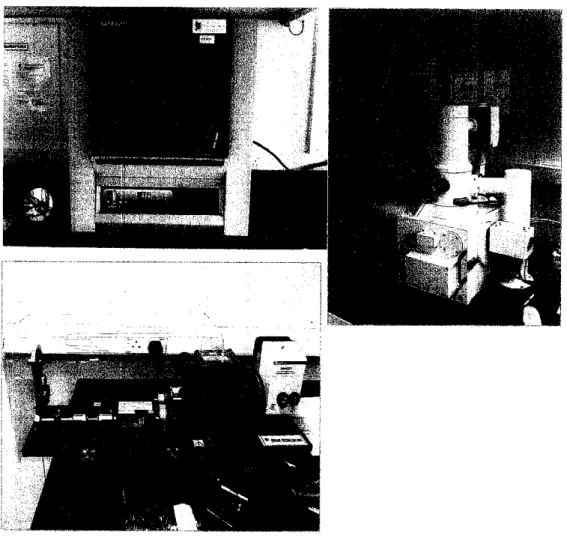
His choice of reversing the stress on a specimen by using a cantilever rotated about its longitudinal axis. This results in the voltage at any point on the surface of the cantilever varying sinusoidally. As received, the diameters of the two sets of rolled bars were 10mm and 12mm respectively.
The sample of each set is loaded with predetermined load (in MPa), and then the apparatus is started.

Miscellaneous: Furnace, magnifying glass andoptical microscope
The maximum inclusion size determined is not the true maximum size because the observation plane may not coincide with the actual diameter plane of the inclusion. ii) The assumption that only the inspected plane is applicable to the entire steel product may be too idealistic. From Table 1, the predicted size using the Weibull probability is very close to the actual size. With this result, we can conclude that the accuracy of the Weibull probability is plausible.
The inspection lines cannot be shown in Figure 15 and Figure 16 because the photographs are only part of the whole plane. /max_apparentj, known as apparent maximum size, is defined as the longest line in the node passed by the inspection line. Murakami [1] mentioned that since true maxima are always greater than the corresponding apparent maxima, the line af/max tmej is always to the right of the line /max_apparentj- hi addition, both lines must be parallel to each other.
Thus, this experiment confirmed that sample sectioning will have a negligible effect on the accuracy of the Weibull probability. The results should be ignored because at that stress level, it is approaching the ultimate tensile strength of the material, in other words, the material was probably starting to yield during the test setup. Both materials used were rolled steel bars with 0.26 percent carbon with chemical composition as in Table 9.
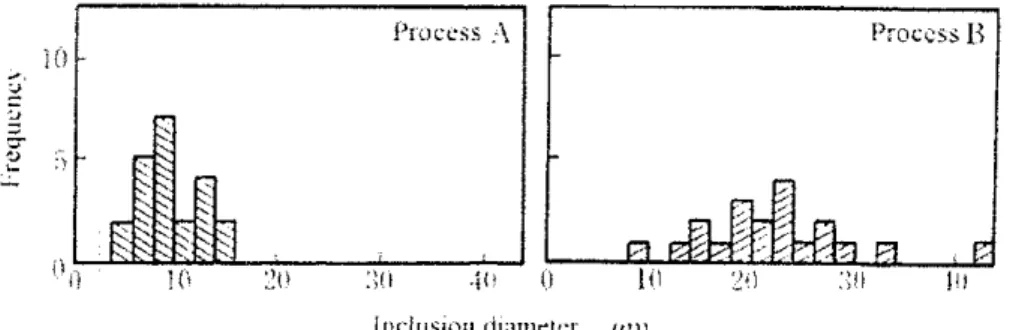
In terms of oxide purity, the Weibull probability is able to point out that steel B is purer than steel A. It also confirms the degree of accuracy by predicting the largest inclusion size as close as possible to the actual ones (See Table 9). The main objective of this final year project is essentially to investigate the feasibility of the proposed method.
For this project, the method has been proven analytically and experimentally to have reasonable accuracy in predicting the largest oxide inclusion size. It is always the largest oxide inclusion found at the origin of the fatigue crack. Kawakami: "Some problems in the application of extreme value statistics to the estimation of the maximum size of nonmetallic inclusions in metals", Trans.
Viswanathan, Conferentie van The Institute of Materials namens The Electric Power Research Institute, Californië, VS (6-7 maart 1997, Londen, VK), The University Press Cambridge UK (1996). Murakami (redacteur): "Small Fatigue Cracks: Mechanics, Mechanisms and Applications", proceedings van de Third Engineering International Conference, Elsevier Science Ltd.
![Figure 2: Possible Chemical Reactions of Steel in Ladle Refractory [8]](https://thumb-ap.123doks.com/thumbv2/azpdforg/10269624.0/16.846.105.703.375.780/figure-2-possible-chemical-reactions-steel-ladle-refractory.webp)