The Company will not receive any portion of the proceeds from the offering (for further details, see Section 8 (Use of Proceeds)). Twelve million nine hundred thousand ordinary shares, representing (100%) of the total number of shares offered.
KEY DATES AND SUBSCRIPTION PROCEDURES
How to Apply for the Offer Shares
SUMMARY OF KEY INFORMATION
OVERVIEW OF THE COMPANY History of the Company
Overview of the Company’s Business
Company Structure
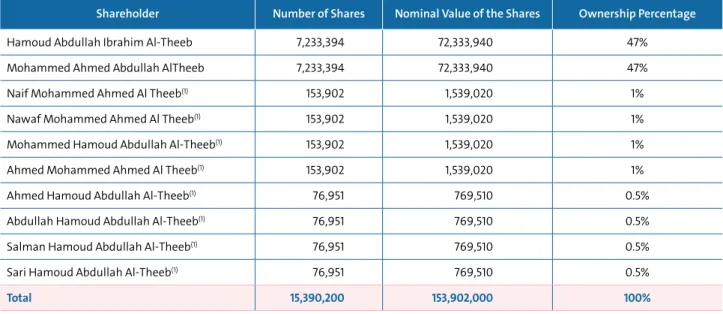
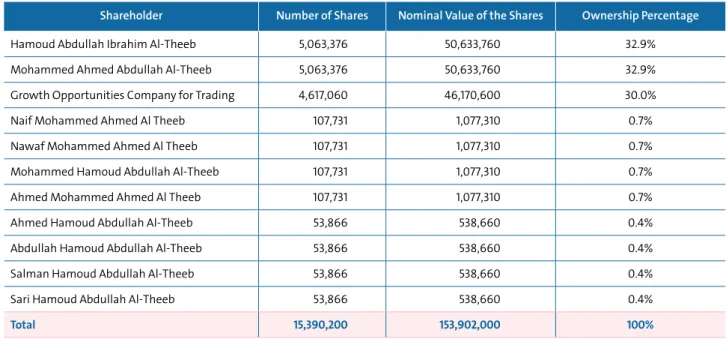
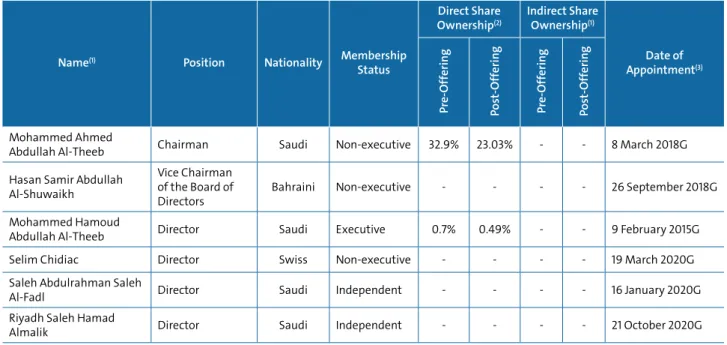
The following table shows the Company's direct ownership structure before and after the Offering:
Company’s Vision, Mission and Strategy Vision
Mission
Strategy
Company’s Competitive Advantages
Market Information
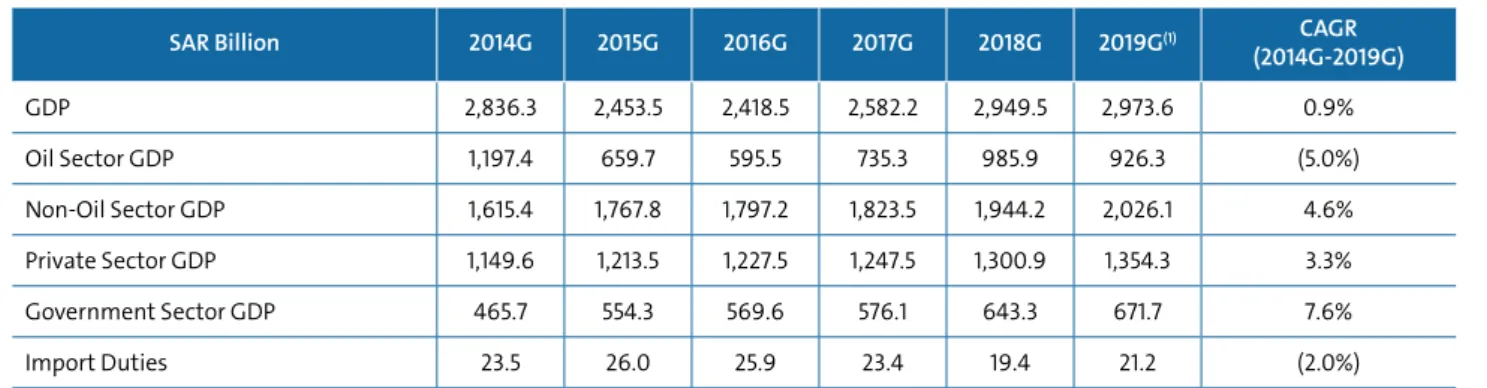
Overview of the Saudi Economy
Overview of the Car Rental Sector
Overview of the Vehicle Lease Sector
Overview of the Used Vehicle Sale Sector
Summary of Financial Information and KPIs
SUMMARY OF RISK FACTORS
Risks Related to the Operations of the Company
Risks Related to the Market, Industry, and Regulatory Environment
Risks Related to Offer Shares
Management Discussion and Analysis of the Financial Position and Operation Results 85
- Results of Operations for the Financial Years Ended 31 December 2017G, 2018G and 2019G 96
- Financing Agreements 190
- Circumstances Where Trading and Listing May be Suspended or Cancelled 221
- Shares’ Record and Trading Arrangements 223
Exhibit 4.2: Ownership structure of growth opportunities as of the date of this Prospectus 42 Exhibit 4.3: Geographical location of the company's leased branches as of March 31, 2020G 46. Exhibit A.1: Ownership structure of the company for growth Date of this Prospectus 346.
DEFINITIONS AND ABBREVIATIONS
Ordinary General Assembly An ordinary General Assembly of Shareholders of the Company convened in accordance with the by-laws. Senior Executives Members of the Company's senior management whose names appear in Table 5.5 (Details of Senior Executives).
RISK FACTORS
- Risks Related to the Operations of the Company
- Risks Related to Growing Importance of Internet Bookings for Car Rentals
- Risks Related to Structural Changes in the Transportation Industry
- Risks Related to Concentration of Revenue in Top Five Branches
- Risks Related to the Company’s Inability to Implement its Growth Strategy in the Future
- Risks Related to Seasonal Factors
- The Risks Related to Epidemics
- Risks Related to the Company’s Reputation and the Quality of the Services Provided
- Risks Related to Closure of Some of the Company’s Branches
- Risks Related to Inaccurate Estimates of Costs for Rental and Lease Pricing Purposes
- Risks Related to Inaccurate Estimates of Future Demand Levels of Car Rental
- Risks Related to Vehicles Purchase
- Risks Related to the Company’s Selling of Vehicles upon Retirement
- Risks Related to the Opening of New Car Rental Branches
- Risks Related to Leasing Real Estate Properties
- Risks Related to Airport Branch Leases
- Risks Related to Related Party Transactions and Agreements
- Risks Related to the Participation by Some of Directors and Senior Executives in Competing Businesses with the Company’s Business
- Risks Related to Loss of Major Vehicle Lease Customers
- Risks Related to Inability to Adequately Maintain the Confidentiality and Integrity of Customer and Employee Data
- Risks Related to Credit Card and Mada Card Payments
- Credit Risk Related to Collecting Receivables from the Company’s Customers
- Risks Related to Financing
- Risks Related to Personal Guarantees Provided by Shareholders
- Risks Related to Adverse Changes in Interest Rate
- Risks of Reliance on Senior Management and Key Personnel
- Risks Related to Failure to Attract and Retain Qualified Employees
- Risks Related to Employee Misconduct and/or Errors
- Risks Related to Reliance on Information Technology Infrastructure
- Risks Related to Adequacy and Unavailability of Insurance Coverage
- Risks Related to Litigation
- Risks Related to Developing and Maintaining Favourable Brand Recognition
- Risks Related to Marketing Activities
- Risks Related to Protection of Intellectual Property Rights
- Risks Related to Potential Tax and Zakat Liability
- Risks Related to Newly Implemented Corporate Governance Rules
- Risks Related to Failure by the Audit Committee and the Nomination and Remuneration Committee to Perform their Duties as Required
- Risks Related to Lack of Experience in Managing a Publicly Listed Company
- Risks Related to the Market, Industry, and Regulatory Environment .1 Risks Related to Consumer Spending due to Weak Economic Conditions
- Risks Related to Political Instability and Security Concerns in the Middle East Region
- Risks Related to Force Majeure and Natural Disasters
- Risks Related to Competition and Market Share of the Company
- Risks Related to Changes in the Regulatory Environment
- Risks Related to Value Added Tax
- Risks Related to Changes in Energy Prices
- Risks Related to Exchange Rates
- Risk Related to Licences and Approvals
- Risks Related to Change in the Mechanism of Calculating Zakat and Income Tax
- Risks Related to the Increase in Government Fees Applicable to Non-Saudi Employees
- Risks Related to Non-Compliance with the Saudisation Requirements
- Risks Related to the Offer Shares
- Risks Related to Post–Offering Effective Control by the Current Shareholders
- Risks Related to Absence of a Prior Market for the Shares
- Risks Related to Selling a Large Number of Shares in the Market
- Risks Related to Issuance of New Shares Post Offering
- Risks Related to Fluctuation in the Market Price of the Shares
- Risks Related to Distribution of Dividends and Restrictions Imposed on Distribution of Dividends by Financers
Any of the foregoing would have a material adverse effect on the Company's business, financial condition, results of operations and prospects. This will have a significant negative impact on the Company's business, financial position, operating results and future prospects.
MARKET OVERVIEW
- Macro-Economic Overview .1 Economic Aspects
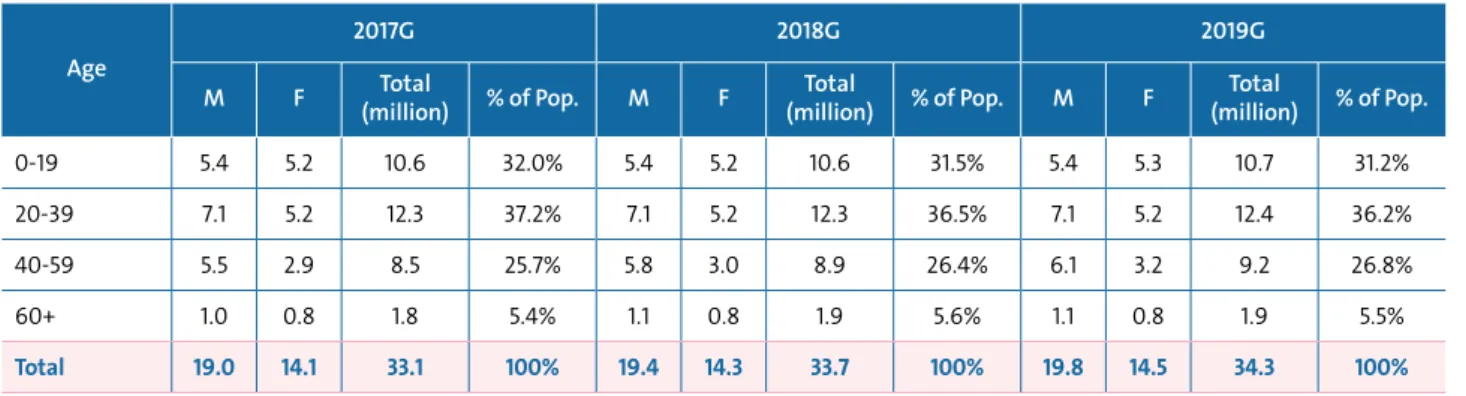
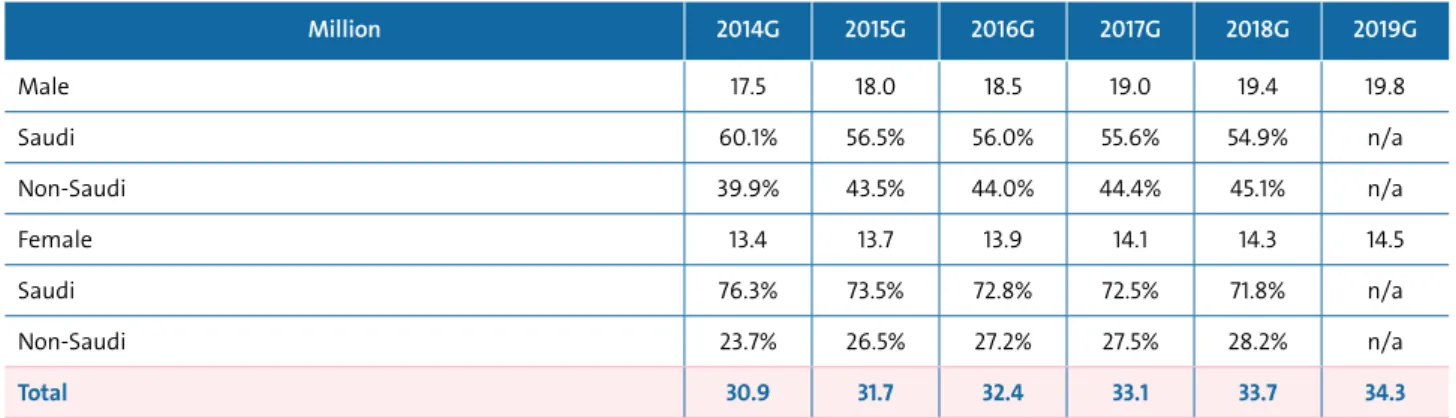
- Demographics
- Labour Market
- Household Income
- Transportation Sector in the Kingdom
Although the Kingdom suffered a decline (81%) in FDI inflows between 2016G and 2017G, the inflow of FDI into the Kingdom. This, in turn, will accelerate the urbanization of these cities and other metropolitan areas in the Kingdom.
3.1.6 “Vision 2030” and Supporting Programs
Recent Regulatory Changes
Nitaqat Program: The Ministry of Human Resources and Social Development introduced the "Nitaqat" program to increase Saudiization by restricting work at car rental locations to Saudi nationals only (applicable to front desk staff only). The initiative was reinforced with the announcement of Vision 2030 in 2016G, with the effective deadline for car rental locations in March 2018G to comply. Minimum fleet size requirements: The Public Transport Authority has established categories for car rental companies and adopted rules defining the vehicle fleet requirements according to each category.
Management of branches: In 2019, the Ministry of Municipalities and Rural Affairs issued a new proposal to set out broader requirements applicable to car rental branches relating to their management, structuring, safety control and safety maintenance.
Industry Overview
- Industry Value Chain
Car Rental Market
- Market Segmentation
- Market Characteristics
- Estimated Market Size
- Historical Developments
Customer loyalty programs: In addition to the quality of cars and after-sales support, established car rental companies offer loyalty programs (possibly in partnership with airlines or other service providers) and/. Regulation: Car rental companies must comply with the recent laws and regulations imposed by the relevant government entities (see Section 3.1.7 (Recent Regulatory Changes) for more details). Tourism: Despite the slower development of domestic travel, which decreased from 18.0 million trips in 2016G to 15.6 million in 2019G, domestic tourism expenditure increased by 19.0% over the same period, reflecting positively on the car rental market performance.
The tourism sector is expected to remain an important driver, fueled by entertainment reforms and the country's opening to international tourism. Entertainment reforms: According to the Saudi Vision 2030 program (source: Government Vision 2030), the Kingdom has started developing its entertainment sector. In 2018, the General Authority of Entertainment (GEA) hosted more than 5,000 events in the country (Source: Government Vision 2030).
Infrastructure development: The demand for car rental is also closely linked to new developments in infrastructure and transport.

Vehicle Leasing Market
- Market Characteristics
- Estimated Market Size
- Historical Trends
Car rental companies serve a variety of business customers, including small and medium-sized enterprises, for-profit and not-for-profit corporations and government entities (eg Ministries, Authorities, Royal Commissions). High income visibility due to long term contracts: Car rental customers typically commit to a rental contract with a fixed amount and a fixed period, which is usually two to five years. Fast customer support is key: Car rental customers are particularly sensitive to the rental company's ability to provide prompt, high-quality maintenance across the country (eg mobile workshops) as well as a vehicle replacement if necessary.
Customer relationship: Leasing customers typically require a single point of contact, and a fleet coordinator is usually offered to customers leasing a hundred or more vehicles. Price sensitivity: Competitive pricing for both the vehicle and the service charges is an important selling proposition for leasing customers. Replacement of purchase with operating lease: The Kingdom experienced an increased conversion rate from outright purchase and financial leasing to operating leasing, especially the Saudi government (eg ministries or authorities) and semi-government entities.
Impact of Giga-/Mega-Projects: The Kingdom is currently witnessing a great variety and scale of development projects known as “Giga-/Mega-Projects”.

Used Vehicle Market
- Market Segmentation
- Market Characteristics
- Market Developments
Local used vehicle sales and remarketing expertise: Used vehicles can be sold through various remarketing channels. As the market is concentrated in car dealer groups, there are no original equipment manufacturer purchases or independent third-party price guides, car rental and leasing companies require local expertise to sell their vehicles used. The lack of a remarketing structure for the resale of used vehicles in the country may represent a further barrier to entry for global players.
Resale showrooms and relationships with car dealers: Local expertise and relationship with car dealers represents a strong added value due to the weak remarketing structure. Switch to used vehicle purchases: There has been a gradual shift from new car sales to used vehicle purchases across the Kingdom in light of the overall economic slowdown resulting from the drop in oil prices in international markets during 2016G (see section 3.1 (Macro-economic overview) for more details). This together with the introduction of Value Added Tax (5% tax introduced in January 2018G) resulted in lower consumer confidence and propensity to spend on new vehicles and greater demand for used vehicles.
Leasing segment growth: Leasing segment growth increased the volume of used vehicles in the three- to five-year-old car segment.
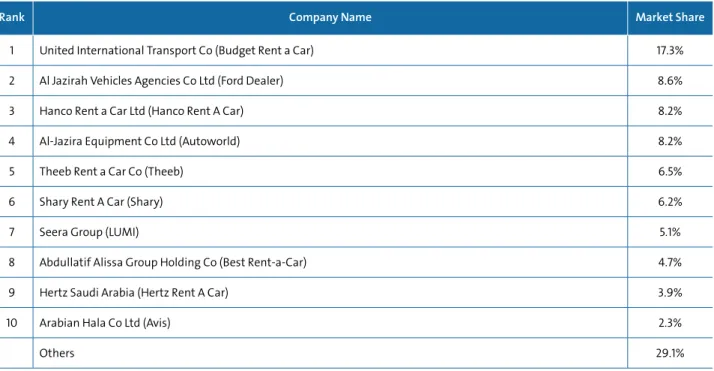
Competitive Landscape
Leasing market: The Kingdom's car leasing market is mainly dominated by the five largest players who together capture 48.8% of the value market share, with United International Transport Co having the largest share at 17.3%. The rest of the market is divided between other rental companies or car agents such as Shary and Seera. The market is relatively concentrated compared to the rental market, with top players (i.e. companies with +2% market share) accounting for 70.9% of the market.
BUSINESS DESCRIPTION 1 Overview
- Corporate History and Evolution of Capital
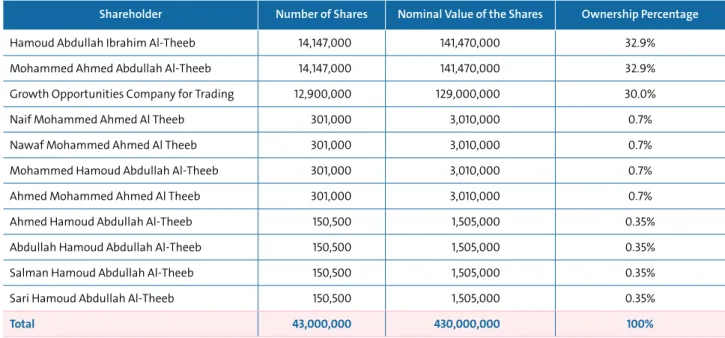
- Current Shareholding Structure .1 Overview
- Overview of Substantial Current Shareholders
- Organizational Description of the Company and its Subsidiaries
- Vision, Mission and Strategy .1 Vision
- Mission
- Strategy
- Competitive Advantages
- Overview of the Company’s Business
- Business Segments
- Fleet
- Marketing and Promotion
- Insurance and Risk Management
- Information Technology Systems
- Suppliers
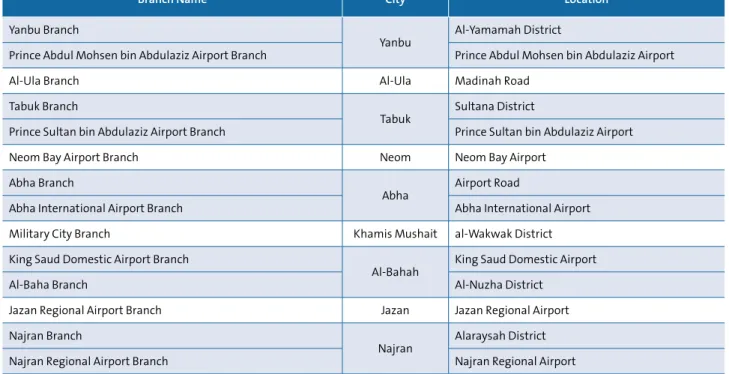
- Geographic Locations and Operations
- Awards
- Future Plans and Initiatives
- New Branch Openings
- Branch Renovation
- New Workshops and Administrative Offices
- IT System Integration with Government Platforms
- Overview of Company Departments
- Operations Department
- Corporate Department
- Marketing and Public Relations Department
- Customer Relations Department
- Used Vehicles Sales Department
- Business Development and Digital Transformation Department
- Information Technology Department
- Procurement and Warehouses Department
- Finance Department
- Compliance Department
- Human Resources & Administration Department
- Internal Audit and Control Department
- Corporate Social Responsibility
- Business Continuity
The following chart shows the ownership structure of the company as of the date of this prospectus: As of the date of this prospectus, Growth Opportunities operates primarily as a holding company that holds shares in the company (representing 30% of its capital). No supplier (excluding fleet purchases) had more than a 30% share of the company's supply needs in the same period.
The Operations Department is responsible for overseeing the operations of the Company in the Kingdom.

ORGANIZATIONAL STRUCTURE AND CORPORATE GOVERNANCE 1 Organizational Structure
- Board of Directors and Secretary of the Board of Directors .1 Composition of the Board of Directors
- Responsibilities of the Board of Directors
- Service Contracts and Employment Contracts with the Board of Directors
- Biographies of the Directors and the Secretary
- Board of Directors Committees
- Audit Committee
- Biographies of the Members of the Audit Committee
- Nomination and Remuneration Committee
- Biographies of the Members of the Nomination and Remuneration Committee
- Senior Management
- Overview of Senior Management
- Biographies of Senior Executives
- Employment Contracts with Senior Executives
- Remuneration of Directors and Senior Executives
- Corporate Governance
- Conflicts of Interest
- Employees
- Number of Employees
- Saudisation
The Companies Act, the Corporate Governance Regulations, the Bylaws and the internal governance regulations of the Company determine the duties and responsibilities of the Board of Directors. The Board of Directors has full powers to manage the business of the Company and supervise its affairs. The Board delegates responsibility for overall day-to-day management of the Company to the Company's senior management.
The members of the board of directors receive remuneration in accordance with the articles of association of the company in a manner that does not conflict with the legal controls issued in this regard. The Board of Directors established committees to optimize the management of the company and to meet the relevant regulatory requirements. Their membership will end with the end of the current board term on 22/07/1442H (corresponding to 6 March 2021G).
The Nomination and Remuneration Committee oversees the nomination of Directors to the Board and the remuneration policy for the Directors and the members of the Company's senior management.

Management Discussion and Analysis of the Financial Position and Operation Results
- Introduction
- Directors’ Declaration on the Financial Statements
- Key Factors Affecting the Company’s Operations
- Economic Conditions
- Spread of Epidemics
- Fleet Management and Operation
- Lease
- Competition
- Seasonal Factors
- Value Added Tax
- Risks Associated with Non-Compliance with Saudisation Requirements
- Key Accounting Estimates and Assumptions .1 Basis of Preparation
- Basis of Measurement
- Functional and Presentation Currency
- Level of Precision
- Statement of Compliance
- Accounting Estimates and Judgements
- Changes to the Company’s Accounting Policies
- Summary of the Most Significant Accounting Policies .1 Property and Equipment
- Results of Operations for the Financial Years Ended 31 December 2017G, 2018G and 2019G
- Statement of Profit or Loss and Other Comprehensive Income
- Revenue by Business Segment
- Rental Revenue by Region
- Rental Revenue by Branch Type
- Lease Segment
- Lease Revenue by Type of Vehicle
- Sale of Used Vehicles
- Cost of Revenue
- Profit by Segment
- Selling and Marketing Expenses
- General and Administrative Expenses
- Expected Credit Losses
- Other Income
- Finance Charges
- Zakat
- Net Income
- Other Comprehensive Income
- Balance Sheet
- Non-Current Assets
- Current Assets
- Non-Current Liabilities
- Current Liabilities
- Equity
- Statement of Cash Flows
- Capitalization and Indebtedness
- First-Time Adoption of International Financial Reporting Standards (IFRS)
Wages and other employee benefits increased by 11.7% from SAR 44.5 million in 2018G to SAR 49.7 million in 2019G due to the increase in overtime and incentives linked to the company's strong growth during the year. Advertising expenses decreased by 15.4% from SAR 2.4 million in 2017G to SAR 2.1 million in 2018G, primarily due to the company's decision to discontinue outsourced marketing services. Advertising costs amounted to SAR 2.1 million in 2019G without significant changes compared to advertising costs in 2018G.
Supply expenses increased by 61.6% from SAR 741 thousand in 2018G to SAR 1.2 million in 2019G, mainly as a result of the reallocation of part of the expenses to general and administrative costs. The company revised its depreciation estimates in 2018G, resulting in a 59.1% decrease in depreciation expense from SAR 3.7 million in 2017G to SAR 1.5 million in 2018G. Other income - vehicle agents increased by 32.4% to SAR 1.9 million in 2019G, in line with the increase in the company's fleet and the number of vehicles purchased.
Prepaid car insurance mostly relates to the insurance of the vehicles which increased from SAR 6.0 million on 31 December 2017G to SAR 7.8 million on 31 December 2018G in line with the growing fleet. Accrued income (net) increased from SAR 5.8 million on 31 December 2018G to SAR 7.8 million on 31 December 2019G in line with the growth in the Company's rental segment. As at 31 December 2019G, accounts payable increased to SAR 3.5 million, driven mainly by the increase in payables to insurance providers.

December 2017G (Restated)
- Results of the Operations for the Three-Month Period Ended 31 March 2019G and 2020G
- Statement of Profit or Loss and Other Comprehensive Income
- Revenue by Business Segment
- Rental Revenue by Region
- Rental Revenue by Branch
- Lease Segment
- Lease Revenue by Type of Vehicle
- Sales of Used Vehicles
- Cost of Revenue
- Profit by Segment
- Selling and Marketing Expenses
- General and Administrative Expenses
- Expected Credit Losses
- Other Income
- Finance Charges
- Zakat
- Net Income
- Other Comprehensive Income
- Balance Sheet
- Non-Current Assets
Revenue costs – (rent) increased from SAR 72.9 million for the three-month period ended March 31, 2019G to SAR 93.4 million for the three-month period ended March 31, 2020G. The cost of vehicles sold increased from SAR 23.4 million during the three-month period ended March 31, 2019G to SAR 44.0 million during the three-month period ended March 31, 2020G. This is primarily due to the increase in the number of vehicles sold from 907 vehicles during the three-month period ending March 31, 2019G to 1,585 vehicles during the three-month period ending March 31, 2020G.
General and administrative expenses increased by 2.6% from SAR 7.2 million in the three-month period ended March 31, 2019G to SAR 7.4 million during the three-month period ended March 31, 2020G . In addition, the total average price of vehicles sold increased during the three-month period ended March 31, 2020G due to an improvement in market conditions. Revenue from truck contracts increased by 40.9% from SAR 7.9 million in the three-month period ended March 31, 2019G to SAR 11.1 million in the three-month period ended March 31, 2020G.
Depreciation expense decreased slightly from SAR 51 thousand during the three-month period ended March 31, 2019G to SAR 46 thousand during.