The Saudi Insurance Market Report
2018
The General Department of Insurance Control
Table of Content
Introduction 5
Insurance Market Performance - Overall
• Gross Written Premiums 7
• Insurance Penetration 8
• Insurance Density 9
• Gross Written Premiums by Line of Business 10
• Net Written Premiums by Line of Business 12
• Retention Ratio by Line of Business 14
• Gross Claims Paid by Line of Business 15
• General and Health Net Earned Premiums vs. Net Claims Incurred 16
• Market Profitability 17
• Balance Sheet - Policyholders’ Assets 18
• Balance Sheet - Shareholders’ Assets 19
• Balance Sheet - Policyholders’ Liabilities and Equity 20
• Balance Sheet - Shareholders’ Liabilities and Equity 21
Insurance Market Performance - By Line of Business
• Health Insurance 23
• Protection and Savings Insurance 24
• Motor Insurance 25
• Property/ Fire Insurance 26
Table of Content
• Engineering Insurance 27
• A&L and Other Insurance 28
• Marine Insurance 29
• Energy Insurance 30
• Aviation Insurance 31
Other Market Indicators
• Gross Commissions Incurred by Line of Business 33
• Employees Breakdown by Nationality 34
• Insurance Market Structure 35
• Capitalization of Insurance Companies 36
Appendix: Data Tables
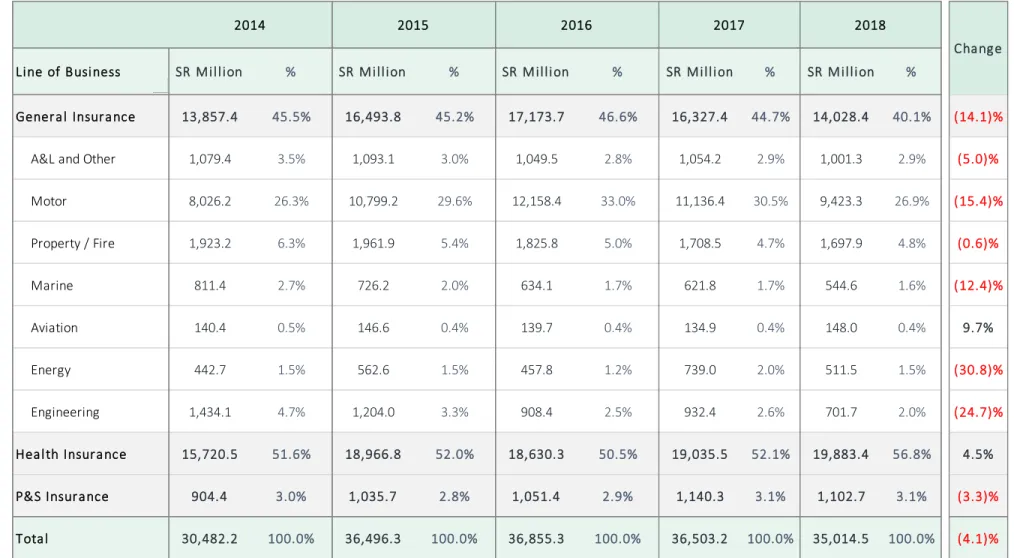
• Table 1: Gross Written Premiums by Line of Business 38
• Tables 2 & 3: Insurance Penetration and Density 39
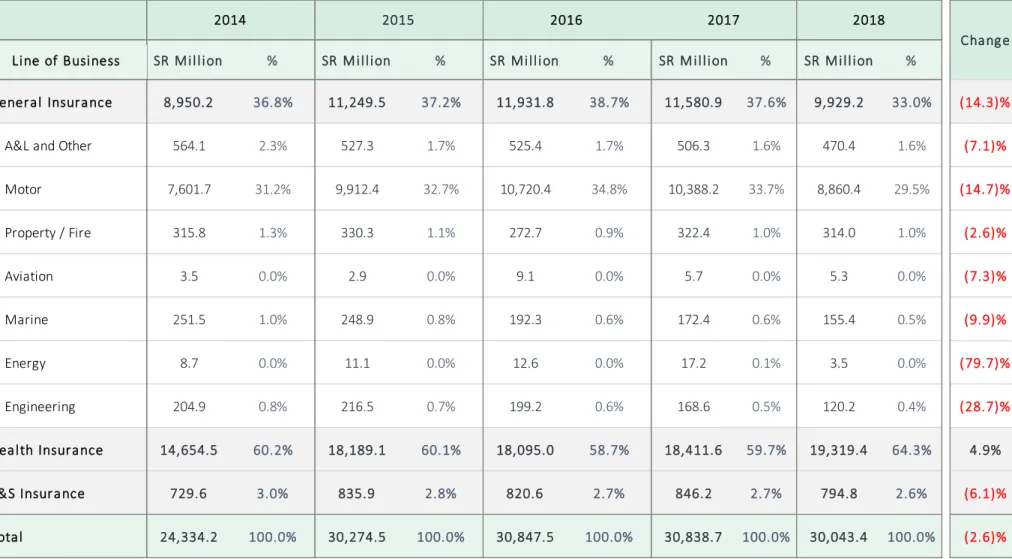
• Table 4: Net Written Premiums by Line of Business 40
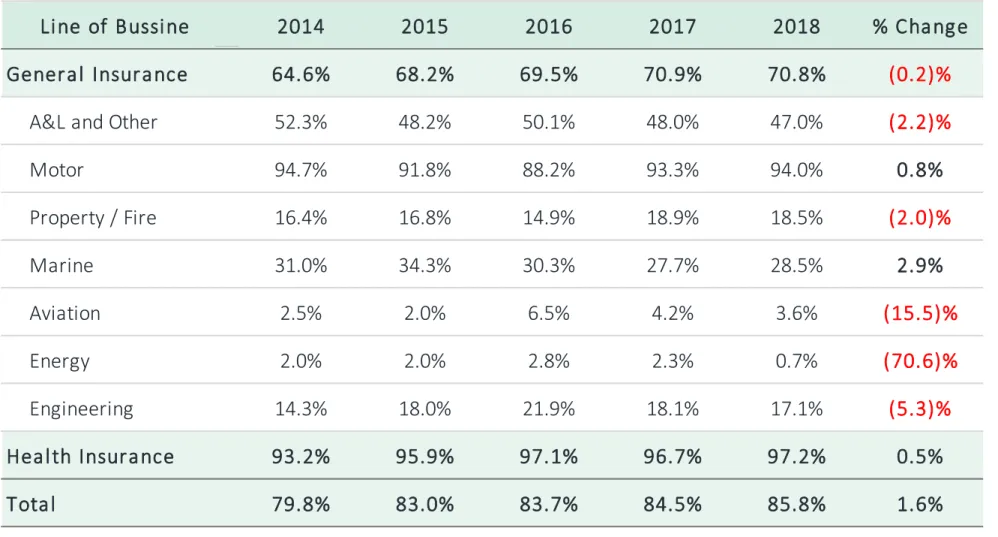
• Table 5: Retention Ratio by Line of Business 41
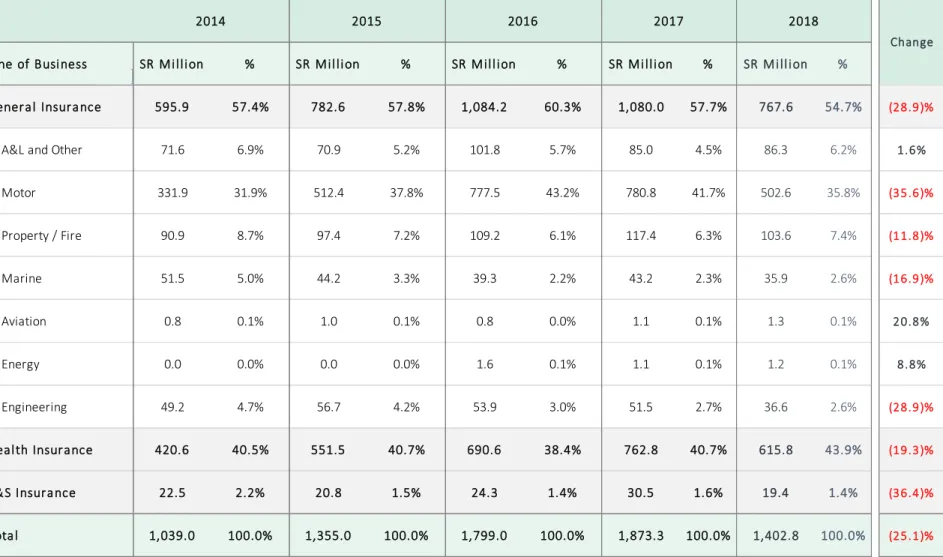
• Table 6: Gross Commissions Incurred by Line of Business 42
• Table 7: Gross Claims Paid by Line of Business 43
Introduction
• In 2018, Gross Written Premiums (GWP) in the Saudi insurance market reached SR 35.0 Billion, down from SR 36.5 Billion in 2017, which represents a decrease of (4.1%) compared to (1.0%) decrease in 2017
• Health insurance GWP increased by 4.5% in 2018 reaching SR 19.8 Billion, up from SR 19.0 Billion in 2017
• General insurance GWP, which represents 40.1% of the insurance market, decreased by (14.1%) in 2018, reaching SR 14.0 Billion, down from SR 16.3 Billion in 2017. Motor insurance representing 68.0% of General insurance GWP; decreased from SR 11.1Billion in 2017 to SR 9.4 Billion in 2018
• Protection & Savings (P&S) insurance GWP, which represents 3.1% of the insurance market, decreased by (3.3%) to reach SR 1.1 Billion in 2018 compared to a growth rate of 8.4% in 2017
• Total number of insurance polices written increased to 6,037,326 in 2018 up from 5,666,234 in 2017
Introduction
(*) This report is based on the data collected from 32 insurance and reinsurance companies
Insurance Market
Performance
Gross Written Premiums
• The overall insurance Gross Written Premiums decreased by (4.1%) to reach SR 35.0 Billion (1) in 2018, compared to SR 36.5 Billion in 2017
• Health insurance remained the largest line of business in 2018. Its contribution to total GWP in 2018 reached 56.8% compared to 52.1% in 2017, while General insurance’s contribution to total business volume in 2018 decreased to 40.1%
from 44.7% in 2017
• Protection and Savings insurance represented the smallest line of business with 3.1% share.
(1) The GWP is the total of accounted premiums for domestic insurance and reinsurance companies. There might be slight of reinsurance premiums accepted by sole domestic reinsurance from other Saudi Arabian insurers or reinsurers
Line of Business SR M % SR M % SR M % SR M % SR M %
Health Insurance 15,720.5 51.6% 18,966.8 52.0% 18,630.3 50.5% 19,035.5 52.1% 19,883.4 56.8% 4.5%
General Insurance 13,857.4 45.5% 16,493.8 45.2% 17,173.7 46.6% 16,327.4 44.7% 14,028.4 40.1% (14.1)%
Protection Insurance 904.4 3.0% 1,035.7 2.8% 1,051.4 2.9% 1,140.3 3.1% 1,102.7 3.1% (3.3)%
Total 30,482.2 100.0% 36,496.3 100.0% 36,855.3 100.0% 36,503.2 100.0% 35,014.5 100.0% (4.1)%
2014 2015 2016 2017 2018
Growth
13,857.4 16,493.8 17,173.7 16,327.4
14,028.4 15,720.5
18,966.8 18,630.3 19,035.5
19,883.4 904.4
1,035.7 1,051.4 1,140.3
1,102.7
2014 2015 2016 2017 2018
GROSS WRITTEN PREMIUMS
Protection Insurance
Health Insurance
General Insurance
35,014 36,503
36,855 36,496
30,482
Insurance Penetration
• Insurance penetration is defined as Gross Written Premiums divided by the total GDP
• In 2018, insurance penetration decreased to 1.2% down from 1.4% in 2017, both due to increase in GDP and a decrease in GWP
• Over the course of 5 years, compound annual growth rate for insurance penetration was 3.0%
• Insurance penetration of non-oil GDP is defined as Gross Written Premiums divided by non-oil GDP
• In 2018, Insurance penetration of non-oil GDP decreased to 1.8%, down from 2.0% in 2017
0.49% 0.67% 0.72% 0.64%
0.48%
0.56%
0.77% 0.78%
0.74%
0.68%
0.03%
0.04% 0.04%
0.04%
0.04%
2014 2015 2016 2017 2018
INSURANCE PENETRATION OF TOTAL GDP (1)
General Insurance Health Insurance Protection Insurance
0.87% 0.95% 0.96% 0.89% 0.73%
0.98% 1.09% 1.04% 1.04%
1.03%
0.06% 0.06% 0.06% 0.06%
0.06%
2014 2015 2016 2017 2018
INSURANCE PENETRATION OF NON-OIL GDP (2)
General Insurance Health Insurance Protection Insurance
(1) Total GDP of SR 2,821 SR 2,449, SR 2,398, SR2,570 and SR 2.934 Billion in 2014, 2015, 2016, 2017 and 2018, respectively, General Authority for Statistics (2) Non-oil GDP SR 1,601 SR 1,740, SR 1,791 SR 1,835 and SR 1.928 Billion in 2014, 2015, 2016, 2017 and 2018 respectively, General Authority for Statistics
1.20%
1.42%
1.54%
1.49%
1.08%
1.82%
1.99%
2.06%
2.10%
1.90%
Insurance Density
• Insurance density is defined as Gross Written Premiums per Capita. In 2018, Insurance density decreased to SR 1,048, down from SR 1,121 per Capita in 2017.
• Over the course of 5 years, the compound annual growth rate for insurance density was 1.0%
450.35 536.03 540.26 501.58
419.84 510.90
616.40 586.09
584.77
595.07 29.39
33.66
33.08
35.03
33.00
2014 2015 2016 2017 2018
INSURANCE DENSITY (1)
General Insurance Health Insurance Protection Insurance (1) Saudi population of 30.77, 30.77, 31.78, 32.5 and 33.4 Million in 2014, 2015, 2016, 2017 and 2018, respectively, General Authority for Statistics
991
1,168 1,159
1,121
1,048
Gross Written Premiums by Line of Business
• Motor and Health insurance represent 83.7%
of total GWP in 2018
• Health insurance remained the largest line of business in 2018, accounting for 56.8% of total GWP
• Motor insurance stood in second place with a 26.9% share of total GWP
• Motor insurance gross written premiums decreased by (15.4%) in 2018
Line of Business SR M % SR M % SR M % SR M % SR M %
Aviation 140.4 0.5% 146.6 0.4% 139.7 0.4% 134.9 0.4% 148.0 0.4% 9.7%
Energy 442.7 1.5% 562.6 1.5% 457.8 1.2% 739.0 2.0% 511.5 1.5% (30.8)%
Engineering 1,434.1 4.7% 1,204.0 3.3% 908.4 2.5% 932.4 2.6% 701.7 2.0% (24.7)%
Marine 811.4 2.7% 726.2 2.0% 634.1 1.7% 621.8 1.7% 544.6 1.6% (12.4)%
Property / Fire 1,923.2 6.3% 1,961.9 5.4% 1,825.8 5.0% 1,708.5 4.7% 1,697.9 4.8% (0.6)%
A&L and Other 1,079.4 3.5% 1,093.1 3.0% 1,049.5 2.8% 1,054.2 2.9% 1,001.3 2.9% (5.0)%
P&S 904.4 3.0% 1,035.7 2.8% 1,051.4 2.9% 1,140.3 3.1% 1,102.7 3.1% (3.3)%
Motor 8,026.2 26.3% 10,799.2 29.6% 12,158.4 33.0% 11,136.4 30.5% 9,423.3 26.9% (15.4)%
Health 15,720.5 51.6% 18,966.8 52.0% 18,630.3 50.5% 19,035.5 52.1% 19,883.4 56.8% 4.5%
Total 30,482.2 100.0% 36,496.3 100.0% 36,855.3 100.0% 36,503.2 100.0% 35,014.5 100.0% (4.1)%
2017 2018
Growth
2014 2015 2016
(1) A&L stands for Accidents and Liabilities insurance throughout the document
Gross Written Premiums by Line of Business (continued)
15,720.5
18,966.8 18,630.3 19,035.5 19,883.4
8,026.2
10,799.2 12,158.4 11,136.4 9,423.3
904.4
1,035.7
1,051.4
1,140.3
1,102.7 5,831.2
5,694.5 5,015.3 5,191.0
4,605.0
0.0 5,000.0 10,000.0 15,000.0 20,000.0 25,000.0 30,000.0 35,000.0 40,000.0
2014 2015 2016 2017 2018
GROSS WRITTEN PREMIUMS BY LINE OF BUSINESS
Other General P&S Motor Health
36,855
30,482
36,496 36,503
35,014
Net Written Premiums by Line of Business
• Net Written Premiums (NWP) is defined as the premiums retained by the insurance company, after the subtraction of the premiums ceded to local or international reinsurers from Total GWP
• Total premiums ceded to local and international reinsurers amounted to SR 300 Million and SR 4.6 Billion respectively in 2018.
• Total NWP decreased from SR 30.8 Billion in 2017 to SR 30.0 Billion in 2018, a (2.6%) decrease
• Around 94.1% of total NWP in 2018 was generated by Motor and Health insurance
• Health insurance remained the largest line of business accounting for 64.3% of total NWP in 2018
• Motor insurance’s share of total NWP remained in second place, which accounted for 29.4% of NWP in 2018
Line of Business SR M % SR M % SR M % SR M % SR M %
Aviation 3.5 0.01% 2.9 0.01% 9.1 0.03% 5.7 0.02% 5.3 0.02% (7.3)%
Energy 8.7 0.04% 11.1 0.04% 12.6 0.04% 17.2 0.06% 3.5 0.01% (79.7)%
Engineering 204.9 0.84% 216.5 0.72% 199.2 0.65% 168.6 0.55% 120.2 0.40% (28.7)%
Marine 251.5 1.03% 248.9 0.82% 192.3 0.62% 172.4 0.56% 155.4 0.52% (9.9)%
Property / Fire 315.8 1.30% 330.3 1.09% 272.7 0.88% 322.4 1.05% 314.0 1.05% (2.6)%
A&L and Other 564.1 2.32% 527.3 1.74% 525.4 1.70% 506.3 1.64% 470.4 1.57% (7.1)%
P&S 729.6 3.00% 835.9 2.76% 820.6 2.66% 846.2 2.74% 794.8 2.65% (6.1)%
Motor 7,601.7 31.24% 9,912.4 32.74% 10,720.4 34.75% 10,388.2 33.69% 8,860.4 29.49% (14.7)%
Health 14,654.5 60.22% 18,189.1 60.08% 18,095.0 58.66% 18,411.6 59.70% 19,319.4 64.30% 4.9%
Total 24,334.2 100.00% 30,274.5 100.00% 30,847.5 100.00% 30,838.7 100.00% 30,043.4 100.00% (2.6)%
2017 2018
Growth
2014 2015 2016
Net Written Premiums by Line of Business (continued)
14,654.5
18,189.1 18,095.0 18,411.6 19,319.4
7,601.7
9,912.4 10,720.4 10,388.2 8,860.4
729.6
835.9 820.6 846.2
794.8
1,348.4
1,337.1 1,211.4 1,192.7
1,068.8
0.0 5,000.0 10,000.0 15,000.0 20,000.0 25,000.0 30,000.0 35,000.0
2014 2015 2016 2017 2018
NET WRITTEN PREMIUMS BY LINE OF BUSINESS
Other general P&S Motor Health
24,334
30,275 30,847 30,839 30,043
Retention Ratio by Line of Business
• The retention ratio measures the written premiums retained by the insurance company after excluding the reinsurers share, which considered a measure of how much of the risk is being carried by the insurer. Retention ratio is calculated by dividing the NWP by the GWP
• In 2018, the overall retention ratio of insurance companies in the Saudi market reached 85.8%, up from 84% in 2017.
• In 2018, the retention ratios for Motor and Health insurance, which together represents 83.7% of total market GWP, increased to reach 94.0% and 97.2 % respectively
• The weighted average retention ratio of other General insurance lines of business (i.e., excluding Motor and Health insurance) remained unchanged at 32.0% in 2018
Notes:
• All licensed companies are required to adhere to a minimum retention ratio of 30% of its total insurance premiums (as per Article 40 of the Implementing Regulations)
• Retention ratios are not shown for Protection & Savings insurance as the savings element of the contract must be retained in the Saudi Arabian company. Therefore retentions for Protection & Savings insurance are
not directly comparable with other insurance lines of business 97%
94%
47%
29%
18%
17%
4%
1%
97%
93%
48%
28%
19%
18%
4%
2%
97%
88%
50%
30%
15%
22%
6%
3%
0% 20% 40% 60% 80% 100% 120%
Health Motor A&L and Other Marine Property / Fire Engineering Aviation Energy
R E T E N T IO N R AT IO BY L IN E O F B US IN E S S
2016 2017 2018
Weighted average excluding Motor and Health insurance
32% 85.8%
Weighted average including all lines of business
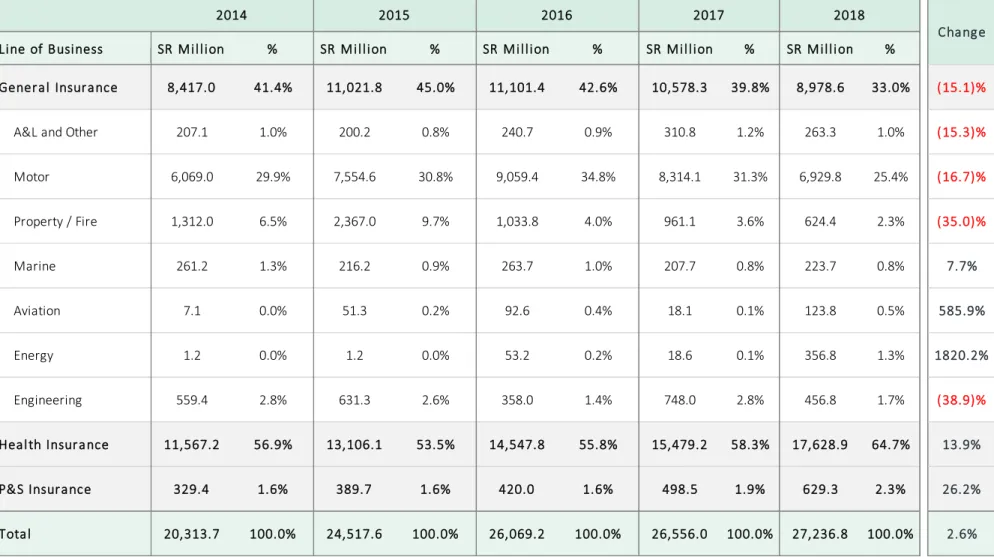
Gross Claims Paid by Line of Business
• Total gross claims paid increased from SR 26.5 Billion in 2017 to SR 27.2 Billion in 2018, which represent an increase of 2.6%
• In 2018, Health gross claims paid grew by 13.9%
whereas Motor gross claims paid decreased by (16.7%) compared to 2017
• Energy gross claims paid increased from SR 18.6 Million in 2017 to SR 356.8 Million in 2018
• Table 7 in the appendix contains all the gross claims paid data by line of business from 2014 to 2018
11,567.2
13,106.1
14,547.8 15,479.2
17,628.9 6,069.0
7,554.6
9,059.4 8,314.1
6,929.8
329.4
389.7
420.0 498.5
629.3
2,348.0
3,467.2
2,042.0 2,264.2
2,048.8
0.0 5,000.0 10,000.0 15,000.0 20,000.0 25,000.0 30,000.0
2014 2015 2016 2017 2018
GROSS CLAIMS PAID BY LINE OF BUSINESS
Other General P&S Motor Health
Health Motor Property / Fire Engineering P&S A&L and Other Marine Energy Aviation
13.9% (16.7)% (35.0)% (38.9)% 26.2% (15.3)% 7.7% 1820.2% 585.9%
% Growth
26,556
20,314
24,518
26,069 27,236
General and Health Net Earned Premiums vs. Net Claims Incurred
• Net Earned Premiums (NEP) is equal to NWP minus the change in net unearned premiums reserve
• The insurance market’s General and Health NEP totaled SR 29.2 Billion in 2018, compared to SR 29.9 Billion in 2017, a decrease of 2.3%
• General and Health Net Claims Incurred (NCI), is equal to the total of net claims paid plus the change in outstanding and IBNR claims reserve
• In 2018 General and Health net claims incurred decreased by (1.0%) to reach SR 24 Billion
• In 2018 General and Health net Loss ratio increased and reached 82.3% up from 81.3% in 2017
21,336.9
26,793.8
30,202.5 29,918.6
29,211.3
17,385.9
21,294.9
23,416.3 24,314.1 24,026.6 81.5%
79.5%
77.5%
81.3%
82.3%
75.0%
76.0%
77.0%
78.0%
79.0%
80.0%
81.0%
82.0%
83.0%
0.0 5,000.0 10,000.0 15,000.0 20,000.0 25,000.0 30,000.0 35,000.0
2014 2015 2016 2017 2018
Net Earned Premiums Vs. Net Claims Incurred
NEP NCI
Loss Ratio %NEP
Market Profitability
• Underwriting result is equal to insurance revenues including insurance investment income minus related insurance expenses.
• Shareholders operations Results includes the share of shareholders from underwriting result and the shareholder investment income minus others G&A expense.
• The net result is equal to the sum of revenues minus the sum of expenses and Zakat & Tax.
• In 2018, the underwriting result decreased to SR 295 million, compared to 840 million in 2017.
• Shareholders operations results decreased to SR 575 million in 2018, compared to SR 1,051 million in 2017.
• The insurance market’s net result declined to 183 million in 2018, compared to SR 688 million in 2017.
• Return on Assets (ROA) is the ratio of net result to total assets. In 2018, insurance market’s ROA was 0.32%
• Return on Equity (ROE) is the ratio of net result to total equity. In 2018, Insurance market’s ROE was 1.22%
Disclaimer: some 2017’s numbers have been adjusted to reflect the new classification.
840
1,051
688
295
575
183
Underwriting Result Shareholders Operations Result Net Result
2017 2018
0.32%
1.22%
ROA ROE
Insurance Market ROA/ROE
Balance Sheet - Policyholders’ Assets
• At the end of 2018 insurance
companies held SR 5.3 Billion in cash and cash equivalents in their
policyholders’ accounts compared to SR 5.5 Billion in 2017
• Investments accounted for the largest share of policyholders’ assets, with a value of SR 15.3 Billion in 2018
compared to SR 15.4 Billion in 2017
• Total Policyholders’ assets amounted to SR 41.1 Billion in 2018 compared to SR 41.2 Billion in 2017
L
2 Level3 2 0 1 7 2 0 1 8 2 0 1 7 2 0 1 8 2 0 1 7 2 0 1 8
Cash and cash equivalents 5,264,564 5,107,189 231,908 220,542 5,496,472 5,327,731 Receivables, net 7,688,326 6,857,595 171,350 120,823 7,859,676 6,978,418 Reinsurance recoverables 7,583,680 8,505,915 380,814 412,569 7,964,494 8,918,484 Deferred policy acquisition cost 802,215 776,887 3,444 3,149 805,658 780,036 Prepaid expenses 874,206 970,851 3,698 2,042 877,904 972,893
Investments 12,556,920 12,553,051 2,848,046 2,743,164 15,404,966 15,296,215
Deposits at financial institutions 9,004,633 9,203,094 23,401 15,458 9,028,034 9,218,552 Loans - - - - - - Debt securities and fixed income 2,738,460 2,681,152 28,728 - 2,767,188 2,681,152 Shares (common, preferred) 92,794 208,970 - - 92,794 208,970 Real estate 9,861 9,861 - - 9,861 9,861 Investment in subsidiaries & affiliates - - 1,069,813 1,044,975 1,069,813 1,044,975 Other 711,172 449,974 1,726,104 1,682,731 2,437,277 2,132,705 Tangible assets 419,229 413,813 5,809 1,972 425,038 415,785 Intangible assets 24,950 52,905 - 2,347 24,950 55,252 Other policyholders assets 2,252,767 2,361,099 118,625 54,763 2,371,392 2,415,861
Total 37,466,856 37,599,304 3,763,694 3,561,370 41,230,550 41,160,675
General and Health Insurance Protection and Savings
Insurance Total Insurance
* Other investments consists mainly of investments in funds related to saving products
Balance Sheet - Shareholders’ Assets
• At the end of 2018, insurance companies’
shareholders held SR 2.7 Billion in cash and cash equivalents compared to SR 2.4 Billion in 2017
• Investments accounted for the largest share of shareholders’ assets, with a value of SR 13.3 Billion in 2018 compared to SR 12.7 Billion in 2017
• Shareholders’ assets amounted to SR 17.4 Billion in 2018 compared to SR 17.9 Billion in 2017
• Insurance companies’ total assets amounted to SR 58.5 Billion in 2018 compared to SR 59.1 Billion in 2017
L
2 Level3 2017 2018
Cash and cash equivalents 2,451,944 2,759,936 Receivables, net 5,606 7,596
Investments 12,716,063 13,367,883
Deposits at financial institutions 6,820,310 7,329,389 Loans - - Debt securities and fixed income 3,083,525 3,461,761 Shares (common, preferred) 914,727 1,048,308 Real estate 6,997 6,832 Investment in subsidiaries & affiliates 255,192 309,828 Other 1,635,312 1,211,766
Tangible assets 215,759 170,454
Accrued interest, rent, income 148,359 90,634
Intangible assets 762,470 339,874
Distributions due from policyholders account 973,558 559,776 Other shareholders assets 597,893 93,051
Total Shareholders Assets 17,871,653 17,389,204
Total Assests 59,102,203 58,549,879
Balance Sheet - Policyholders’ Liabilities and Equity
• At the end of 2018, insurance companies held SR 30.9 Billion in technical reserves, which consist of unearned premiums, outstanding claims, IBNR and adjustment expense reserves compared to SR 30 .1 Billion in 2017
• Mathematical reserves amounted to SR 2.9 Billion in 2018 compared to SR 3.0 Billion in 2017
• Policyholders’ liabilities and equity amounted to SR 41.1 Billion in 2018 compared to SR 41.2 Billion in 2017
L
1 L2 Level3 2017 2018 2017 2018 2017 2018
Total Policyholders liabilities 37,062,912 37,293,047 3,712,312 3,524,111 40,775,223 40,817,158 Policyholders payables 647,065 659,629 1,698 9,172 648,763 668,801 Reinsurance balances payable 1,574,625 1,110,176 113,213 107,641 1,687,839 1,217,817 Technical reserves 29,812,991 30,585,317 374,519 406,783 30,187,510 30,992,100 Unearned premium 15,536,113 15,033,581 84,626 84,570 15,620,739 15,118,151 Outstanding claims, IBNR and
adjustment expenses 14,276,878 15,551,737 289,893 322,212 14,566,771 15,873,949 Mathematical reserves - 13,604 3,093,654 2,902,851 3,093,654 2,916,455 Other reserves 333,355 408,042 2,994 1,292 336,349 409,334 Unearned reinsurance commissions 272,591 223,443 4,709 3,094 277,300 226,538 Accrued expense and deferred income 2,360,697 2,994,152 45,446 56,693 2,406,143 3,050,845 Declared dividend payable 111,566 - - - 111,566 - Distribution due to shareholders account 919,725 578,290 53,833 18,177 973,558 596,467 Other policyholders liabilities 1,030,295 720,394 22,246 18,408 1,052,541 738,802 Accumulated surplus 392,471 299,088 51,382 55,579 443,853 354,667 Total Policyholders liabilities and Equity 37,455,382 37,592,135 3,763,694 3,579,690 41,219,076 41,171,825
General and Health Insurance Protection and Savings
Insurance Total Insurance
Balance Sheet - Shareholders’ Liabilities and Equity
• At the end of 2018, shareholders’
liabilities decreased to SR 2.4 Billion from SR 3.1 Billion in 2017 while shareholders’
equity increased to SR 14.9 Billion in 2018 compared to SR 14.7 Billion in 2017
• Share capital increased to SR 11.8 Billion in 2018 compared to SR 11.3 Billion in 2017
• Shareholders’ liabilities and equity decreased to SR 17.3 Billion in 2018 compared to SR 17.8 Billion in 2017
L
1 L2 Level3 2017 2018
Total Shareholders liability 3 , 1 5 0 ,867 2,399,505
Sharholders payables 475,038 535,538
Zakat 882,129 1,019,844
Accrued expenses and deferred income 181,097 166,861
Other shareholders liabilities 1,612,603 677,262
Total Shareholders equity 14,732,260 14,978,548
Share capital 11,358,667 11,826,667
Statutory reserves 2,112,089 2,297,414
Retained earnings 1,331,334 966,057
Other shareholders equity (69,830) (111,591)
Total Sharholders Liabilities & Equity 17,883,127 17,378,053
Total Liabilities & Equity 59,102,203 58,549,878
Insurance Market Performance - By Line of Business
Insurance Market Performance
By Line of Business
Health Insurance
• Health insurance, which includes both compulsory and non-compulsory lines, accounted for 56.8% of the 2018 total market gross written premiums (GWP) with SR 19.9 Billion in underwritten premiums
• Health insurance accounted for 64.3% of the market’s net written premiums (NWP) as insurance companies retained SR 19.3 Billion of their Health insurance GWP, which was the highest of all business lines representing a 97.2% retention ratio
• Health insurance’s net earned premiums (NEP) registered SR 18.8 Billion, representing 63.0% out of the market earned premiums
• Health insurance’s net claims incurred (NCI) amounted to SR 17.0 Billion, and resulted in a loss ratio of 90.6%
19,883.4
19,319.4
18,802.8
17,041.1
Health
GWP NWP NEP NCI
GWP NWP NEP NCI
56.8% 64.3% 63.0% 69.9%
Retention Ratio 97.2%
Loss Ratio 90.6%
% Total
Protection and Savings Insurance
• Protection and Savings insurance’s GWP totaled SR 1.1 Billion in 2018, which represent a 3.1% contribution to the market’s total business volume
• Protection and Savings insurance accounted for 2.6% of the market’s NWP, as insurance companies retained SR 794.8 Million of GWP
• Protection and Savings insurance’s NEP registered SR 634.6 Million, which represents a share of 2.1% of total NEP
• Protection and Savings insurance accounted for 1.5% of total market’s NCI in 2018 and amounted to SR 357.5 Million
Retention ratio and loss ratio are not shown due to the savings part of the premium which distorts the ratios
Motor Insurance
• Motor insurance’s GWP totaled SR 9.4 Billion in 2018, which represent a 26.9% share of total market GWP
• Insurance companies retained 94.0% of their Motor underwritten premiums .Motor insurance NWP totaled SR 8.8 Billion
• Motor insurance’s NEP amounted to SR 9.24 Billion and accounted for 31.0% of the insurance market’s NEP
• Insurance companies recorded SR 6.5 Billion in
Motor insurance’s NCI and resulted in a loss ratio of 70.9%
9,423.3
8,860.4
9,243.5
6,557.0
Motor
GWP NWP NEP NCI
GWP NWP NEP NCI
26.9% 29.5% 31.0% 26.9%
Retention Ratio 94.0%
Loss Ratio 70.9%
% Total
Property/ Fire Insurance
• Property/ Fire insurance’s GWP totaled SR 1.6 Billion in 2018, which represent a 4.8% share of total market GWP
• Insurance companies retained 18.5% of their Property/ Fire insurance premiums, as the business line’s NWP amounted to SR 314.0 Million. Property/ Fire insurance contributed 1.1% to total market NWP in 2018
• Property/ Fire insurance’s NEP registered SR 330.3 Million
• Insurance companies recorded SR 118 Million in Property/ Fire insurance’s NCI, and resulted in a loss ratio of 35.9%
1,697.9
314.0 330.3
118.5
Property / Fire
GWP NWP NEP NCI
GWP NWP NEP NCI
4.8% 1.05% 1.1% 0.5%
Retention Ratio 18.5%
Loss Ratio
% Total
35.9%
Engineering Insurance
• Engineering insurance’s GWP totaled SR 701.7 Million in 2018, which represent a 2.0%
contribution to total market GWP
• Insurance companies retained 17.1% of their Engineering underwritten premiums.
Engineering insurance NWP registered SR 120.2 Million
• Engineering insurance NEP amounted to SR 145.1 Million and accounted for 0.5% of the insurance market’s NEP
• Engineering insurance recorded a loss ratio of 48,6%, with NCI, totaling SR 70.5 Million
701.7
120.2 145.1
70.5
Engineering
GWP NWP NEP NCI
GWP NWP NEP NCI
2.0% 0.4% 0.5% 0.3%
Retention Ratio 17.1%
% Total
48.6%
Loss Ratio
A&L and Other Insurance
• Accident and Liability (A&L) insurance includes the following lines of business: personal accident, work related, employer’s liability, third party liability, general liability, product liability, medical liability, professional liability, theft & burglary, fidelity, safe burglary inside the premises and in transit and other liability products
• Insurance companies underwrote SR 1.0 Billion in A&L and Other general insurance premiums in 2018
• Insurance companies retained SR 470.4 Million of A&L and Other general insurance underwritten premiums, with a 47.0% retention ratio
• A&L and Other general insurance NEP totaled SR 515.7 Million, which represents a 1.7% contribution to market’s NEP
• Insurance companies recorded SR 175.1 Million in A&L and Other general insurance’s NCI, and
resulted in a loss ratio of 34.0%
Marine Insurance
• The Marine insurance line of business includes both marine cargo and marine hull insurance
• Marine insurance GWP totaled SR 544.6 Million in 2018, which represents a 1.6% contribution to market’s GWP
• Insurance companies retained 28.5% of their Marine insurance underwritten premiums, as the business line’s NWP amounted to SR 155.4 Million
• Marine insurance’s NEP recorded SR 160.8 Million, which represents a 0.5% share of market’s NEP in 2018
• Marine insurance’s NCI amounted to SR 46.5 Million.
This resulted in a loss ratio of 28.9%
Energy Insurance
• In 2018, Energy insurance GWP totaled SR 511.5 Million, which represents a 1.5% share of total market’s GWP
• Energy insurance NWP amounted to SR 3.5 Million, accounting for only 0.01% of the insurance market’s NWP
• Energy insurance’s NEP amounted to SR 7.5 Million, accounting for only 0.03% of the insurance market’s NEP
• Energy insurance’s NCI amounted to SR 10.8 Million.
This resulted in a loss ratio of 143.7%
Aviation Insurance
• Aviation insurance GWP reached SR 148.0 Million in 2018, a 0.4% contribution to market’s GWP
• NWP for Aviation insurance reached SR 5.3 Million, resulting in a retention ratio of 3.6%
• Aviation insurance’s NEP totaled SR 5.5 Million, accounting for only 0.02% of the insurance market’s NEP
• Aviation insurance’s NCI amounted to SR 7.1 Million.
This resulted in a loss ratio of 128.4%
Other Market Indicators
Gross Commissions Incurred by Line of Business
• Total commissions incurred amounted to SR 1.4 Billion in 2018, compared to SR 1.8 Billion in 2017, which represents a decrease of 25.1%
• General insurance related commissions accounted for 54.7% of total commissions incurred in 2018
• Health insurance’s share of total commissions incurred represented 43.9% in 2018
• Protection and Savings insurance’s commissions incurred was 1.4% of total commissions incurred in 2018
331.9
512.4
777.5 780.8
502.6 420.6
551.5
690.6 762.8
615.8 22.5
20.8
24.3
30.5
19.4
264.0
270.2
306.6
299.3
264.9
0.0 200.0 400.0 600.0 800.0 1,000.0 1,200.0 1,400.0 1,600.0 1,800.0 2,000.0
2014 2015 2016 2017 2018
Commissions Incurred by Line of Business
Other General P&S Health Motor
Motor Health Property / Fire A&L and Other Engineering Marine P&S Aviation Energy
% Growth (35.6)% (19.3)% (11.8)% 1.6% (28.9)% (16.9)% (36.4)% 20.8% 8.8%
% Total 35.8% 43.9% 7.4% 6.2% 2.6% 2.6% 1.4% 0.1% 0.1%
1,873 1,799
1,355
1,039
1,402
Employees Breakdown by Nationality
0 200 400 600 800 1000 1200 1400 1600 1800
0.0% 20.0% 40.0% 60.0% 80.0% 100.0%
Number of Employees
Saudization
Number of Employees vs. Saudization Ratio
• The total number of insurance companies’ employees in Saudi Arabia reached 11,726 in 2018, compared to 11,272 in 2017
• The ratio of Saudi nationals employed by insurance companies in 2018 increased to 72.3% of the total workforce
• The Saudization ratio for non-managerial positions increased to 76.0%, while the Saudization ratio for managerial positions increased to 55.0%
• Note: A newly licensed insurance company is required to adhere to a Saudization ratio of 30% at the end of its first year of operation and shall increase the ratio annually, according to its Saudization plan (as per Article 79 of the Implementing Regulations)
Nationality Non-Managerial Managerial Non-Managerial Managerial
Saudi 6,765 984 7,749 7,418 1,065 8,483
Other Arab 1,042 226 1,268 1,135 507 1,642
Other Non–Arab 1,474 781 2,255 1,226 375 1,601
Total 9,281 1,991 11,272 9,779 1,947 11,726
Saudization Ratio 73% 49% 69% 76% 55% 72%
2017
2017 Total
2018
2018 Total
Insurance Market Structure
• In 2018, the top 8 insurance companies generated 73.4% of the insurance market’s GWP
• The remaining 24 insurance companies included in the report accounted for the remaining 26.6% of total market premiums
Capitalization of Insurance Companies
• Insurance companies’ equity increased from SR 14.7 Billion at the end of 2017 to SR 14.9 Billion at the end of 2018
Notes: The Law on Supervision of Cooperative Insurance Companies stipulates a minimum capital of SR 100 Million for insurance companies and SR 200 Million for companies that undertake insurance and reinsurance activities
Shareholders’ Equity Number of Companies
500 M and Above 7
200 M to 500 M 18
150 M to 200 M 3
100 M to 150 M 2
50 M to 100 M 2
- 1,000 2,000 3,000 4,000 5,000 6,000 7,000 8,000
- 500 1,000 1,500 2,000 2,500 3,000
Insurance Companies' Equity
NWP
Insurance Companies’ Equity vs. NWP
Appendix: Data Tables
Table 1: Gross Written Premiums by Line of Business (2014 to 2018)
Line of Business SR Million % SR Million % SR Million % SR Million % SR Million %
General Insurance 13,857.4 45.5% 16,493.8 45.2% 17,173.7 46.6% 16,327.4 44.7% 14,028.4 40.1% (14.1)%
A&L and Other 1,079.4 3.5% 1,093.1 3.0% 1,049.5 2.8% 1,054.2 2.9% 1,001.3 2.9% (5.0)%
Motor 8,026.2 26.3% 10,799.2 29.6% 12,158.4 33.0% 11,136.4 30.5% 9,423.3 26.9% (15.4)%
Property / Fire 1,923.2 6.3% 1,961.9 5.4% 1,825.8 5.0% 1,708.5 4.7% 1,697.9 4.8% (0.6)%
Marine 811.4 2.7% 726.2 2.0% 634.1 1.7% 621.8 1.7% 544.6 1.6% (12.4)%
Aviation 140.4 0.5% 146.6 0.4% 139.7 0.4% 134.9 0.4% 148.0 0.4% 9.7%
Energy 442.7 1.5% 562.6 1.5% 457.8 1.2% 739.0 2.0% 511.5 1.5% (30.8)%
Engineering 1,434.1 4.7% 1,204.0 3.3% 908.4 2.5% 932.4 2.6% 701.7 2.0% (24.7)%
Health Insurance 15,720.5 51.6% 18,966.8 52.0% 18,630.3 50.5% 19,035.5 52.1% 19,883.4 56.8% 4.5%
P&S Insurance 904.4 3.0% 1,035.7 2.8% 1,051.4 2.9% 1,140.3 3.1% 1,102.7 3.1% (3.3)%
Total 30,482.2 100.0% 36,496.3 100.0% 36,855.3 100.0% 36,503.2 100.0% 35,014.5 100.0% (4.1)%
Change
2014 2015 2016 2017 2018
Tables 2 & 3: Insurance Penetration and Density (2014 to 2018)
Table 4: Net Written Premiums by Line of Business (2014 to 2018)
Line of Business SR Million % SR Million % SR Million % SR Million % SR Million %
General Insurance 8,950.2 36.8% 11,249.5 37.2% 11,931.8 38.7% 11,580.9 37.6% 9,929.2 33.0% (14.3)%
A&L and Other 564.1 2.3% 527.3 1.7% 525.4 1.7% 506.3 1.6% 470.4 1.6% (7.1)%
Motor 7,601.7 31.2% 9,912.4 32.7% 10,720.4 34.8% 10,388.2 33.7% 8,860.4 29.5% (14.7)%
Property / Fire 315.8 1.3% 330.3 1.1% 272.7 0.9% 322.4 1.0% 314.0 1.0% (2.6)%
Aviation 3.5 0.0% 2.9 0.0% 9.1 0.0% 5.7 0.0% 5.3 0.0% (7.3)%
Marine 251.5 1.0% 248.9 0.8% 192.3 0.6% 172.4 0.6% 155.4 0.5% (9.9)%
Energy 8.7 0.0% 11.1 0.0% 12.6 0.0% 17.2 0.1% 3.5 0.0% (79.7)%
Engineering 204.9 0.8% 216.5 0.7% 199.2 0.6% 168.6 0.5% 120.2 0.4% (28.7)%
Health Insurance 14,654.5 60.2% 18,189.1 60.1% 18,095.0 58.7% 18,411.6 59.7% 19,319.4 64.3% 4.9%
P&S Insurance 729.6 3.0% 835.9 2.8% 820.6 2.7% 846.2 2.7% 794.8 2.6% (6.1)%
Total 24,334.2 100.0% 30,274.5 100.0% 30,847.5 100.0% 30,838.7 100.0% 30,043.4 100.0% (2.6)%
Change
2014 2015 2016 2017 2018
Table 5: Retention Ratio by Line of Business (2014 to 2018)
Line of Bussines 2014 2015 2016 2017 2018 % Change
General Insurance 64.6% 68.2% 69.5% 70.9% 70.8% (0.2)%
A&L and Other 52.3% 48.2% 50.1% 48.0% 47.0% (2.2)%
Motor 94.7% 91.8% 88.2% 93.3% 94.0% 0.8%
Property / Fire 16.4% 16.8% 14.9% 18.9% 18.5% (2.0)%
Marine 31.0% 34.3% 30.3% 27.7% 28.5% 2.9%
Aviation 2.5% 2.0% 6.5% 4.2% 3.6% (15.5)%
Energy 2.0% 2.0% 2.8% 2.3% 0.7% (70.6)%
Engineering 14.3% 18.0% 21.9% 18.1% 17.1% (5.3)%
Health Insurance 93.2% 95.9% 97.1% 96.7% 97.2% 0.5%
Total 79.8% 83.0% 83.7% 84.5% 85.8% 1.6%