The biological activated sludge treatment process is the most widely used approach to treating domestic wastewater. Sludge can be reduced through two main approaches, which are post-treatment of produced sludge or in-situ activated sludge reduction. Whereas in-situ activated sludge reduction will reduce the amount of sludge produced from the source itself.
Introduction
- Overview
- Wastewater Treatment Plant Challenges
- Statement of the Problem
- Research Questions
- Thesis Structure
Furthermore, sludge can be anaerobically digested to produce energy represented in biogas (Drechsel et al., 2015). One of the main challenges is that WWTPs produce excessive volumes of sludge (Yang et al., 2018). Whereas, the in-situ activated sludge approach will reduce the amount of sludge produced from the source itself (Guo et al., 2013).
Literature Review
Wastewater Treatment Plant Simulation
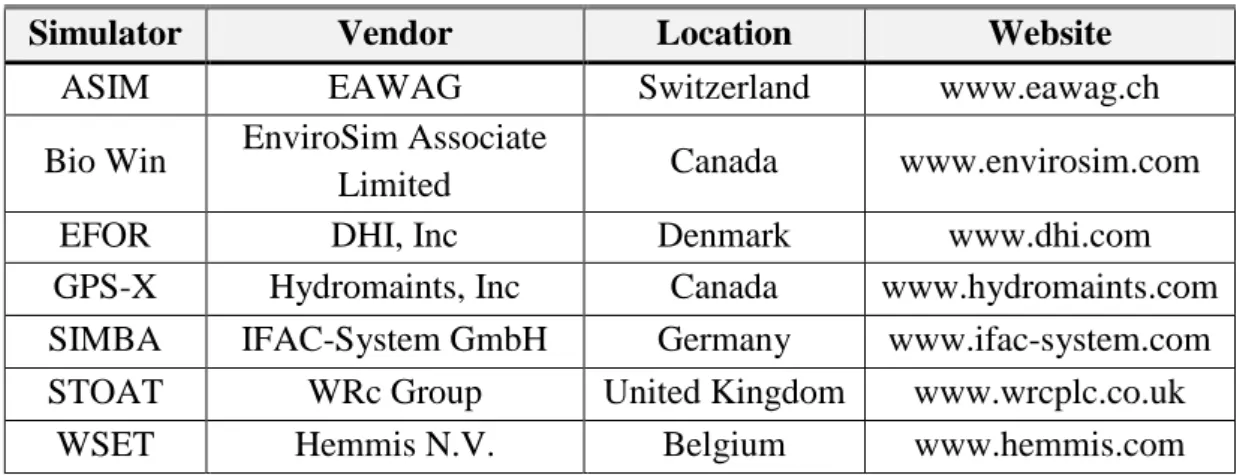
Once the machining process model has been created graphically and includes all the required data for the influencing characteristics, the simulator can be used to solve the system and generate numerical and graphical results. In 2001, a survey of available software on the market involving activated sludge modeling was conducted. BioWin, EFOR, GPS-X and STOAT are the most commonly used software by consulting firms for the design/retrofitting of new/existing wastewater treatment plants (Makinia & Zaborowska, 2020; Melcer, 2003).
Model Calibration
- The BIOMATH Calibration Protocol
- The STOWA Calibration Protocol
- The Hochschulgruppe (HSG) Guidelines
- The WERF Protocol for Model Calibration
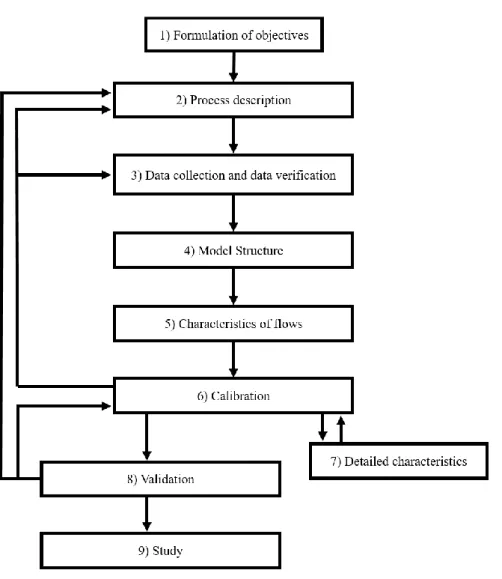
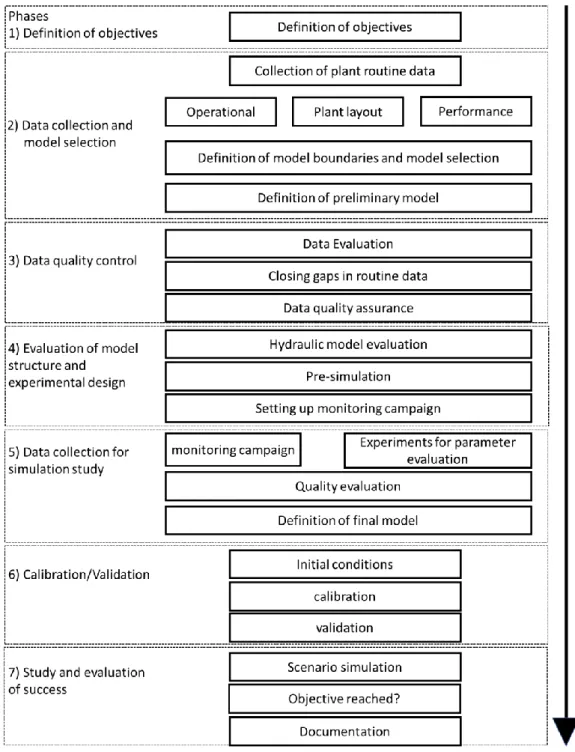
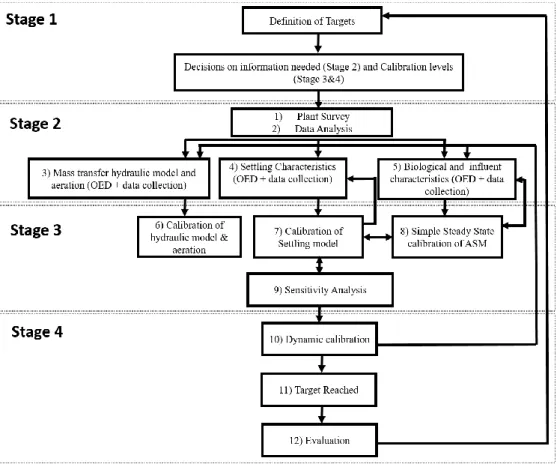
The third phase concerns the calibration of the hydraulic, aeration and sedimentation models of the WWTP. The fourth and final phase includes the use of a dynamic model to predict the variations in the performance of the RWTP due to the fluctuation in influent characteristics and operating parameters (Vanrolleghem et al., 2003). The practice of nearly 100 WWTPs simulation in the Netherlands came out with STOWA protocol composed of eight steps for model calibration as illustrated in Figure 3 .
Activated Sludge Models
- ASM1
- ASM2
- ASM2d
- ASM3
ASM1 is the first generation of ASM model's range that involves carbon and nitrogen removal. Death-regeneration is the approach used for the purpose of modeling organism decay with the assumption that part of decayed organisms will be converted into an inert component and the other part will be converted into particulate substrate and then into soluble substrate which can be utilized by active organisms (Water Environment) Federation, 2014). PAHs growth is considered only under aerobic environments and does not include the denitrification of PAHs.
BioWin™ Software
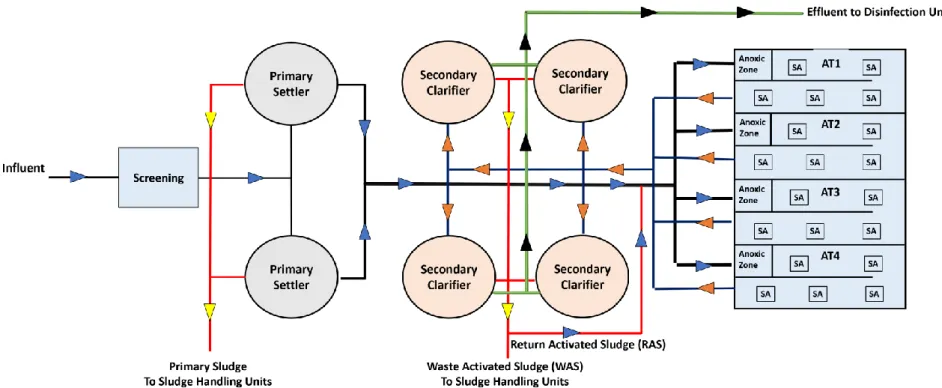
The Solid-Liquid Separation / Clarifier models are considered in the two different parts of the plant throughout the simulation, firstly in the primary sedimentation and secondly in the secondary clarification. There are three different types of clarifier models, which are point separation, ideal separation and flux-based models (EnviroSim Associates Ltd, 2020).
Wastewater Characterization
- Organic Material
- Nitrogenous Material
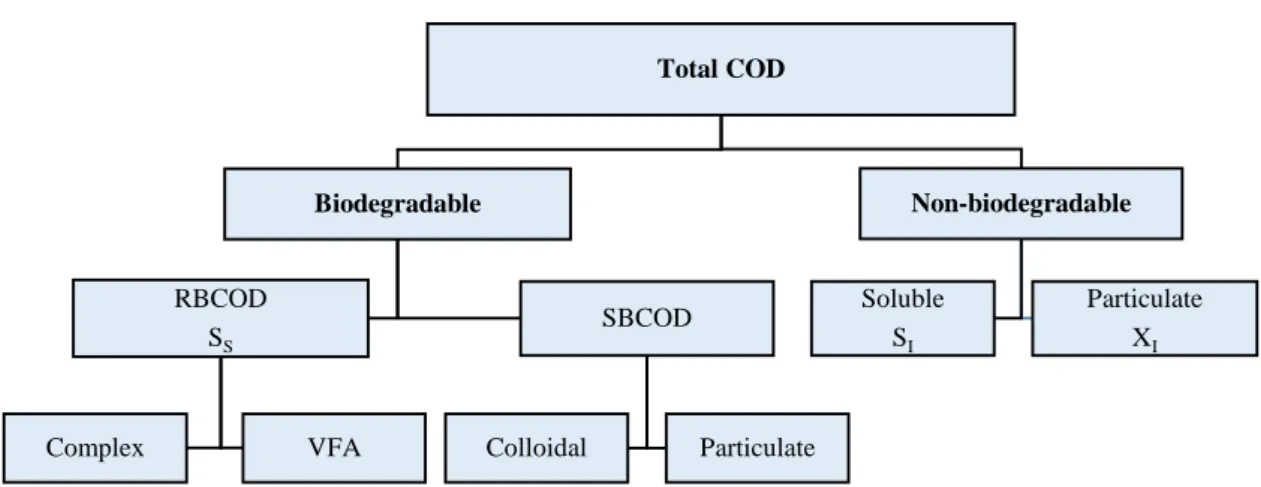
However, these fractions are very small compared to the total COD and they can also be neglected (Roeleveld & van Loosdrecht, 2002). COD is usually used as the key for wastewater characterization in the WWTP modeling approach as it can better determine the strength of the waste stream compared to BOD5. Biodegradable COD is sub-divided into readily biodegradable and slowly biodegradable, while non-biodegradable COD is divided into soluble and particulate matter (Melcer, 2003).
The biodegradable organic material in wastewater consists of easily biodegradable COD (RBCOD) and slowly biodegradable COD (SBCOD). Both forms are readily consumed by microorganisms for energy and synthesis, whereas SBCOD is divided into particulate and colloidal material that requires much more time than RBCOD for utilization. On the other hand, the non-biodegradable material, which is divided into particulate and soluble, will not be affected by the biological process in the system.
Non-biodegradable particles (XI) will accumulate in the sludge, while non-biodegradable solute (SI) leaves the system at a rate equal to the influent concentration.
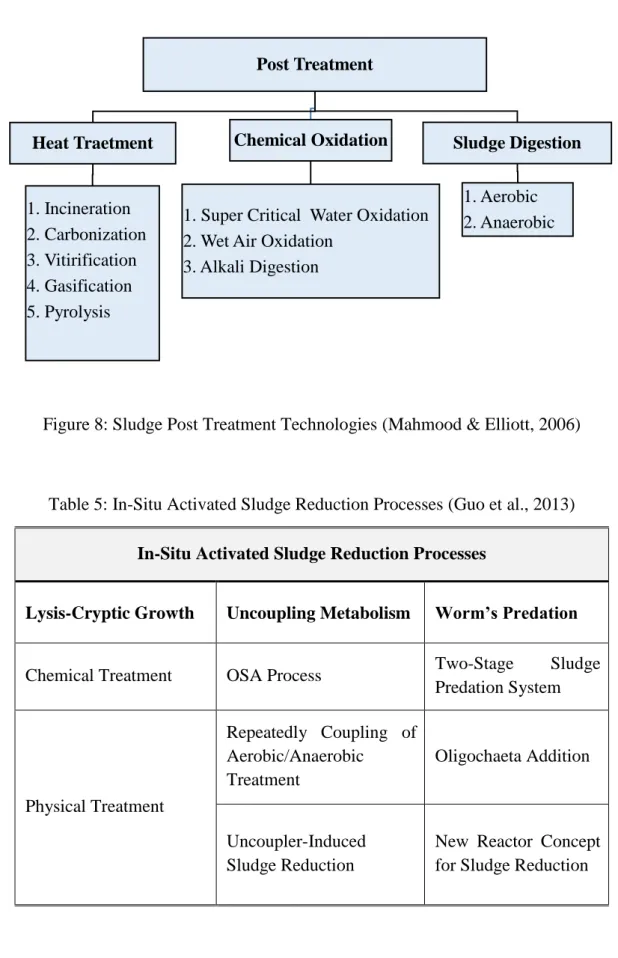
Sludge Reduction Approaches and Technologies
- Lysis-Cryptic Growth Process
- Sludge Reduction by Uncoupling Metabolism
- Sludge Reduction by Worms' Predation
Huysmans et al., 2001) studied the ozone as the oxidant for the series batch reactor process and 50% reduction in the sludge yield was achieved. Lee et al., 2005) investigated conventional activated sludge process with ozonation process and results showed no sludge production. Other oxidant such as chlorination (Cl2) was investigated by (Saby et al., 2002) and 65% sludge reduction was reported.
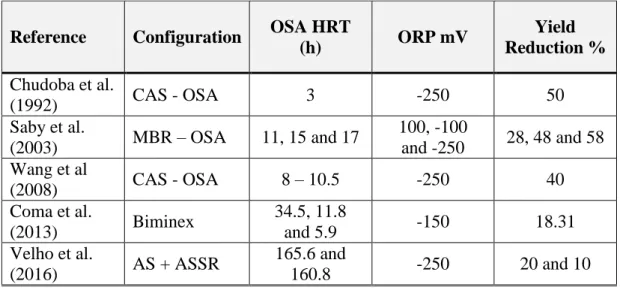
A disadvantage of chemical oxidants used for sludge reduction is that the reflux could destroy the bioactivity in the aerobic reactor (Guo et al., 2013). The reactions of catabolism and anabolism are linked due to the transfer of energy generated under normal conditions (Aragón et al., 2009). Sludge reduction in the OSA process can be illustrated by sludge breakdown where a low oxidation-reduction potential (ORP) occurs (Saby et al., 2003).
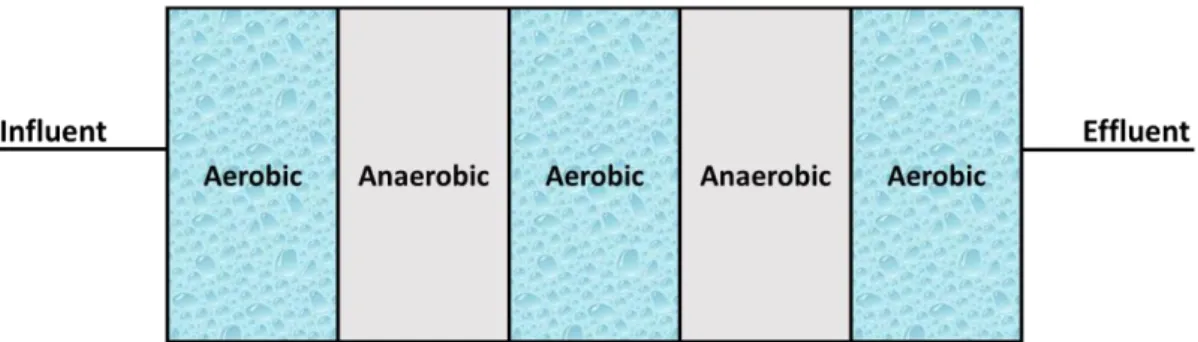
In addition, short retention time can decouple microbial metabolism and reduce solids accumulated in the tank (Ye et al., 2008). Although most of the studies have shown a reduction in produced sludge mass, the OSA process mechanism remains unclear (Datta et al., 2009). Repeated coupling of aerobic and anaerobic process can achieve 30-50% reduction in the produced sludge compared to the CAS process (Xing et al., 2008).
Therefore, the development of activated sludge mathematical models and computer software will contribute to a better understanding of the fate of organic matter (Guo et al., 2013).
Oxic- Settling- Anaerobic (OSA) Process
2014) concluded that the acceleration of sludge decay in SHT under low ORP value could be the main contributing factor to explain the sludge reduction in the OSA process. ORP is a measure of the presence of oxidizing agents in the reactor, which determines the environmental condition, whether it is aerobic, anoxic or anaerobic. There is no universal ORP value for the reactor condition, but it was reported that more than 50 mV is associated with aerobic conditions, between 50 and -150 mV is anoxic condition, whereas below -150 mV is considered anaerobic (Semblante et al., 2014).
The ORP is inversely proportional to HRT as oxidizing agents will be consumed over time to oxidize organic matter. According to previous studies, maintaining a low ORP value in the OSA process will improve the reduction of produced sludge and -250 mV ORP value was recommended to be maintained in the SHT (Semblante et al., 2014). Another study reported a value of 0.13 day-1 for the sludge endogenous decay coefficient in the SHT (An & Chen, 2008).
According to Tchobanoglous et al. 2014), the anaerobic endogenous decay coefficient typically ranges from 0.02 to 0.04 per day-1, which is much lower than the values achieved in the reviewed studies. Thus, this increase in the sludge decay coefficient has often been considered to be the main contributor to the effectiveness of OSA in reducing sludge (An & Chen, 2008).
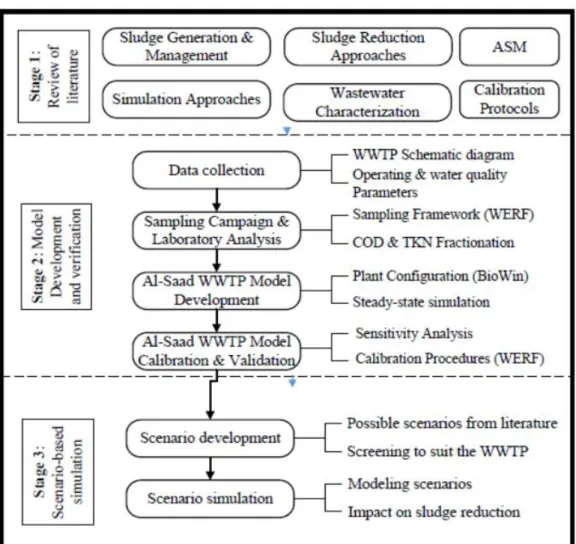
Methodology
- State-of-the-Art Review Literature
- Data Acquisitions
- Sampling Campaign and Laboratory Analysis
- COD Fractions Calculations
- TKN Fractions Calculations
- Al-Saad WWTP Model Development
- Sensitivity Analysis
- Al-Saad WWTP Model Calibration and Validation
- Scenarios Development for Sludge Reduction
The soluble non-biodegradable (SI) COD concentration was determined directly as the concentration of filtered effluent COD as illustrated in Equation 2. It was assumed that there was no generation of soluble non-biodegradable COD within the system (Melcer, 2003). To determine the particulate non-biodegradable COD (Fxi) portion, simulation by trial and error was used until the simulated MLSS in the aeration tank matched the measured value.
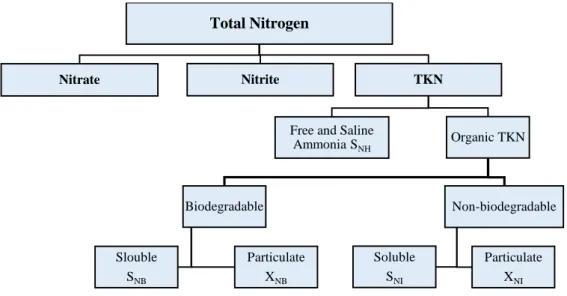
Model application reported that the residual soluble concentration of biodegradable organic nitrogen in the wastewater stream is typically approx. 0.4 mg N/L. Based on that, soluble non-biodegradable organic nitrogen (SNI) could be calculated by subtracting the residual concentration of biodegradable organic nitrogen (0.4 mg N/L) and the fraction of free and saline ammonia (SNH) from the filtered wastewater TKN . However, this method proved to be unsatisfactory as it is difficult to distinguish between soluble biodegradable and non-biodegradable TKN, and usually the soluble non-biodegradable (SNI) constitutes a small part of less than 3% of the total TKN.
Since non-biodegradable particulate organic nitrogen (NNO) will accumulate in the sludge, it is usually assumed that the non-biodegradable particulate nitrogen content of the COD flux is the same as the TKN mixed liquid solids. The raw effluent is passed through a 1.2 micrometer GF filter to retain biodegradable and non-biodegradable TKN. Furthermore, non-biodegradable particulate organic nitrogen is 10% of total TKN, so this percentage was used instead of equation 8 (Melcer, 2003).
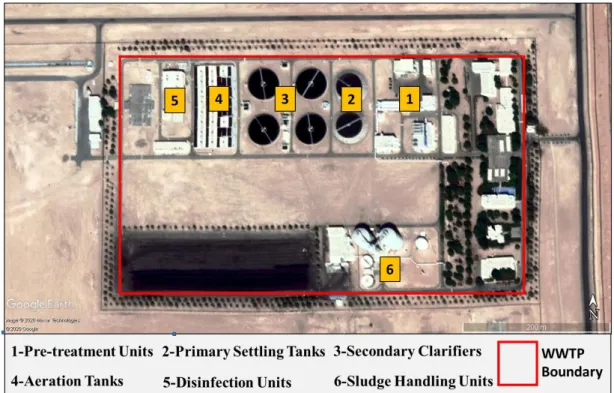
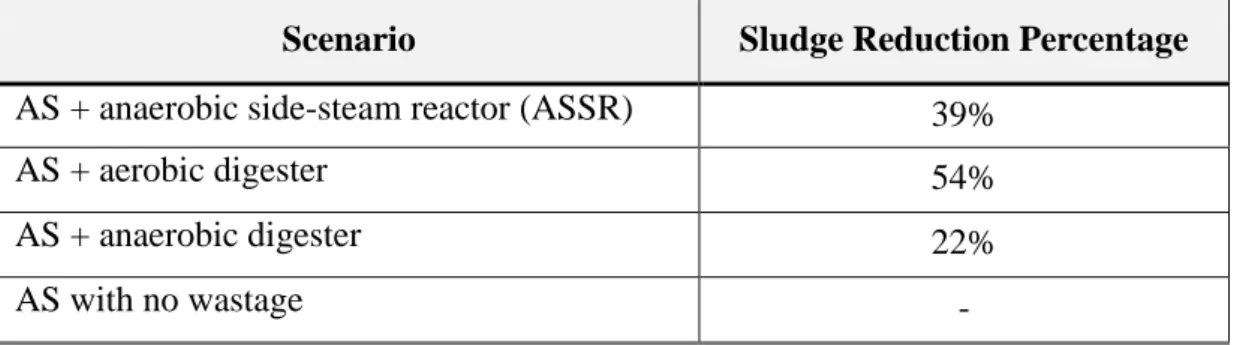
The scenarios were developed under the constraint that the SHT footprint can be adapted to the available area within the Al Saad NPP (10,560 m2).
Results and Discussion
- Al-Saad WWTP Performance Analysis
- Results of Water Quality Sampling Campaign
- Results of Sensitivity Analysis
- Al Saad WWTP Model Development and Calibration
- Results of Model’s Validation
- Results of OSA Retrofit Scenarios
Additional data for other parameters measured at various locations in the plant are presented in Appendix C. The parameters in the BioWin™ software were adjusted from their default values based on the fractions and ratios calculated from the influent sampling results. First, the COD inert particle fraction was assumed on a trial basis until a good match between produced sludge and MLSS in the aeration tank occurred.
After applying the calibration procedures in the software, most of the significant differences between the measured and simulated were resolved as shown in Table 22. The only parameter that slightly exceeds the limitation of Melcer, (2003) guidelines is the produced sludge and TSS in the WAS stream. Pre-determined kinetics and stoichiometric parameters used for calibration were used in the second run for validation and the results are illustrated Table 23.
There was a significant difference between the impact characteristics in the two different periods for all parameters. For example, COD in summer (first period) was 559 mg/L, while in winter (second period) it was 835 mg/L. Since particulates accumulate in the system for the SRT duration and therefore affect sludge production, it is possible that the reason for this mismatch is the assumption of particulate non-biodegradable COD, which.
Regarding the impact of the OSA process on other water quality parameters (COD, BOD, etc.) in the effluent, a small decrease in removal efficiency was observed, as shown in Table 24.
Conclusions and Recommendations
The chemical oxygen demand and the mechanism of excess sludge reduction in an oxygen-settling-anaerobic activated sludge process. Possible cause of excess sludge reduction in an oxic settling anaerobic activated sludge process (OSA process). Operational strategies for an activated sludge process in combination with ozone oxidation for zero excess sludge production during the winter season.
Sludge reduction in an activated sludge sewage treatment process by lysis cryptic growth using ClO2 ultrasonication disruption. Effect of low ORP in anoxic sludge zone on excessive sludge production in oxic settling-anoxic activated sludge process. Principles in the design of single sludge activated sludge systems for the biological removal of carbon, nitrogen and phosphorus.
Oxic-settling-anoxic (OSA) process combined with tetrachlorosalicylanilide (TCS) to reduce excess sludge production in the activated sludge system. Effect of sludge retention time in sludge storage tank on excess sludge production in the oxic-deposition-anoxic (OSA) activated sludge process. 98 Figure E8: Sij value for assimilative NO3/NO2 reduction rate on output parameters at different stages.
106 Figure E16: Sij value for endogenous waste COD: VSS ratio in output parameters at different stages. 107 Figure E17: Sij value for particulate substrate COD: VSS ratio in output parameters at different stages. 108 Figure E18: Sij value for particulate inert COD: VSS ratio in output parameters at different stages.