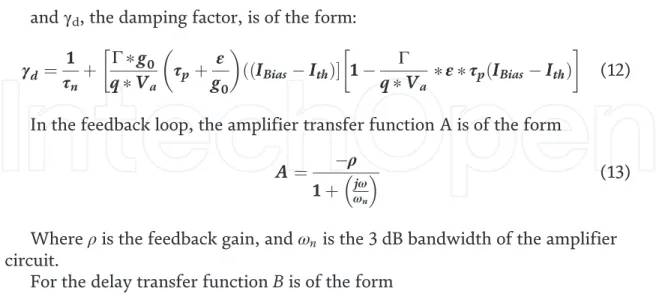
The system is configured to account for the delay, gain and bandwidth of the feedback loop and is expressed in the following forms:. The inverse of the frequency peak corresponds to the pulse interval in the time domain.
Pulsed-source noise analysis
For a pulse source with a pulse interval of 80 ps, the maximum tolerated rms jitter for the sample application is 120th of the pulse interval according to [19]. The listed requirements for maximum tolerated rms jitter are 667 fs while our calculated jitter shown in Figure 11 is around 15 fs.
Conclusion
We also analyzed how certain presented physical laser design parameters can further improve the performance of this self-pulsing laser structure with feedback for neuromorphic application. This chapter is distributed under the terms of the Creative Commons Attribution License (http://creativecommons.org/licenses/.by/3.0), which permits unrestricted use, distribution, and reproduction in any medium, provided the original work is properly cited.
TOP 1%
Introduction
The interaction causes a variation in the electrical, optical or mechanical properties of the transducers, and the degree of variation is reflected in the amount of analytes [2]. This is reflected in the rapid advancement of biosensors, which is associated with the market growth application and is valued at USD 21.18 billion.
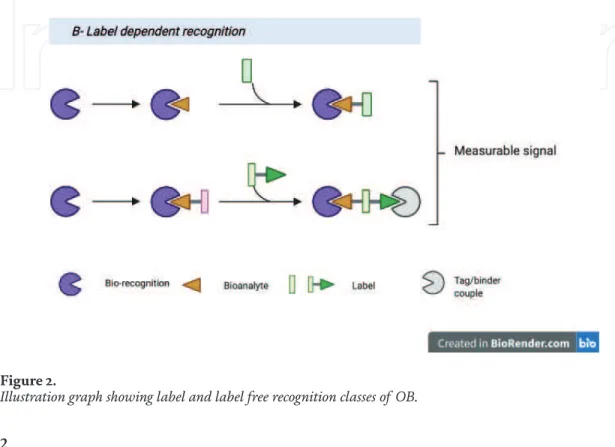
OB classification
In label-free class, the measured signal is produced directly by the interaction between the transducer and the bioanalyte. While in label-based sensors, a label is needed to produce signal, which can be measured later by a colorimetric, luminescent or fluorescent method, as illustrated in Figure 2 [14].
OB detector elements – Bio-recognisers
OB working method
Types of OB
- Evanescent wave fluorescence
- Optical fibers
- Backscattering optical interferometric
- Reflectometric interference spectroscopy (RIfS)
- Surface-enhanced Raman scattering
- Surface plasmon resonance (SPR)
- Liquid sensor based on optical surface plasmon resonance
This change can be associated with the intensity of the reacting biomolecules and is equal to the increase in thickness. In the whole setup, the label-free, direct and real-time refractive index changes are enabled by the SPR phenomenon on the sensor surface, in which it is proportional to the biomolecule concentration as shown in Figure 8 [58].
SPR fabrication
SPR simulations and design
Refractive index (n) and K=kelvin of SU-8 film as a function of wavelength measurements using ellipsometer. the refractive index of the surface plasmon. a) Simulation of SPR sensor head performed by RSoft. One after the other, a set of analyte media with calibrated refractive indices (sample liquids) were deployed over the top of the SPR sensor.
Conclusion
The piezo-optical method provides the highest strain sensitivity compared to sensors based on any other physical principle. Today, the most commonly used method for measuring strain is based on the strain-resistant effect.
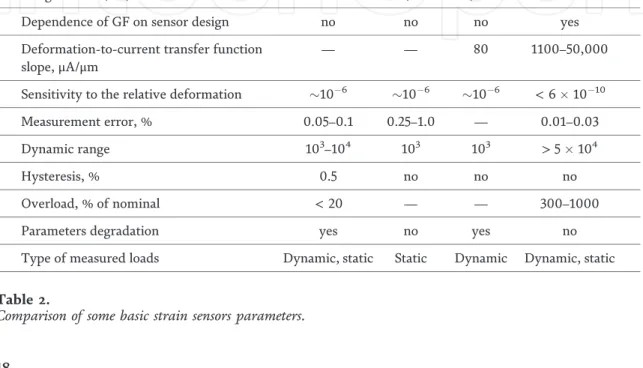
Comparative analysis of the sensitivity of strain gauges based on various physical principles
- Strain-resistive effect and strain gauge sensors
- Fiber-optic strain gauge sensors
- Piezoelectric effect and piezoelectric transducers
- Piezo-optical effect and piezo-optical transducers
Such sensors have a significantly higher sensitivity than strain-resistant ones due to the fundamentally high light polarization sensitivity to changes in the state of the substance in which the light propagates [20]. It can be seen from Eq. 2) that the GF size depends only on the properties of the conductor material (dρ=ρ) and is independent of the strain gauge design. Stretching/compressing the fiber changes the distance Land refractive index, resulting in a change in the Bragg wavelength (λBdλB) which is detected by the optical system.
As with strain-resistant sensors, it does not depend on the design of the sensor and is determined by the properties of the fiber optic material.
Piezo-optical transducer of new design
The phase difference∆between two orthogonal components of the beam polarization caused by voltages in the PE working area leads to the change in the intensities of the light beams (Φ1,Φ2 in Figure 3 left) incident on the photodetectors. We have optimized the PE shape and shown that the cruciform PE allows us to significantly increase the stress magnitude in the PE working region for a given applied force [32]. Thus, the PE working area falls into the PE part where the stresses are minimal.
For the PE shape shown in Figure 4a (bottom right), the increase in stresses averaged over the PE working area was 2.1 times higher compared to the square and circular shapes (dependence (1) in Figure 4b).
Piezo-optical transducer model for numerical simulation
- Simulation of the light propagation
- Transducer output signal
- Simulations of stresses and deformations in the photoelastic element We used the COMSOL Multiphysics ™ package and the finite-element method
The elements are arranged perpendicular to the incident light rays, and the rays are parallel to the Z axis. θ is the fast axis angle measured from the X axis to the Y axis (Figure 3). δ¼δy δxi is the phase difference between the fast and slow axis (lag). The obtained results enable the determination of tolerances for the inaccuracy of the installation of optical elements. Here, for simplicity, the light rays were treated as plane wave rays incident perpendicularly on the surface of each element of the optical layout.
The embedded in COMSOL Multiphysics parameters of the material required for the calculation of the deformation were used.
Simulation and experimental results and analysis
- Minimum detectable force
- Photoelastic element deformations
- Piezo-optical transducer gauge factor
- Gauge factor dependence on photoelastic element shape
- Piezo-optical transducer parameters
The diamond design ensured that the force was applied to the PE in the direction perpendicular to the optical axis of the piezo-optical transducer (Figure 6b). The random noise ∆Iout of the output current Ioutis analyzed to calculate the minimum sensor sensitivity for the applied power (noise equivalent power). This is due to the selected PE design, which determines the magnitude of the stresses (σy σx) in the PE working area for a given applied force value, and the.
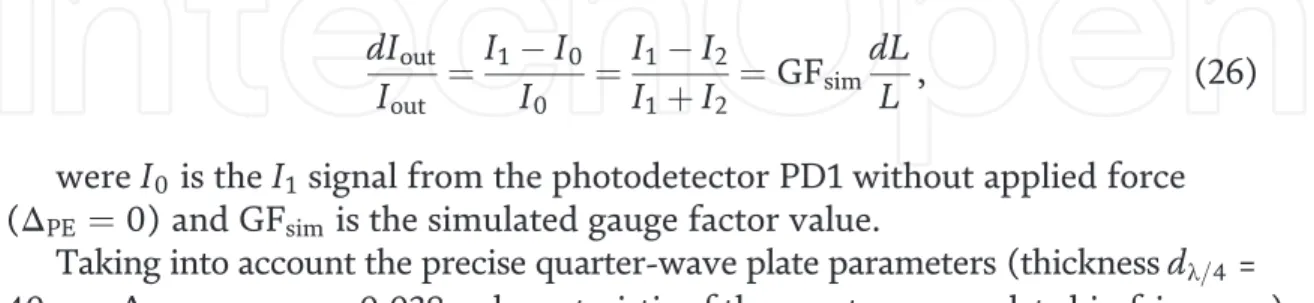
Experimental calibration factor. The direct measurement of the photocurrents (IPD1, IPD2) from the photodetectors (PD1, PD2 in Figure 2) yielded the experimental calibration factor GFexp value.
Testing the piezo-optical transducer
This is due to the fact that as PE stiffness increases (effective Young's modulus E∗) decreases in the direction of force application, which in turn leads to an increase in the relative deformation dL/Width of the given force and a decrease in GF. Dynamic range. In our transducer design, as mentioned above, the PE is attached to the load element in the initial tensioned state that provides the. The maximum change in the output signal I range equal to 8 mA, then the dynamic range will be DR.
The upper part of Figure 10 corresponds to the presented piezo-optical transducer and the lower part – to the Load Cell Interface Force™.
Discussion
In our sensor we have used as simple a design as possible, because the sensor is designed for a wide range of consumers. The sensor can be used wherever winch mechanisms are used, for example in mines, escalators, moving walks, conveyor belts, cranes, etc. Due to its high sensitivity, the sensor can be used for remote monitoring of deformations by mounting at a certain distance from the measured deformation zone: in bridge structures, cars and railway carriages, remote weight control, liquid and gas flow control.
Conclusions
- Interferometric based vibration sensors
- Intensity modulated vibration sensors
- Microbending vibration sensor
- Non-contact vibration sensors
The disadvantages of the optical fiber vibration sensors are the narrow frequency range for measurement and unfamiliarity for the end user. Whereas the transfer function of an MMF interferometer is independent of time due to the multiple number of modes of the optical light in the optical fiber. Microbend optical fiber sensor is one of the earliest reported sensors which works on the principle of intensity modulated.
Most non-contact dynamic displacement sensors can usually be used for vibration sensing.
Dual optical fibers
- Theory
- Experimental setup
For a given photodetector, the values ƞ(<1) and ga are constant, so the response (sensitivity) depends on the wavelength of the light source. A schematic of the experimental setup of the fiber optic vibration sensor is shown in Figure 5. A commercial speaker/PZT can be used as a vibrator to test the FOS response.
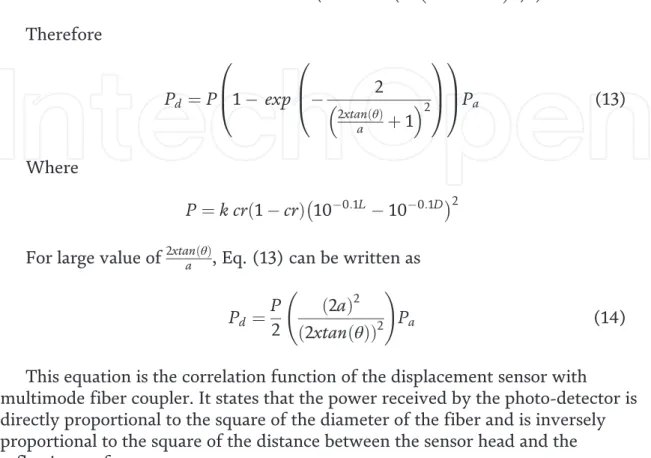
Moreover, the dark area of the sensor can be minimized by choosing the fiber diameter as small as possible.
Fiber optic fused 1x2 coupler
- Theory
- Experiment
Calibration of the vibration amplitude sensor was performed. The distance between the speaker and the sensor head is determined within the linear region of the displacement curve shown in Figure 8. The light from the LED is connected to port 2 of the coupler and directed to port 1.
It is clear from the figure that there is a perfect match between the applied signal and response of the sensor.
Fiber optic fused 2x2 coupler
- Displacement response of the sensor
- Elimination of source and bending fluctuations
- Vibration measurement setup
- Results and discussion
The test results show that the RO method reduces the effect of source fluctuations on the sensor response. A schematic experimental setup of a 2x2 fiber optic coupler for vibration measurement is shown in Figure 13. This figure also shows that the output of the vibration sensor at a given frequency is the amplitude.
The amplitude response of the vibration sensor for the applied drive voltage on the vibrator and the FFT peak voltage from the output signal to for different frequencies is observed to be linear in response.
Summary
Vallan,"A Fiber Optic Sensor for Displacement and Acceleration Measurements in Vibration Tests,"in IEEE, I2MTC 2009 - International Instrumentation and Measurement Technology Conference Singapore, May No. Investigation of Light Source Effect on Fiber Optic Fused 1x2 Coupler Vibration Sensor", Journal of Optoelectronics And Advanced Materials, Vol. Vengal Rao and K.Srimannarayana, "Remote Vibration Sensor Using Fiber Optic Fused 2x2 Coupler", Proceed from SPIE.
The application of MOFs in the electronics industry was first reported by Allendorf and co-workers [16].
Chemistry of MOFs
- Dimensional classification and evolution of MOFs
- Reticular chemistry and isoreticular MOFs
- Synthetic advancements of MOFs
This major advancement in coordination polymer showed that coordinated networks of MOFs could be modified and developed in a highly periodic manner, with a defined understanding of the crystalline structure, porosity and chemical functionality. Some advantages of this approach are: (1) Molecular approach, which offers the possibility to design and control the structure of frameworks [17]; (2) Adhesion where the strong bonding between the building blocks could give superior functionalities such as thermal and chemical stability to the framework; and (3) Engineered crystallinity, which is based on the type of interactions (intermolecular or intramolecular) design and synthesis with controlled and desired properties. Of such factors, by far the most important is the preservation of the integrity of the building blocks.
Some of the external parameters applied to MOF development include the use of microwave energy (microwave synthesis), [25] ultrasonic waves (sonochemical synthesis), mechanical energy (mechanical-chemical synthesis) and electrical energy (electrochemical synthesis).
- Road map to electrically conductive MOFs
A long range of charge transport in this pathway is facilitated through bonds. This mechanism is promoted by interaction between ligand π
In this pathway, the charge transport is facilitated through space via π stacked aromatic ligands which was proposed as an alternative to through
The other alternative strategy to increase the conductivity of MOFs is via incorporating an appropriate guest molecule within the MOF. These mol-
- Synthesis and optoelectronic properties of IRMOF-1
- Synthesis and optoelectronic properties of IRMOF-8
- Synthesis and optoelectronic properties of IRMOF-10
- Future prospective
- Conclusions
This further rules out emissions originating from ZnO quantum dots such as Zn4O clusters. The optical gap calculated from the UV-visible spectrum on the set is 3.97 eV. Falcaro P, Allendorf M, Ameloot R (2017) An updated blueprint for the integration of metal-organic frameworks with electronic devices and chemical sensors. Charge transfer processes on MOF-5 nanoparticles: elucidating the differences between metal-organic frameworks and semiconducting metal oxides.
98] Odoh SO, Cramer CJ, Truhlar DG, Gagliardi L (2015) Quantum chemical characterization of the properties and reactivities of metal-organic frameworks.