Questions regarding the use of the book should be directed to the Rights and Permissions Department of INTECHOPEN LIMITED ([email protected]). The first chapter deals with metal oxide gas sensors such as ZnO and multiwall carbon nanotubes and their composites.
Introduction
The latest change in OSHA's time weighted average (TWA) permissible exposure limit (PEL) is 25, 35 and 1 ppm for NH3, CO and NO2 gases respectively [4]. Oxidizing or reducing gas is associated with electron affinity, which is compared to the work function of most metal oxides, so in the case of oxidizing gas, the adsorbed gas molecules on the surface of MO are anions.
Metal oxide (MO) gas sensors
Thin film metal oxide gas sensors
The development of gas sensors, which account for almost 21% of metal oxides used in this field, is growing rapidly [17]. Thin-film metal oxides are used to detect many types of gases, such as
Doping
In our previous study, the Al source effect was investigated on the NH3 gas sensing and response time parameters as shown in Figures 5-7 [34]. As shown in Figures 5 and 6, nanorod formations (Figure 5b) had the highest response times and gas sensing at low temperatures in powder Al source used samples.
MO/CNT nanocomposites
Spraying nanoclusters of the right type of atoms on the surface ensures the catalysis process, increasing the gas sensitivity with the functionalization of CNTs [59]. Consequently, it was determined that the gas sensing performance of ZnO sensors decorated with MWCNTs was enhanced by the surface reactions with the ZnO network.
Conclusion
Gas sensors are widely used in various industrial applications for the evaluation of key elements within the gas mixture. Previous studies [8-16] clearly showed that the Knudsen force is highly proportional to the main characteristics of the gas within the field.
Numerical approach 1 Governing equations
Numerical procedure
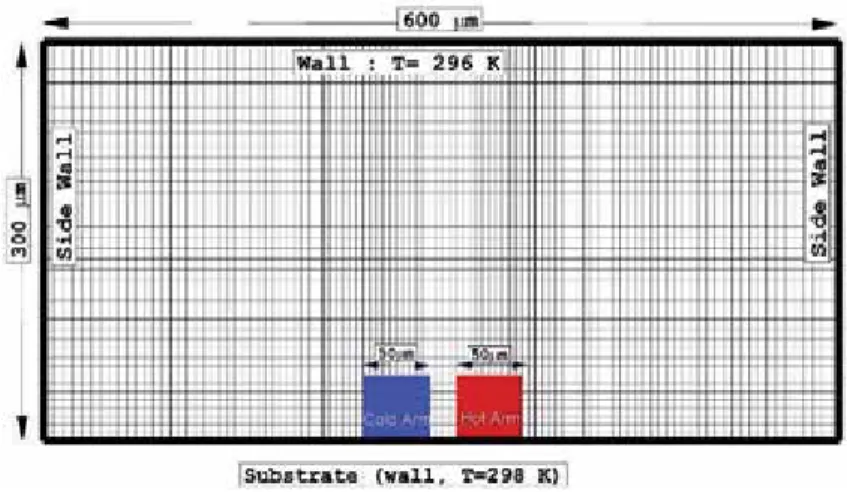
Geometry and boundary condition
Results and discussion 1 Verification
Analysis of flow structure
In this research, two types of temperature conditions (real and constant temperature) are applied to the cold and hot arm. To validate our results, the temperature variation of the cold and warm arm obtained from the experimental data of Strongrich et al.
Effect of the temperature difference
It is important to note that the temperature diffusion is enhanced when the pressure in the domain increases. The figure shows that the temperature gradient is intensive at the edges of the hot arm.
Effect of gap size
Our findings show that increasing the gap size decreases the value of the exerted Knudsen force on the model. The variation of the Knudsen force on cold arm provides significant comment on the value of the Knudsen number.
Conclusions
Lattice structure of TiO 2
The electrical properties of these oxides are sensitive to the partial pressure of oxygen because it changes with the concentration of electrons or electron holes in the oxides. These minerals are the real raw materials used in generating titanium dioxide pigment. Therefore, metal oxide nanomaterials play a vital role in the recent development of science due to its small size and large surface area [4].
The role of water vapor has been studied in the environment with respect to human life.
Properties of TiO 2
Both sizes of anatase and rutile particles increased with increasing temperature, but the growth rate was different. The rutile particles, after nucleation, grew rapidly, where the size of the anatase particles remained practically unchanged with the decrease of the initial particle size, the temperature of the onset of the reduced transition [6]. The reduced warm steadiness in better nanoparticles was fundamentally due to the reduced engagement vitality as a size-related surface enthalpy and stress vitality expanded.
Synthesis methods of nanomaterials
This reaction can be very useful in breaking down organic matter, impurities and bacteria in the air. Normally, the temperature in the hydrothermal process falls between the boiling point of water and the critical temperature (Tc = 374°C), while the pressure is higher than 100 kPa. First, a solution of the appropriate precursors (metal salts of organic metal compounds) is formed, followed by conversion to homogeneous oxide (gel) after hydrolysis and condensation [8].
This is based on the gelation and subsequent combustion of an aqueous solution containing salts of the desired metals and some organic fuels, giving a bulky and airy product with a large surface area.
Introduction to gas sensor .1 Gas sensor technology
The large surface-to-volume ratio of nanomaterials can be used as an advantage for the development of the gas sensor. The third modification that can be made to the sensor material is the modification of the space charge layer. This is done to obtain the maximum signal change in the presence of the target gas.
Altering the space charge layer can be accomplished by: (1) reducing the crystallite size, (2) changing the defect chemistry in the space charge layer and on the surface of the material, and (3) changes in the space charge layer.
Sensor parameters
The gas sensors based on the field effect transistors depend on the change in the work function of the metal gate with the interaction of the target gas. A maximum in the response (Smax) at a certain critical temperature (Topt) is referred to as the operating temperature of the sensor. The gas sensing mechanism of the LPG sensor is a surface-controlled phenomenon, that is, it is based on the surface area of the thin film.
As a consequence, an increase in the resistance of the film was observed before exposure to LPG.
Requirements of a gas sensor
Initially, oxygen from the atmosphere is adsorbed on the surface of the film and absorbs electrons from its conduction band. The receiver function is a capacity of the sensitive surface to receive the target gas, which is directly related to the surface capacity of the adsorbed O −2 ions. The receiver function is a capacity of the sensitive surface to receive the target gas, which is directly related to the surface capacity of the adsorbed O 2 − ions.
The construction of the sensor should be as simple as possible using IC technology and low cost.
Conclusions
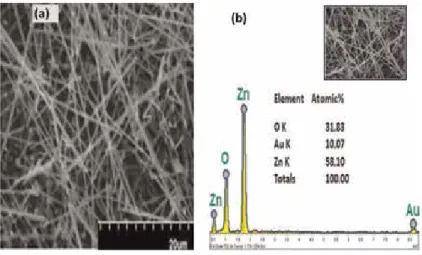
The vapor transport process is one of the most common and cost-effective methods used to synthesize ZnO nanostructures. The vapors of the precursor are transported by carrier gases (usually noble gases are used as the carrier gas) to the substrate placed in the furnace tube during the growth of oxide semiconductor. Figure 7(a) shows the SEM micrograph of the ZnO nanostructures of sample S1, consisting of randomly oriented ZnO nanowires.
EDX analysis confirmed that the compositions of the products are Mg-doped ZnO without impurity.
Synthesis of nanostructured conducting polymers
The molecular structures of some of the prominent CPs include PANI, PPY, poly-paraphenylene (PPP) and PTH, which are shown in Figure 1 (left) in their non-conducting (undoped) states. Furthermore, the signal intensity of the sensor can be improved by controlling the shapes due to the unidirectional signal path of the CP nanostructure. The morphological structure and thickness of the CP films can be tailored by controlling the electrochemical polymerization conditions, applied potential or current density, and electrolyte.
Depending on the pore length and diameter of the membrane template, the size and diameter of CP nanostructures can be precisely controlled because monomers are adsorbed or attached within the pore walls, followed by chemical oxidative polymerization [51].
Gas sensors based on CPs
Electrochemical device sensors
In either case, the peak current, as the voltage is scanned, is proportional to the concentration of the target molecule. Also, the redox response plays a final role in the signal transduction of the amperometric ammonia gas sensor based on PANI nanoparticles [107]. In the electrochemical cell, the potential (E) arises between the two electrodes, defined as the potential difference between the cathodic and anodic potentials, usually proportional to the logarithm of the concentration of the analyzed gas, which can be estimated from the Nernst equation (Eq.
On the other hand, Au-loaded In2O3 or SnO2 effectively enhanced the magnitude of the CO and H2 responses, resulting in relatively poor CO selectivity against H2.
Electrical device sensors
E = E o + RT_nF lnQ (1) where Eo is the standard electrode potential in volts, R is the universal gas constant (8.314472 J K−1 mol−1), T is the absolute temperature in Kelvin, F is Faraday's constant coulombs mol−1, n is the number of electrons participating in the electrochemical reaction, and Q is the chemical activity of the analytes. E = E o + _RTnF lnQ (1) where Eo is the standard electrode potential in volts, R is the universal gas constant (8.314472 J K−1 mol−1), T is the absolute temperature in Kelvin, F is Faraday's constant coulombs mol−1, n is the number of electrons participating in the electrochemical reaction, and Q is the chemical activity of the analytes. Schematic representation of the chemiresistor sensor principle based on chemically sensitive CPs for selective detection of chemical sensing materials.
Schematic illustration of the chemiresistive sensor principle based on chemically sensitive CPs for selective detection of chemical sensing materials.
Optical device sensors
In addition, Mondal and colleagues [163] reported a green chemical pathway synthesis of P3TH/CdSe (QDs) nanocomposites as a chemiresistive CHCl3 gas sensor at concentrations of 100-1200 ppm at room temperature. Upon illumination of the sensor with a monochromatic light of 600 nm, an enhancement of charge transfer in nanocomposites was photoinduced, resulting in an improvement in sensor response and recovery time. In addition, Mondal and colleagues [163] reported a green chemical pathway synthesis of P3TH/CdSe (QDs) nanocomposites as a chemiresistive CHCl3 gas sensor at concentrations of 100-1200 ppm at room temperature.
Upon illumination of the sensor with a monochromatic light of 600 nm, an enhancement of charge transfer in nanocomposites was photoinduced, resulting in an improvement in sensor response and recovery time.
Mass-sensitive device sensors
The designed SAW sensor exhibited improved sensitivity and repeatability of gas molecules at the ppm level at room temperature. The difference in adsorption affinity is attributed to differences in their chemical structure and the strength of electrostatic interactions. Interestingly, the kinetics of PANI adsorption (Eq and chemical vapor diffusion was carefully discussed, in terms of the diffusion coefficient (D) using the second Fick equation (Eq. Hz) are the frequency changes due to vapor absorption in the polymer film, respectively at any time and condition.
Upon exposure to vapor panalite, the frequency of the QCM was changed, due to the dipole/dipole or hydrogen bonding interaction with P3BOT/SA film.
Summary and perspectives
Fabrication of a room temperature ammonia gas sensor based on polyaniline with n-doped graphene quantum dots. Polyaniline/Zinc Oxide Hybrid Film-Based Gas Sensors for Ammonia Detection at Room Temperature. Fabrication of a sensitive gas sensor based on self-layer-by-layer PPy/TiO2 nanocomposite films.
A low humidity sensor based on a quartz crystal microbalance coated with polypyrrole/Ag/TiO2 nanoparticle composite thin films.