Questions regarding the use of the book should be directed to the Rights and Permissions Department of INTECHOPEN LIMITED ([email protected]). He is also a professional member (ProfGradIMMM) of the IOM3 and a fellow member (FIMM) of the Institute of Materials, Malaysia.
Introduction
What is metallurgy?
It is an applied science based on a clear understanding of the structures and properties of metals and their alloys. Microstructure determines the mechanical properties of metals, including their elastic and plastic behavior under force.
Metallurgy forming and processing
The main active ingredients found in nature, especially in the atmosphere, are oxygen and carbon dioxide. For this reason, most of the important ores of these metals occur as various compounds such as oxides, silicates, carbonates and halogens.
Mechanical testing and materials characterizations
The energy required for deformation is generally lower for hot work compared to cold work due to the yield stress decreasing with increasing temperature. For multiple phases of steel, the fraction, morphology, size and distribution of the phase components are determined by the properties.
Steel metallurgy
XRD is an effective technique for measuring the fraction of the present phases, but it cannot access the size, morphology and distribution. The internal structure of steel can be adjusted through composition changes, mechanical deformations or heat treatments.
Powder metallurgy
Among the mechanical properties of a biomaterial, elastic modulus and microhardness are very important, and each varies according to the microstructure and interstitial elements such as oxygen and nitrogen as well as the amount of substitutional element and thermomechanical processing. In addition to the significant interference in the structure and microstructure of titanium alloys, substitutional elements interfere in mechanical properties such as elastic modulus and hardness to the extent that they stabilize phases with different properties [11, 12].
Materials and methods
Ti-Ni alloys
By the decay of the β-transus curve, it is concluded that the addition of nickel favors the stabilization of this phase. EDS mapping of the elements Ti and Ni that make up the Ti-Ni alloys.
Sample’s characterization
To check the homogeneity of the alloys produced, the samples were subjected to a mapping of the elements that make up the alloys using an electron scattering spectrometry (EDS) technique that used an Oxford Instruments model detector coupled to a scanning electron microscope (SEM) model Carl Zeiss EVO/LS15. In all cases, the homogeneous distribution of titanium and nickel elements is observed, indicating that the melting was complete, without the presence of aggregates or separations.
Results and discussion
Structural characterization
The structural characterization of the samples was performed by X-ray diffraction (XRD) measurements on a Rigaku diffractometer (D/Max-2100PC model). It was also observed that the higher the amount of nickel, the greater the amount of intermetallic Ti2Ni was observed in the increased intensity of the peaks and according to the phase diagram of the system [23].
Microstructural characterization
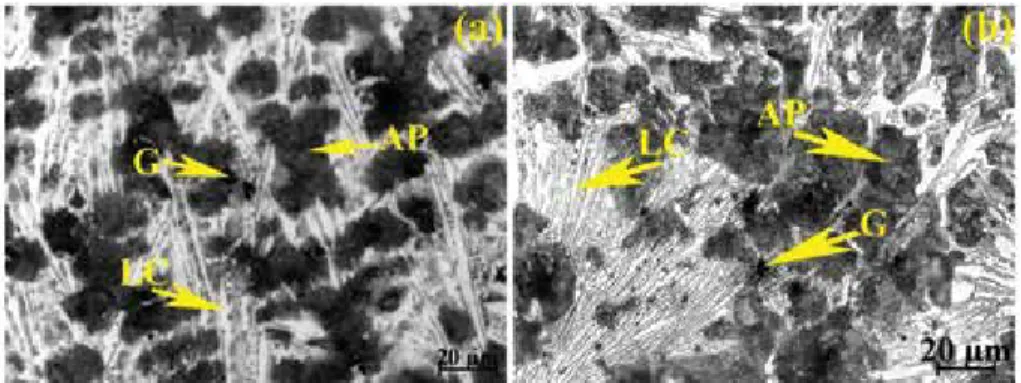
However, the dark regions between the aphase lamellae were clearly a eutectoid microstructure characterized by two phases, alternating between α and Ti2Ni itself. In the SEM micrographs (Figure 5), between the lamellae of the phase, the presence of a eutectoid microstructure characterized by two phases, alternating between α.
Mechanical characterization
According to the phase diagram (Figure 1), the eutectoid reaction occurred at a nickel concentration of 6 wt.%, and thus the alloy exhibited hypereutectoid composition, and the precipitates would be Ti2Ni or Ti4Ni2O, in view of the small amount of nickel. The increase in the concentration of nickel, from the composition of about 6 wt.%, does not act as aβ-phase stabilizer, but causes an increase in the temperature of the formation of intermetallic phase Ti2Ni.
Summary
Influence of the substituting solute on the mechanical properties of Ti-Nb binary alloys for biomedical use. This chapter reviews the effect of alloying elements on the phase transitions and the improvement of the mechanical properties of this alloy.
Shape memory characteristics 1 Shape memory effect property
Pseudoelasticity property
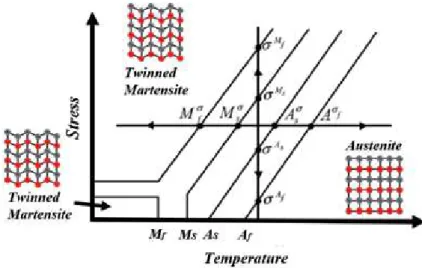
The shape memory effect will occur with the deformation of the SMA in the martensitic phase during loading and unloading at temperatures below Mf. The martensite phase is in the same state of split structure without any recovered inelastic deformations even after the unloaded process (3 → 4).
Cu-based SMAs
Phase diagram of Cu-Al-Ni SMAs
The properties of Cu-Al-Ni and Cu-Zn-Al SMA are listed in Table 1. When the Cu-Al-Ni SMA possesses an Al content of more than 11 wt.%, the body-centered cubic structure transforms into a DO3-type superlattice by transferring β to the β1-order phase before the martensitic transformation.
Phase transformation morphology
From another point of view, increasing the percentages of Ni in the ternary alloy of Cu-Al-Ni SMAs would be a consequence of the high brittleness associated with the shift of the eutectoid point to higher values. Therefore, optimization of the chemical composition of the Al and Ni in the range of 14 and 3.5-4 wt.%, respectively [1].
Effects of alloying elements on the
Martensitic transformation temperature of Cu-Al-Ni SMA
In addition, the high temperatures in the β phase for the Cu-Al-Ni alloys have a disordered bcc structure similar to the Cu-Zn-Al alloys [37]. To reduce embrittlement, one of the main defects of Cu-Al-Ni SMAs, Itsumi et al.
Martensitic structure of Cu-Al-Ni SMAs
Transformation temperature of Cu-Al-Ni SMAs modified with different percentage of Sn [60]; the magnified peaks of (a,b) forward transformation and (c) reverse transformation. 59], where they have agreed that the addition of Ti to Cu-Al-Ni caused a smaller and elongated grain.
Mechanical properties of Cu-Al-Ni SMA
Morris [72] found that adding boron to Cu-Al-Ni SMAs increased ductility. Other elements also showed a significant influence on the mechanical properties of Cu-Al-Ni SMA during addition.
Brief applicability of Cu-based SMAs
Strain recovery from shape memory effect (εSME) of Cu-Al-Ni SMAs with and without Ti additions was studied by Saud et al. These improvements in strain recovery references were attributed to the existence of the X phase that was brought about by Ti additions to the parent phase.
Summary
Dependence of martensitic transformation characteristics on concentration in Cu-Al-Ni shape memory alloys. Crystal structure of the X-phase in grain-refined Cu-Al-Ni-Ti shape-memory alloys.
Experimental 1 Stable suspension
Electrophoretic deposition
EPD consists of two steps; the first step involves preparing a stable suspension of the material to be deposited and moving the particle towards the oppositely charged electrode, and the second step involves depositing the particles on the surface of the substrate to form a film. Compared to other advanced forming techniques, EPD offers easy control over the thickness and morphology of the deposited film by simply adjusting the deposition time and the applied potential [5].
XRD analysis
-Beam diffraction technique was used for the phase analysis of the films and the microstructures were characterized using a scanning electron microscope (SEM). XRD patterns of KNNT powder, green and sintered KNNT thick films are shown in Figure 2a and the XRD patterns of SPVD obtained MgTiO3 Figure 1. a) Schematic representation of customized EPD cell (b) optical micrograph of MgTiO3 thick film [17], and (c) KNNT thick film.
Charging mechanism and deposition
However, in the case of Mg2TiO4, a phase change between SPVD nanopowders and sintered films was observed. An apparent decrease in peak width between nanopowders and sintered films, as was also observed for Mg2TiO4 samples, indicating an increase in crystallite size of sintered films [19].
Effect of EPD voltage and time on the deposition weight
In addition, the XRD patterns were compared to crystallographic data on synthetic geikilite crystalline phase and the peaks were indexed to a rhombohedral unit cell with a = b nm and c nm [17]. In addition, the XRD patterns were compared to crystallographic data on synthetic geikilite crystalline phase and the peaks were indexed to a rhombohedral unit cell with a = b nm and c nm [17].
SEM analysis
The surface morphology was very rough and the films tend to separate from the substrate due to the low adhesion between the film and the Pt substrate. Since we obtained films with good surface morphology at 100 V, this film was used for further studies.
Dielectric constant (ε r )
While a porous microstructure with an average grain size of 60-70 nm was observed in thick MgTiO3 films sintered at 800°C (Figure 5d). SEM images (a) surface morphology of the sintered KNNT thick film (b) SEM showing the thickness of the sintered KNNT film at 1000°C.
Conclusions
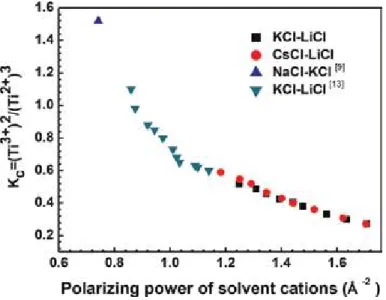
The complexes will be discussed to clarify the influence of electrolytic compositions on kinetic mechanisms of the electrolysis process and the properties of the molten salt. The complexes are discussed to clarify the influence of electrolytic compositions on kinetic mechanisms of the electrolysis process and the properties of the molten salt.
Experimental methods
- Electrochemical analysis
- Concentration determination
- Electrochemical titration technique
- Influence of electrolyte cation on ionic equilibrium of titanium
- Influence of electrolyte anion on ionic equilibrium of titanium .1 Effect of fluoride ion on the state of titanium ions in molten salt
- Influence of oxygen ions on ionic equilibrium of titanium .1 The formation of TiOCl in molten salt
- Electro-refining of high-purity titanium in molten salt .1 Anodic polarization behavior in different molten salt structures
Thus, the titanium ions were transferred into the molten salt, and it is present in reaction (5). Sekimoto [21] and other studies have shown that this is due to the coordination reaction (12) between Ti3+ and O2� in the molten salt.
Conclusions
Specifically, the type of molten salt microstructure is dissected into the molten salt mainly composed of chloride. The influence of fluoride anion on the equilibrium between titanium ions and electrodeposition of titanium in molten fluoride chloride salt.
Gradual difference in the solvent brings about gradual difference in the product
Correlation between the solvent and the product is often very simple The correlation between the solvent and the product is perhaps the easiest to
References in literature to which the entries correspond are indicated next to the entries in the table. This section will lead you to the exploration looking for new meaningful correlations in the sea of ionothermally prepared materials as the size of the solvent.
Ionic liquids function both as a solvent and template
Many reported syntheses are yet to fit into an organised system
As some readers may have noticed, here is a good point to introduce another interesting aspect of ionothermal synthesis; ionic liquids function not only as solvents but also as a template that physically exerts a pressure to determine the final topology by residing in the framework [11] (Table 3). While many valuable efforts are being made to contribute, those with 1,3,5-benzenetricarboxylic acid (BTC) and 1,4-benzenedicarboxylic acid (BDC) have done their part particularly extensively and the reported structures are organized in Tables 4 and 5.
The correlation between the reaction solvent and the product
Trends to predict future outcomes
The maximum length of the cation that fits in the A-class topology is limited, but that is not the case in the B-class topology. Diagrams showing the pores of (a) the A-class topology and (b) the B-class topology in the Ni-BTC system.
The effect of the final framework on the solvent properties
The simplest way to predict the outcome is to analyze the B-class topology cavity and test whether it is capable of accommodating elongated cations [HMI]. PXRD data presented in pairs or triplets to illustrate the similarities and differences of the topologies occurring in the Ni-BTC system. a) Structures synthesized from [PEMI]Cl, [PEMI]Br and [PEMI]I show that all three in the [PEMI] series belong to the same topological group.
Reducing topologies can easily deliver deep insights into the structures
Metals atoms tend to exist in clusters
While the rigidity of the framework can also be seen as favored over other possible outcomes, it is interesting that this rare topology is so strongly preferred in the system and only in the cobalt system. This further supports the absence of any other possible stable framework in the cobalt system.
Structure explains the popularity of [RMI][metal(BTC)] topology Some of the most commonly occurring structures need attention, not only
The topology [RMI][Metal(BTC)] occurs in the most metal systems reported and in the highest frequency. There are eight BTC ligands, and the rest of the interstitial sites appear empty in Figure 6.
Seemingly different structures may belong to the same topology class A large number of syntheses have been reported to the literature, but the num-
However, the structure may not accommodate longer cations, no matter how preferred it is over other possible options; it is simply impossible. This is consistent with the observation from Table 5 that the structure is strongly preferred with [EMI], but only with [EMI].
Outstanding properties of ionothermally prepared MOFs
Ion exchange is the key to make use of the pores
The void volume of structures synthesized with cations of different sizes was compared in Tables 4, 5 and 7. Frameworks with solvent in their channels or cavities typically have a compact structure with a void volume of only 0% of the unit cell volume.
Placing metal atoms in proximity to yield novel characteristics
Many of the most commonly studied applications of MOFs make use of the frameworks as molecular sieves. To make any use of the pores, the templates occupying the pores must be removed.
Conclusion
Preparation of the adsorbent
Adsorption test
Water from the bath of the dead flush is recycled in the bath of metal precipitation. A mass of the adsorbent is placed in contact with the reject to be treated (100 ml).
Characterization and treatment of global rejection by adsorption on raw chitin
Physical-chemical quality of wastewater to be treated .1 Physical-chemical quality
This characterization shows that the unit effluent can be considered relatively stable if we eliminate the variations dictated by the drainage. The results of the analysis of heavy metals in the wastewater are illustrated by Figure 2.
Treatment test for global rejection
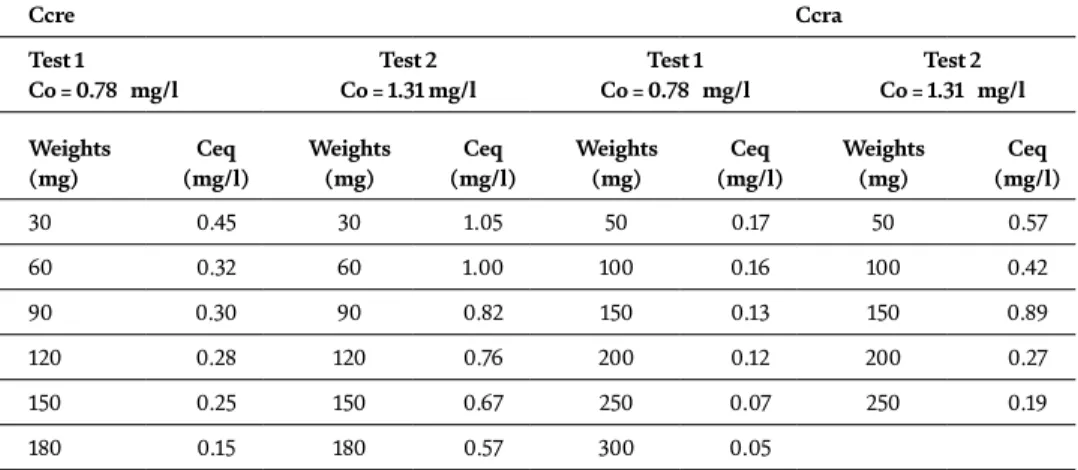
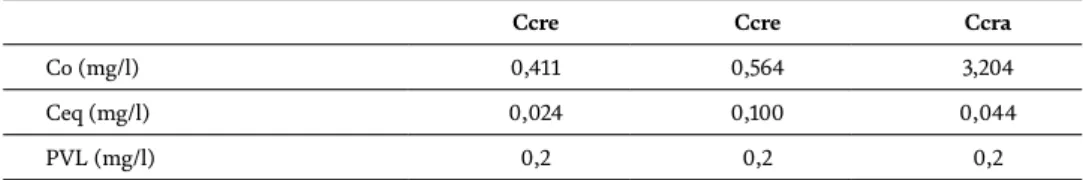
The optimal dose of the material is chosen according to the quality desired by the water agreement. Cr: The results of the dosage of chromium before and after adsorption are included in Table 4 below.
Characterization and treatment of current rinsing by adsorption on raw chitin
Physical-chemical characterization .1 Physical-chemical
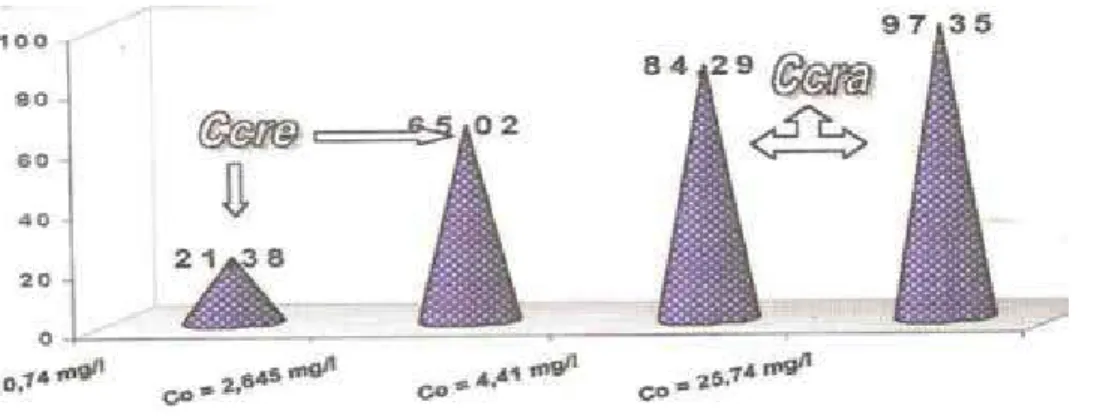
Development of the concentration balance Ceq with respect to the initial concentration of C0 for a dose of 0.6 mg/l. Evolution of the physicochemical parameters pH, EC, MES, COD, DO according to the type of current leaching [RC(Ni), RC (Zn), RC(Cu) and RC(Cr)].
Rinsing water treatment test common to plating baths
Study flow of pollution
By comparing the removal efficiency of the four metals, it appears that the strongest removal is marked for the case of Cu [16]. All spills are evacuated in the crude, but the rejection of the rinse stream that is recycled zinc.
Description of procedure for treatment
In general, the combination of elemental processing is determined by the nature of the effluent to be treated. 5-Treatment of sludge that forms once the carrier material is saturated, the sludge is then pumped out regardless of the water.
Conclusion
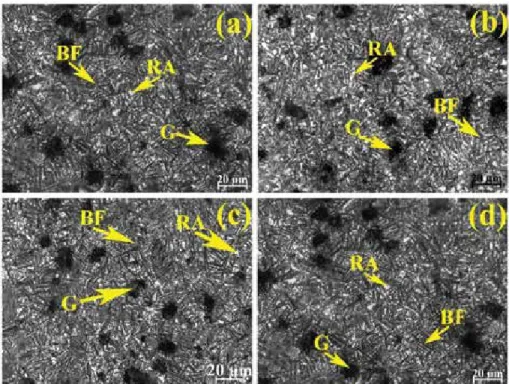
The remarkable properties of the ADI are attributed to its unique microstructural constituents such as bainitic ferrite and highly carbon-enriched retained austenite. The overall heat treatment process depends on the chemical composition and thickness of the as-cast DI.
Experimental procedure
Phase analysis was carried out using XRD analysis and mechanical properties of the welds performed under microhardness, transverse tensile strength, Charpy impact at room temperature and high cycle fatigue (HCF). X-ray diffraction (XRD) analysis was performed to estimate the volume fraction of retained austenite and its carbon content using Co-Kα anode radiation in 1.79026 targets at 24 kV and a tube current of 40 mA. The volume fraction of retained austenite was calculated using the following empirical formula [30]:.
Results and discussion 1 Microstructure
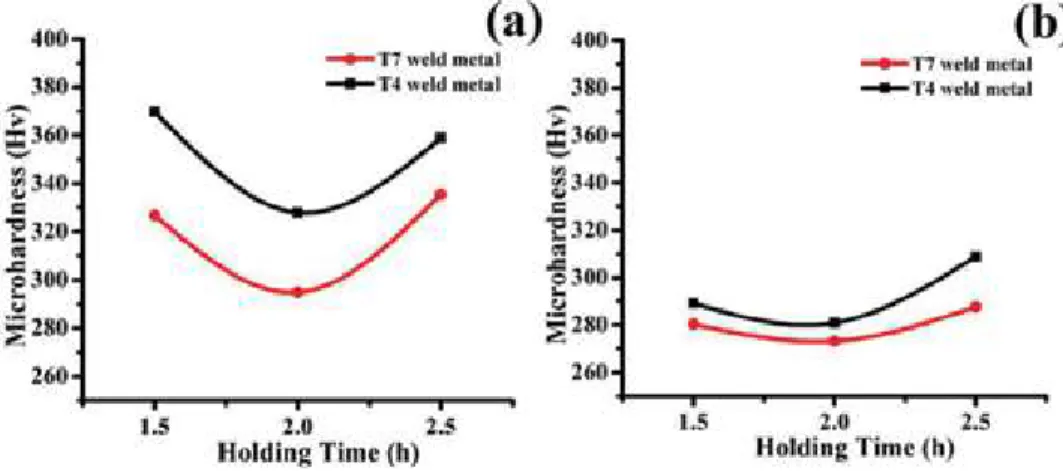
Mechanical properties
By increasing the dwell time from 2 to 2.5 h, the hardness values increase, with a decrease in the amount of carbon-enriched residual austenite in the welds. In both cases, the austempering temperature of both welds at 2 hours of holding attributed the lower hardness value to the presence of a larger amount of retained austenite.
Conclusion
Background/motivation
The author observed height differences in two different regions, the "soft region" and the "hard region". The hard region has a higher Fe content and a lower Al content, resulting in a higher stability of the β-phase to resist the precipitation of the primary alpha (αp) phase caused by the defect in the solution processing process. The alloying element helps stabilize the BCC Ti-10V-2Fe-3Al HEA structure, thereby increasing the hardness and plastic deformation of the alloy.
Conclusion
Thus, this paper exposes the influence of spark plasma sintering parameters on the mechanical properties of the synthesized alloy. Mechanical behavior of Ti-10V-2Fe-3Al alloy under high temperature and dynamic loading conditions.
Approaches to problem solution and research methods
Generation of the product characteristics during manufacturing steps using conventional (top) and hybrid (bottom) tools. Provision of the product function when creating elementЕіby a technological action Wij(tk) at HAC.
Used equipment, workpieces, and succession of experimental research
Providing product functionality by creating elements from a Wij(tk)-WJGL technological action. PCD layer up to 1.0mm thick and a solid alloy base up to 3.0mm thick.
Discussion of the obtained results
The change in the width of the destruction zone (Figure 10) measured on the natural samples (shown as individual points in the diagram) shows the following. Emerging tensions under different processing methods and their effect on the width of the destruction zone.
Conclusions
When processing materials with diamond discs or saw blades, there is no significant change in the width of the destructive zone. It has been shown that the hypothesis of a quasi-stationary rate of destruction is unacceptable for such materials, which is caused by the structure and high hardness of the material.
![Figure 7 depicts the [RMI][Metal(BTC)] structure. This same structure, how- how-ever, is shared by [EMI] 2 [In 2 Co(OH) 2 (BTC) 2 Br 2 ] structure that has a remarkably different molecular formula](https://thumb-ap.123doks.com/thumbv2/1libvncom/9201083.0/106.765.152.616.81.324/figure-depicts-structure-structure-structure-remarkably-different-molecular.webp)
![Figure 7 depicts the [RMI][Metal(BTC)] structure. This same structure, how- how-ever, is shared by [EMI] 2 [In 2 Co(OH) 2 (BTC) 2 Br 2 ] structure that has a remarkably different molecular formula](https://thumb-ap.123doks.com/thumbv2/1libvncom/9201083.0/107.765.171.592.82.362/figure-depicts-structure-structure-structure-remarkably-different-molecular.webp)