Typically, the sites determined in this way will be opened in a call for tender, where the second phase of the wind farm design is carried out by the wind energy developers. In the UK, transmission is part of the strike price and therefore has to be financed as part of the wind farm investment. Different generations of designs can be distinguished when looking at the development of Danish offshore wind farms.
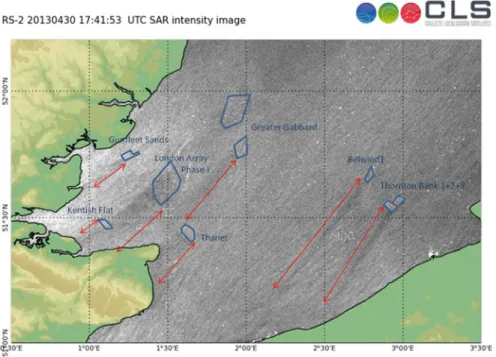
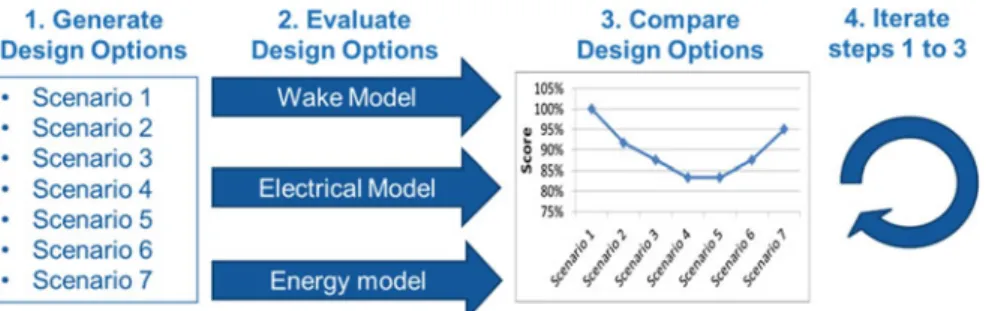
Wakes are not only a problem within a wind farm, they also extend over many kilometers downstream of the wind farm. A central concept in the DTOC tool is the organization of wind farm variants as scenarios and scenario trees.
Large Eddy Simulation of Wind Farm
Aerodynamics with Energy-Conserving Schemes
- Introduction
- Simulation
- Literature Review
- Power Losses and Observations
- Research Objectives
- Tests and Results
- EC Time Integration
- EC Spatial Discretisation
- Validation
- Case Study: EWTW
- Conclusions and Recommendations
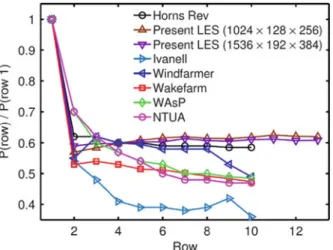
The power on the y-axis is normalized by the power of the turbines in the first row. Once the turbulence generated by the wake reaches its peak value, the recovery of the reduced speed in the wake also reaches its limit. Validation of the combination of the ECNS and the chosen SGS model for wind farm simulations.
Therefore, we were able to set the Smagorinsky model in the ECNS, to a value of the Smagorinsky constant, CSD0.12. The code with the chosen value of the Smagorinsky constant was validated against two test cases.
Open Access This chapter is distributed under the terms of the Creative Commons Attribution-NonCommercial 4.0 International License (http://creativecommons.org/licenses/by-nc/4.0/), which permits any non-commercial use, duplication, adaptation, distribution, and reproduction. in any medium or form, provided you give proper credit to the original author(s) and source, provide a link to the Creative Commons license, and indicate whether changes have been made. Images or other third-party material in this chapter are covered under a Creative Commons license for the work, unless otherwise noted in the credit line; if such material is not covered by a Creative Commons license for the work and such action is not permitted by law, users will need to obtain permission from the licensee to duplicate, adapt or reproduce the material.
A Theoretical Risk Management Framework for Vessels Operating Near Offshore Wind
The Need for Maritime Risk Management Around Offshore Wind Farms
- Trends in the OWF Industry
- The Need for Maritime Risk Assessment and Management
In Europe, the offshore wind turbine has an average power of 3.6 MW and produces 12,961 MWh of energy annually; in comparison, an onshore turbine has an average capacity of 2.2 MW and produces around 4702 MWh of energy (EWEA2015). A wind farm creates several obstacles in the water that ships must avoid; the presence of a wind farm near a shipping lane effectively narrows the area in which vessels can operate, thereby increasing traffic density. In addition to increased traffic density and reduced sea space, wind turbines can also cause problems with ships' navigation equipment.
In fact, the potential disasters facing maritime operations from offshore wind farms can be classified into five different categories. In addition to the risk areas mentioned above, OWF can also affect the safety of recreational vessels and fishing activities; however, these areas are beyond the scope of the current research. Any of the above marine accidents, if they occur near an OWF, can cause an entire farm to shut down or cause serious delays in installation, repair or maintenance services – resulting in higher costs.
In the worst-case scenario, marine accidents can not only damage vessels but also turbines, leading to further outages and higher repair costs, further reducing the reliability of offshore wind. According to the findings of Dai et al. 2013), a fairly small support vessel with a displacement of 230 tons striking the turbine tower landing structure head-on at a speed of only 0.48 m/s would be sufficient to cause local yielding in the structure; a 0.84 m/s collision with the landing structure would result in a global yield. In contrast, a head-on collision of the same vessel directly with the tower would result in local yield and global yield at velocities of 0.34 m/s and 0.55 m/s, respectively.
BSH (2015) and MCA (2013) may require wind farm owners to demonstrate that their OWF will not impede the safety of marine operations. In summary, a thorough risk management process can serve two very important purposes – avoiding costly accidents and demonstrating the safety and reliability of OWF. This makes good risk management frameworks invaluable to maritime and OWF industry stakeholders.
Literature Review
- Maritime Risk Assessment Models for OWFs
- Probability Models
- Consequence Models
- Existing Risk Management Frameworks
- The Gap in Existing Risk Management Frameworks
Similarly, a risk management framework can elaborate on what to do with the results of the risk assessment and how to interpret them in a meaningful way using tools such as risk matrices and principles such as ALARP (As Low As Reasonably Practicable). A risk management framework may also include guidance on the selection and evaluation of various risk control measures through techniques such as cost-benefit analysis. AIS data can also be combined with marine geographic data, and information such as bathymetry and geography, to assess the risk of contact or grounding events (Hansen et al.2013).
For example, calculating the probability of causation of contact incidents requires that factors such as the location and size of a fixed object be taken into account. Human reliability techniques such as HEART (Human Error Evaluation and Reduction Technique) and THERP (Human Error Rate Prediction Technique) can be used to quantify the frequency of human error. Various studies have also quantified the effect of factors such as weather and poor visibility on the likelihood of causation (Larsen 1993).
Some recent studies of the probabilities of causality also consider the effect of technical and technological factors, such as coastal state facilities, VTS and aids to navigation (Lehn-Schiøler et al. 2013). Technical factors - such as steering or engine failure - can also affect the probability of causality (Hänninen and Kujala2012). As such, causality probabilities are often calculated through sophisticated risk assessment methods such as Fault Trees, Event Triage (Fowler and Sørgård2000; Haugen1991) and Bayesian Networks (Akhtar and Utne2013).
To some extent, even the most sophisticated causality probability estimates rely on historical data, and the best way to quantify such data is through the use of accident investigation models—best demonstrated by authors such as Mazaheri et al. Among others, Goerlandt and Montewka (2014) developed thorough and robust probabilistic consequence models using methods such as Bayesian Networks, fault trees and event trees (Li et al.2012). This raises doubts as to whether these frameworks are sophisticated and detailed enough to adequately assess the consequences of complex accidents, such as vessel-turbine collisions.
The Proposed Risk Management Framework
- Pre-risk Assessment (Blue): Steps 1–3
- Risk Assessment/Estimation (Green): Steps 3–9
- Risk Evaluation: ALARP and Acceptance Criteria
- Risk Management
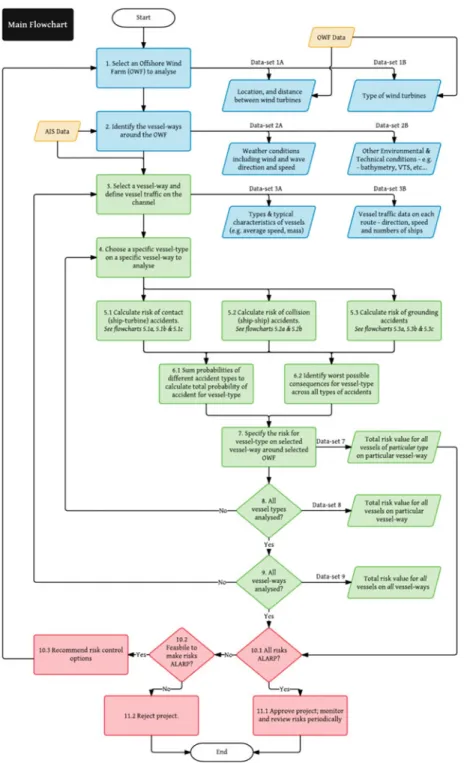
To calculate the overall risk of contact events, a user must first calculate the probability of force contact and motion events individually (Figs. 21.2 and 21.3), and then calculate the consequences (Fig. 21.4). Therefore, to calculate the probability of contact with power, it is recommended that the user follow the geometric-causal probability model as described in Section 21.2.1.1.1. Calculating the probability that a ship does not take a corrective action, deviating from its course (step 5.1.4 in Fig.21.2), is a bit more challenging—.
A user of the framework can also multiply this total probability value by another given geometric equation to calculate the probability of actually hitting a wind turbine instead of sailing on a wind farm (step 5.1.5 in Fig. 21.2). After the force contact probability has been calculated, the next step is to calculate the displacement contact probability (Fig.21.3). Therefore, to calculate the probability of a moving contact event, a user must first calculate the probability that a ship of the type will experience an engine failure (5.1.10 in Fig.21.3).
The other important parameter to calculate when estimating the probability of motion contact is the probability that a vessel actually moves towards the OWF (5.1.11 in Fig.21.3). The first step (5.1.18 in Fig.21.4) when calculating the consequences is to estimate a number of possible values of energy distribution. Ideally, the process described by Fig.21.4 should be repeated twice—once for propulsion vessels and once for powered vessels.
Assessing the probability of a powered collision thus involves the multiplication of two main factors (5.2.4 in Figure 21.5): the geometric collision candidates and the probability of the cause. A major difference is that the user must select an attack ship type (5.2.8 in Figure 21.6), rather than a turbine type. To be consistent, the present researcher recommends following a similar procedure to calculate the probability of drifting grounding as described for assessing the probability of drifting contact events (Fig. 21.3).
After assessing the risk for each ship type (steps 5 to 9 in Fig.21.1), the next steps (10-11) involve evaluating the probability values and consequences against some "acceptability" criteria. Barrier effects and risk control options can be measured by going through the process described in the framework (Fig.21.1) and updating the probability and consequence values for each vessel type as needed.
Outlook and Conclusions
In: Pedersen PT, Lützen M, Simonsen BC et al (eds) Proceedings of the 2nd international conference on collision and grounding of ships (ICCGS), Copenhagen, 2001. Cho SR, Seo BS, Cerik BC et al (2013) Experimental and numerical investigations of the collision between offshore wind turbine support structures and service vessels. Dai L, Ehlers S, Rausand M et al (2013) Risk of collision between service vessels and offshore wind turbines.
Ellis J, Forsman B, Huffmeier J et al (2008b) Methodology for assessing risks to vessel traffic from offshore wind farms. Hänninen M, Sladojevic M, Tirunagari S et al (2013) Feasibility of crash and landing data for probabilistic accident modeling. Hansen MG, Randrup-Thomsen S, Askeland T et al (2013) Bridge crossings in Sognefjorden – ship collision risk studies.
Montewka J, Ehlers S, Goerlandt F et al (2014b) A risk assessment framework for maritime transport systems - a case study of high seas collisions involving RoPax vessels. Ozguc O, Das P K, Barltrop N et al (2006) Numerical modeling of ship collisions based on finite element codes. In: Cunha A, Caetano E, Ribeiro P et al (eds) Proceedings of the 9th international conference on structural dynamics (EURODYN2014), Porto, 2014.
Dissertation, Technical University of Denmark Sirkar J, Ameer P, Brown A et al (1997) A framework for assessing environmental performance. Ståhlberg K, Goerlandt F, Ehlers S et al (2013) Impact scenario models for probabilistic risk-based design for ship-ship collision. Zilakos I, Toulios M, Sameulides M et al (2009) Simulation of the response of double bottoms under grounding actions using finite elements.
Offshore Wind Decommissioning
![Fig. 20.2 Large Eddy Simulation of the Horns Rev wind farm [Source: Ivanell (2009)]](https://thumb-ap.123doks.com/thumbv2/1libvncom/10207446.0/14.659.128.537.91.496/fig-large-eddy-simulation-horns-rev-source-ivanell.webp)