Where the work of others has been used, this is duly acknowledged in the text. Two experiments were conducted to investigate the competitive effects and responses of eight selected common species in the area.
PLAGIARISM
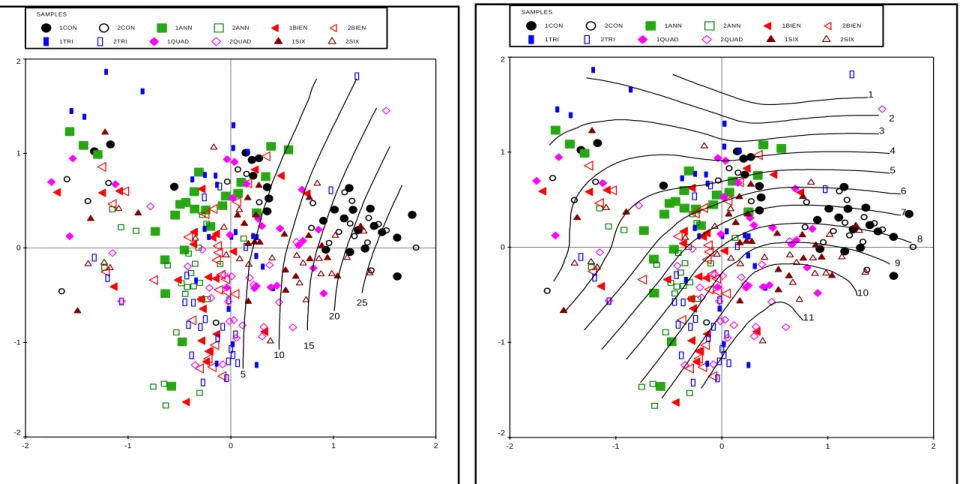
3a NMS trajectories of species composition for the annual and biennial burns of the long-term burn trial. 30 Figure 2.3b NMS trajectories of species composition for the three-year and four-year burns of the long-term burn trial.
GENERAL INTRODUCTION
- The structure and function of ecological systems
- Factors affecting composition and primary productivity in ecological systems
- Solar radiation
- Soil fertility
- Plant Competition
- The effect of disturbance on ecosystem function based on Terrestrial Ecosystem Models
- Problem statement and justification for the studies
- Main objectives of the studies
In the absence of disturbance, RH rises as soil inputs rise, and NPP gradually decreases until the ecosystem's carbon balance is in equilibrium (Field et al. 2004). One of the biggest problems facing rangeland management in many ecological systems is habitat degradation and compositional change.
LONG-TERM EFFECTS OF FIRE FREQUENCY ON HERBACEOUS
Introduction
- Fire as an ecological phenomenon
- A brief overview of fire ecology
- Fire frequency and species composition
- Justification for the study
- Objectives
- Study site
- Physical environment
- Climate and vegetation
- Experimental design and treatments
- Determination of herbaceous species composition
- Data analysis
It can potentially be expressed in terms of a number of interacting variables, such as time since the most recent fire, length of fire intervals, and variability of interfire intervals (Morrison et al. 1995). It is thus related to a high abundance of fire-intolerant species that tend to dominate the community in the prolonged absence of fire.

Results
- The Nonmetric Multidimensional Scaling (NMS) sample ordination
- The Bray-Curtis dissimilarity analysis
In addition, some differences were also evident between the two replicates of each treatment, with the largest notable difference being the three-year and four-year burns (Figure 2.3b). In contrast, Themeda triandra was most dominant in the annual and biennial plots and became less abundant as fire frequency decreased (Figure 2.5a).

Discussion
Species belonging to the same genus also responded in exactly the opposite way to burning frequency: for example, Sporobolus fimbriatus was most abundant in the control burning plots, while Sporobolus africanus was mainly in the annual and biennial plots (Figures 2.4; 2.5b). The fact that the composition in the second replicate without burning was as different from the first replicate as the less frequently burned plots illustrates the dynamic nature of ecological systems, which is driven by a range of biotic and abiotic environmental factors that inevitably result in changes in the compound.
Conclusions
Effects of fire frequency on plant species composition of sandstone communities in the Sydney region: Combinations of fire intervals. Effects of fire frequency on the plant species composition of sandstone communities in the Sydney region: fire interval and time since fire. A study was conducted to investigate the long-term effect of fire frequency on light interception and biomass production in the False Thornveld of the Eastern Cape (320 47' S; 270 01' E).
Introduction
- Solar radiation and energy flow in ecological systems
- Photosynthetically Active Radiation and Leaf Area Index
- Solar radiation and biomass production
- The role of fire on light interception and biomass production
- Objectives and hypothesis
The percentage or fraction of intercepted PAR (%IPAR or fIPAR) measures the fraction of available radiation in photosynthetically active wavelengths that is actually absorbed by the canopy, and their values vary between 0.0 and 1.0 (Knyazikhin et al. 1998b). The leaf surface is the exchange surface between the photosynthetically active component of the vegetation and the atmosphere and controls light, thermal and hydraulic conditions within the plant canopy (Arias et al. 2007). Fire frequency is the number of fires experienced by a given community during a given time period (Morrison et al. 1995).
Material and Methods
- Measuring light availability using PAR Ceptometer
- Determination of aboveground biomass production
- Data analysis
All burn treatments coincided in August 2004 (Table 2.1) so (except the unburned plots) all plots were grown from a clean start for the 2004/2005 season. After testing for normality, treatment effects on incident PAR, fPAR, LAI, and aboveground biomass were tested by a one-way Analysis of Variance (ANOVA), where significantly different means (as indicated by the F test) were separated using the least important. Difference test (LSD) at a probability level of 5%. FIPAR and LAI were regressed on each other and also on aboveground biomass using curvilinear models where the relationship was not linear to test relationships between these variables.

Results
- Effect of fire frequency on PAR above and below canopy
- Effect of treatments on fIPAR, LAI and aboveground biomass
- The relationship between fIPAR and LAI as influenced by fire frequency
- The relationship between %IPAR and biomass production as influenced by burning
Except for the annual and biannual burns, all other fire treatments produced significantly greater aboveground biomass production than the no-burn control treatment (Table 3.2). There was no linear relationship, but a weak positive polynomial correlation between the proportion/percent of intercepted PAR and aboveground biomass production (r2 = 0.58; P≤ 0.05). As fire frequency increased (annual and biennial), both the percentage of intercepted PAR and biomass production decreased, and with less frequent burns, fire frequency (six-year and no-burn) increased, as shown in Figure 3.3.

Discussion
- Effect of fire frequency on light interception and Leaf Area Index
- Effect of fire frequency on biomass production of herbaceous plants
Arias (et al. 2007) also found a strong relationship between calibrated LAI and stand yield of dominant tree species in Costa Rica. The rate at which biomass changes depends on soil moisture, mortality, consumption rate of grazers and fire effects (van Langeveld et al. 2003). In their research, Van Langeveld (et al. 2003) observed an enormous increase in biomass on both burned and unburned plots.
Conclusions
Calibration of LAI-2000 to estimate leaf area index (LAI) and assessment of its relationship with stand productivity in six native and introduced tree species in northern Costa Rica. Estimation of vegetation leaf area index and fraction of absorbed photosynthetically active radiation from MODIS and MISR data. Measurements and simulation of forest leaf area index and net primary productivity in northern China.
EFFECTS OF LONG-TERM BURNING FREQUENCY ON SOIL
Introduction
- The role of macro and micronutrients in plant growth and performance
- The importance of Soil pH
- Effects of fire frequency on soil nutrient status
- Nitrogen dynamics in natural ecosystems
- Fire effects on nitrogen mineralization
- Rationale and Justification for studies
- Objectives and hypotheses
Farmers often burn rangeland, regardless of the amount of undrained material remaining from the previous season (Teague et al. 1984). Soil nitrogen is one of the most important factors controlling ecosystem stability (Vitousek 1990; Evans et al. 2001). Among the major soil nutrients, nitrogen is likely to be the most sensitive to the impacts of fire (Carreira et al. 1994).
Material and Methods
- Study site
- Soil sampling
- Chemical analyses
- Data analyses
The bags were left in the soil from October 2007 to April 2008, and then retrieved from the plots. The effects of treatments on soil nutrient concentrations were tested on each variable using a two-way ANOVA after testing all assumptions. Effects of burning treatments on N mineralization were tested by one-way analysis of variance, while differences in individual means were tested using the LSD test.
Results
- Effects of treatments and depth on soil chemical properties
- Treatment effects on N mineralization
- Treatment effects on soil pH
- Effects on nutrient concentrations
- Fire effects on N Mineralization
Calcium and phosphorus concentrations were highest at the 2-4 cm layer during annual burn treatment. Failure to treat upper layer burns resulted in the highest C concentration, which was significantly different from all other treatment options (except the upper biennial and triennial burns). Fynn et al. 2003; Snyman 2003), with the most common combustion treatments retaining organic matter with a lower N content than the organic matter remaining in the non-burning treatments (Manson et al. 2007).

Conclusions
Declining soil quality in South Africa: Effects of land use on soil organic matter and surface crust. Immediate and long-term effects of fire and ash fertilization on Zambian miomb forest soils. Short- and long-term effects of burning on yield and nutrient uptake in food plants.
INVESTIGATION OF THE SHADE TOLERANCES OF SEVEN GRASS
Introduction
- Species classification based on shade tolerance
- Effect of shade on species‘ dry matter production
- Impact of shading on rangeland dynamics
- Objectives and hypothesis
Physiologically, shade-tolerant species have low rates of photosynthesis, respiration rates; light compensation point (LCP) and nitrogen content (Poorter 1999; Dalling et al. 2001). These plants also allocate most of their photosynthate to the leaves to increase light interception (DeLucia et al. 1998). Shade limits primary productivity, although the limitation varies with the species' shade tolerance and nitrogen supply (Wong et al. 1985a).
Material and methods
- Experimental setup
- Statistical analysis
Dry mass per tuft was determined by harvesting, oven drying oven drying and weighing to constant mass at 60 °C. The experiment was carried out outdoors at the Neil Tainton Arboretum, University of KwaZulu-Natal's facilities in Pietermaritzburg, and arranged as shown in Plate 5.1. The analyzes tested the dry mass for differences between species, between shade treatments and their interactions.
Results
- Species biomass production
- Species‘ responses to shading
- Relationships between species‘ biomasses and shade level
The results of the regression analyzes indicated a linear relationship between the species dry masses and percentage of shade (P < 0.05). The dry masses of all the grasses decreased linearly with an increase in percentage of shade to several degrees (Table 5.3). 4 Regression results showing the relationship between species biomass and percent shade for grass species six months after planting (P < 0.05).

Discussion
- Species classification based on shade tolerance
- Implications for range management
Panicum Max, Themeda triandra, Sporobolus fimbriatus are classified as intermediate or moderately shade tolerant due to their close similarity in response to shade. Although Sporobolus fimbriatus often grows in wet places along rivers and near roads, as well as in shade (van Wyk and van Oudtshoorn 2004), and is otherwise classified as an Increaser II species by Trollope (1986), its response to shade was very similar to those of other species classified as moderately shade tolerant. Therefore, Eragrostis curvula is classified as a moderately shade tolerant species, although it may show some characteristics of a shade intolerant species to some extent.
Conclusions
Differences in species responses to the degradation gradient in the semi-arid grasslands of southern Africa and the role of ecotypic variation. Meta-analysis of the interaction between shade tolerance, light environment and growth response of woody species to elevated CO2. Effects of elevated CO2 and light availability on the photosynthetic light response of contrasting shade tolerance.
COMPETITIVE EFFECTS AND RESPONSES OF SELECTED SPECIES IN
Introduction
- Concepts and theories of plant competition
- Competitive response and competitive effect
- Rationale and Objectives
It is recognized that species in natural communities are organized into transient competitive hierarchies, and that these hierarchies vary between environments (Keddy et al. 1994). However, the influence of competition on extremely low and high fertility gradients is highly controversial (Fynn et al. 2005). Essential resources such as nitrogen and phosphorus can limit primary production of individual plants (Tilman 1982; Ingestad and Agren 1995), and can play a role in plant community composition (Daufresne et al. 2005).
Material and Methods
- Selection of species
- Competitive response experiment
- Competitive effect experiment
- Data analyses
The responses of the eight phytometer species to competition intensity under different levels of soil fertility and simulated non-selective grazing (cutting) were determined in a plot-based outdoor experiment. A pot experiment was carried out in pots placed under shade netting (90 % light penetration) to examine the competitive hierarchies of the eight species described in Table 6.1. Each of the eight species was used as a phytometer in mixed cultures, with or without four neighbors of Eragrostis curvula planted 7.5 cm around the phytometer.

Results
- Competitive responses
- Species Relative Interaction Indices
- Species‘ competitive effects
- Effects of clipping and soil fertility on species‘ performances
Mowing and fertility had significant effects on the biomass production of phytometers as well as neighbors (P<0.05), and the mass of the different species was significantly different across the treatments (P<0.01). There was a significant interaction between fertility and mowing (P<0.05), and these two factors significantly affected the biomass of both the phytometers and the neighboring plants (P<0.05; . Appendices 3 and 4). 4 Mean (log) biomass of phytometer species for the interaction between mowing and fertility in the competitive effect trial (n=196; P < 0.05).

Discussion
- Species‘ competitive effect and response hierarchies
- Competition, disturbance and resource availability
- Competitive interactions between species
On the other hand, it appears that the smaller species of grasses (M. decumbens) and the relatively slower-growing species of woody plants (A. karroo) could not compete with the strong competition of the larger, faster-growing species of grasses. discredit this model, but rather support the alternative model of 'resource pre-emption'. Increasing soil fertility (50% and 100%) caused some shifts in the hierarchy of species' competitive response: all species did better without clipping, and taller grasses gained momentum and produced more biomass than smaller grasses. The trends in this study showed that the competitive ability of a species is inversely related when the species differ in size (ie, either height or leaf size).
Conclusions
Plant strategies and trait trade-offs affect competitiveness along gradients of soil fertility and disturbance. Evidence for the existence of three primary strategies in plants and their relevance to ecological and evolutionary theory.
GENERAL DISCUSSION AND CONCLUSIONS
General Discussion
- The role of fire in shaping species composition in a South African savanna
- Long-term effects of burning frequency on plant productivity and soil properties
- Competitive interactions of key species in a South African semi-arid savanna: The
General Conclusions