91 Figure 4.9 Concentrations (µg/g±SD) of 7 PAHs in soil from the banks of the Msunduzi River in the spring season. 104 Figure 4.13 Concentrations (µg/g±SD) of 7 PAHs in surface sediments from the Msunduzi River during the spring season.
1
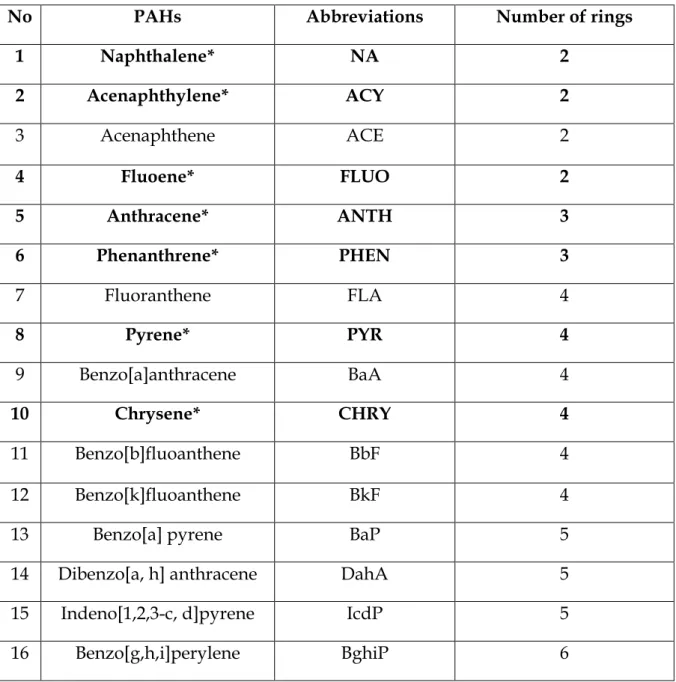
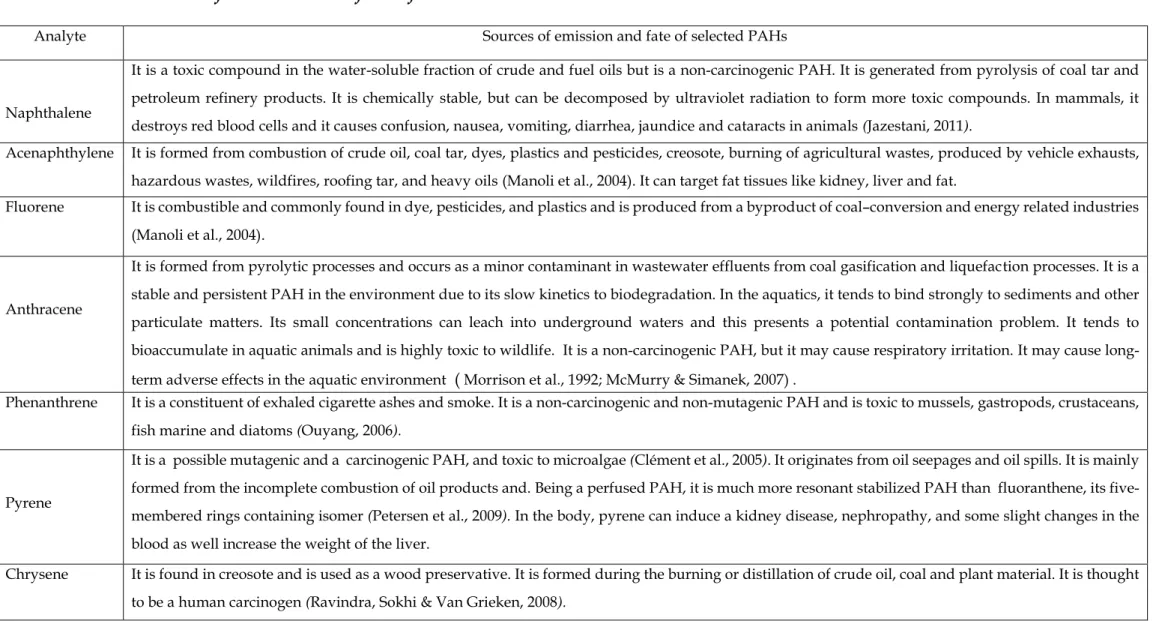
- Source and Occurrence of PAHs in the Environment
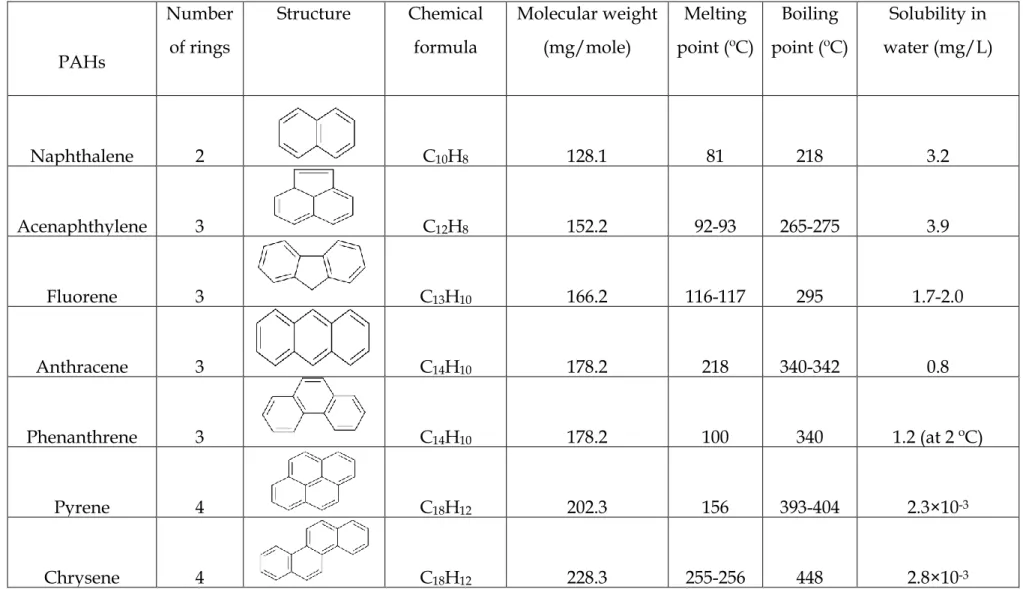
- Chemical and Physical Properties of PAHs
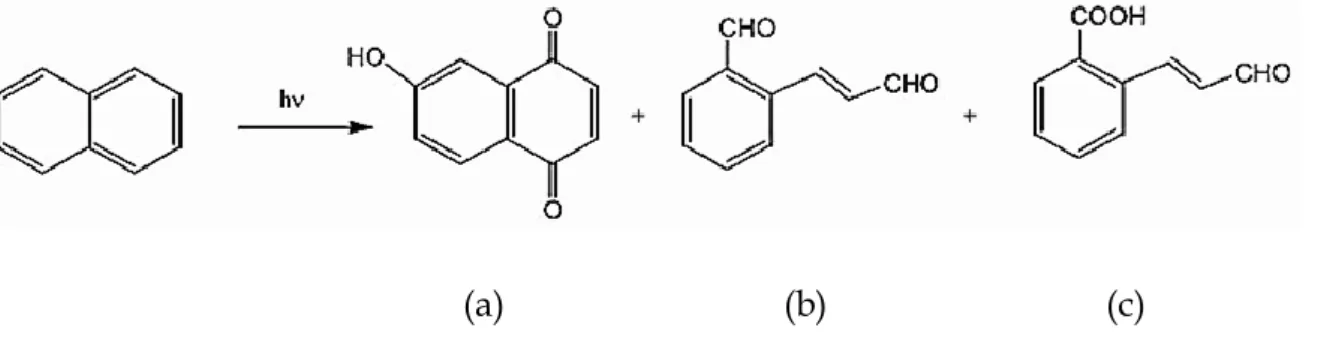
- Reactivity of PAHs
- Source Apportionment of PAHs
- Exposure and pathways of PAHs
- Environmental Fate
- Justification of the Study
- Aims and Objectives
The photochemical reactions of PAHs are important in determining their ultimate fate in the atmosphere (Yu, 2002; Lohmann et al., 2009). No data have been reported on the contamination levels of PAHs in soil and water along the Msunduzi River.
Extraction Techniques and Instrumental Methods Used in the
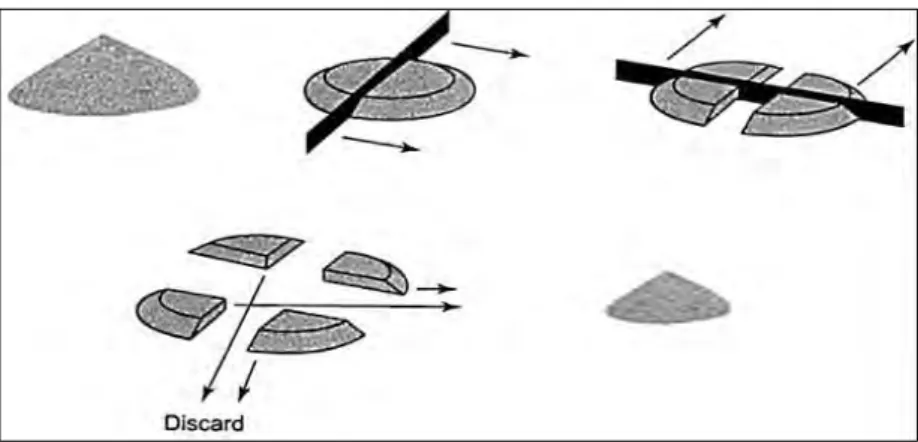
- Pre-treatment of environmental samples
- Methods for extracting persistent organic pollutants from
- Extraction of PAHs from water samples
- Extraction of PAHs from solid samples
- Purification of crude extracts by column chromatography . 28
- Gas chromatography (GC)
- Gas chromatography-mass spectrometry (GC-MS)
- Ionization sources
- Mass analysers
- Electron-multiplier detectors (EMDs)
This increases the extractability of analytes by increasing the surface area in the sample (Mandingo et al., 2015). These include sector-based analyzers (magnetic and electrostatic analyzers), time-of-flight (TOF), and filter-based cyclotron, {ion trap, quadrupole, and Fourier transform (FT-IR)} (Shah et al., 1989).
Preparation of Calibration Curves Using the Internal Calibration
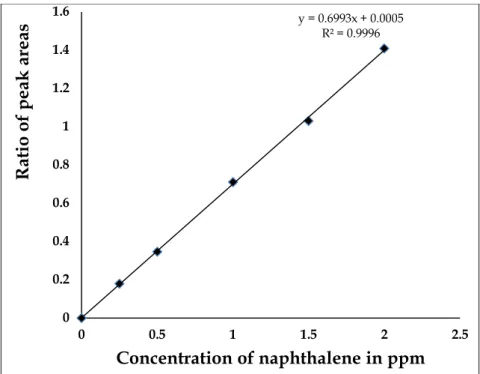
In order to quantify the amount of the target analytes, the actual samples must be spiked with PAHs, as well as their deuterated (isotope) standards (Khan et al., 2005). The spot solutions of known concentration are normally run several times (at least three) on the GC-MS instrument to record their chromatograms as well as the mass spectra. The concentration of each separated analyte is directly proportional to its chromatographic peak area (Koltsakidou et al., 2015).
The concentration is obtained by applying a linear equation: y = ax + b produced from each calibration curve (as identified in section 2.3), where y symbolizes the ratio of the peak areas of the internal standard and the analyte, and x represents the amount of the analyte, b is an intercept and a is the slope. If the addition is performed at a constant level, the concentration of the analyte detected by the instrument (and naturally occurring in the sample) is estimated by subtracting the amounts added from the amount deduced from the analysis of the spiked split. This approach eliminates the chances of detecting false positives for trace level analysis and especially against the detection limits of the technique.
Applications of GC-MS Method for the Analysis of PAHs and
As a result, a GC-MS instrument has been used to analyze the active elements and the analytes in various subjects, such as drug discovery, fire investigation, ecological investigation, explosive investigation, and identification of the unknown samples (Dong et al., 2012 ) ; Pang et al., 2015). Furthermore, GC-MS has also been used in the last decade to analyze some POPs such as PAHs in various environmental matrices. Total PAH concentrations ranged from 88 to 6338 ng/g dry weight. 2009) extracted PAHs in sediment samples by the soxhlet extraction technique and separated and quantified them using a GC-MS instrument.
Concentrations ranged between 6 and 46 μg/g dry weight. 2009) investigated the distribution of PAHs in surface sediments of the western Mediterranean Sea using GC-MS. After purification and concentration of the extract, analysis was performed using a GC-MS instrument. Total PAH concentrations ranged between 1 and 280 μg/kg dry weight. 2012) extracted industrial harbor sediments and the determination and quantification of PAHs in the sediment was carried out by GC-MS with the help of.
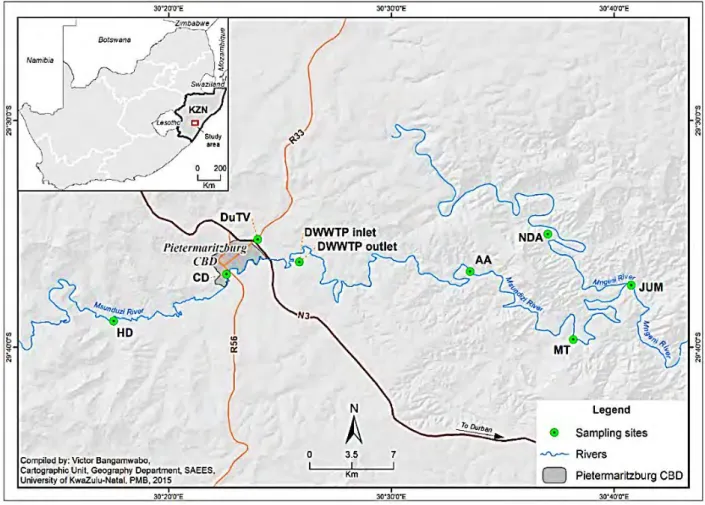
Understanding the Study Area and its Impacts on the Pollution of
- Description of KwaZulu-Natal Province
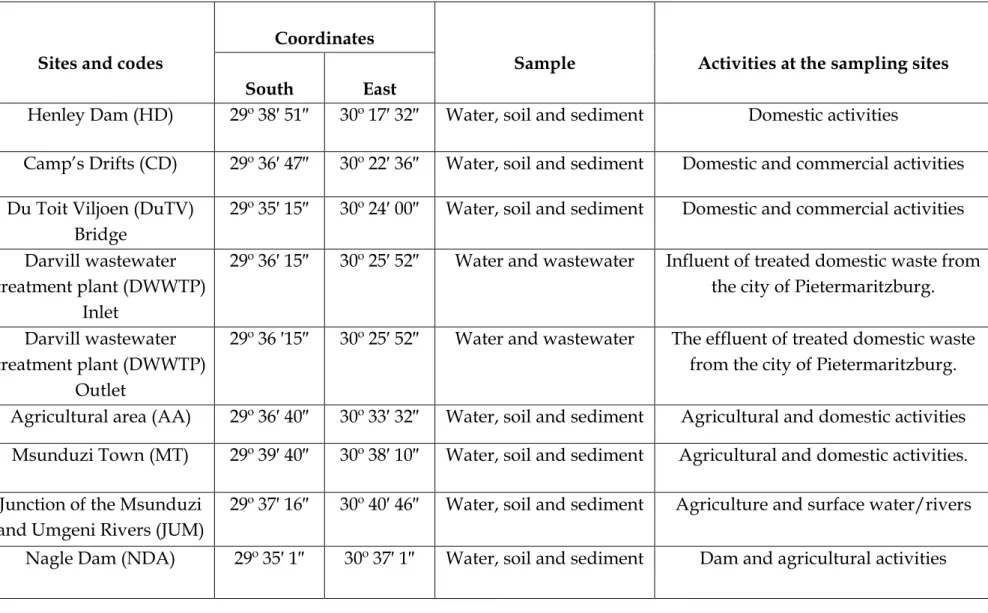
- Location of sampling sites in KZN Province
- Detailed descriptions of sampling sites
- Sampling plan
- Experimental
- Extraction of PAHs
- Purification of extracts
- Instrumental analysis
- Analysis of PAHs by GC-MS
This increases their concentration levels, especially in sediments and soils along the river bank (Richard & Poccard, 1998; Gemmell & Schmidt, 2013). At Camp's Drift near the central business district of Pietermaritzburg (29º S and 30º E, Figure 3.1), the Msunduzi River is heavily polluted by sewage from domestic, industrial and commercial activities. Some of the treated sewage is discharged into the Msunduzi River which empties into the Umgeni River and the Inanda Dam (Sikhakhane, 2001).
Details of the samples collected at each site are presented in Table 3.1. In summary, samples were collected at 8 sampling sites covering significant stretches of the Msunduzi River. The volume of the dried extracts was reduced to 5 ml using a rotary vacuum evaporator (Heidolph Laborota 4000 model, Heidolph North America) (Prycek et al., 2007).
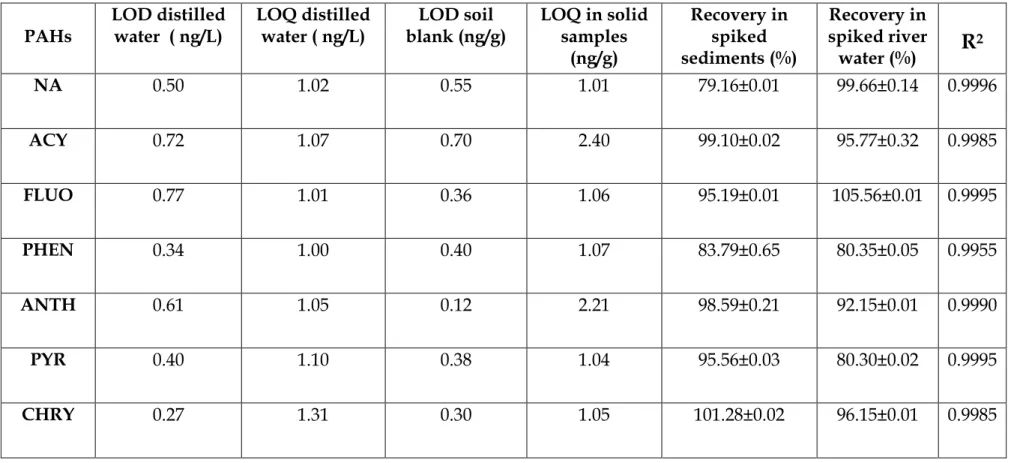
Calculation of Limit of Detection, Limit of Quantification and
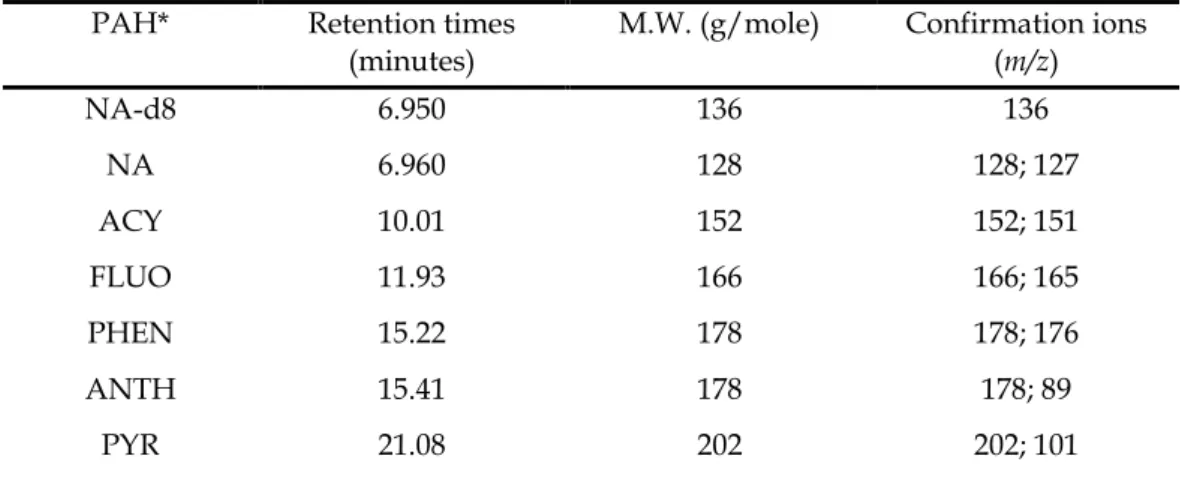
The TIC retention times, molecular weights (g/mol) of each PAH and their m/z values used for their identification are presented in Table 4.2. As shown in Figure 4.1 (with TIC retention times in Table 4.2), the 7 PAHs are well separated from each other, including phenanthrene (4) and anthracene (5), which elute close together at retention times around 15, 22 and 15 ,41 minutes, or As shown in Table 4.2, all PAHs were detected at m/z values corresponding to their molecular ions, with few fragmentation peaks observed.
A single electron is removed from the highest molecular orbital of each PAH molecule to form a stable and an odd-electron radical molecular ion. The m/z values of each PAH were used to identify (as complementary data to the retention times from the TIC) the 7 PAHs that were selected for quantitative analysis (see also the figures in Appendix 3 for some confirmation ions of PAHs). In this mode, the percent recovery of each PAH was calculated by subtracting the amount measured from the unspiked doublets measured at set molecular ion peaks (Table 4.2).
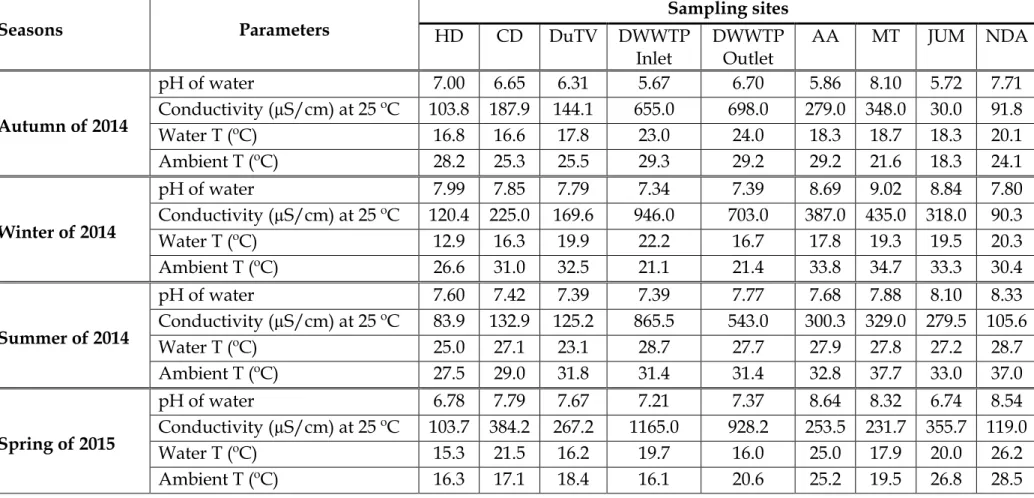
Physical parameters and concentrations of PAHs in the Msunduzi
- Conductivity, pH and temperature of the Msunduzi River
- Concentration of PAHs in the surface water and the wastewater
- Concentration of PAHs in soil collected from the banks of the
- Concentrations of PAHs in the surface sediments from the
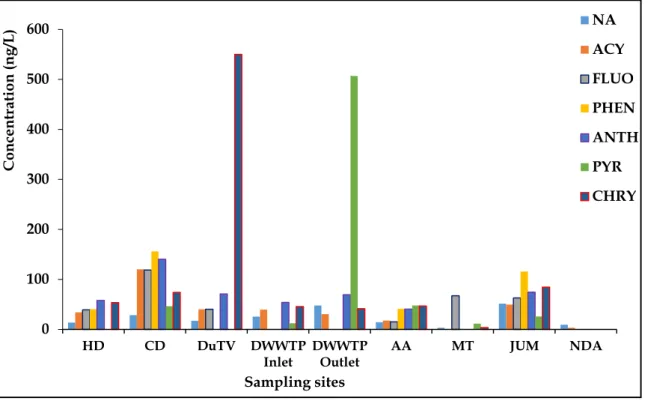
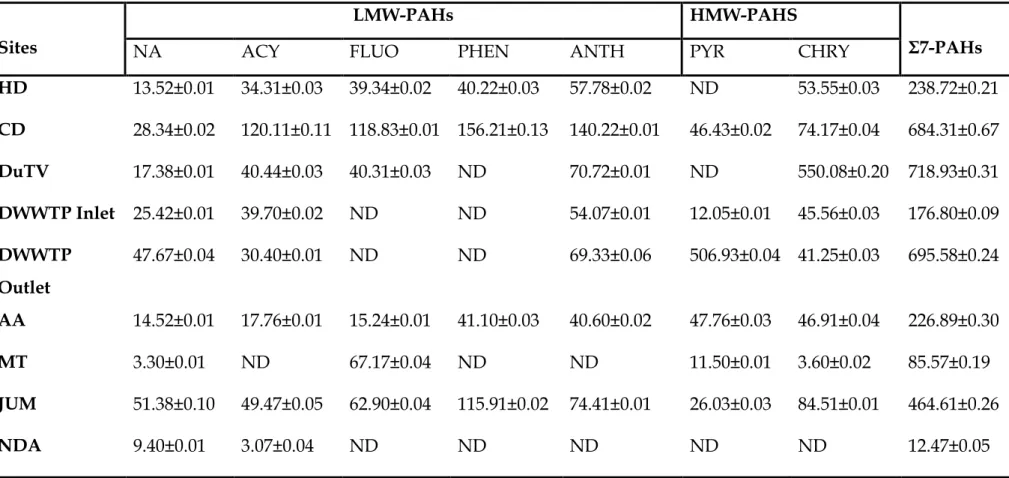
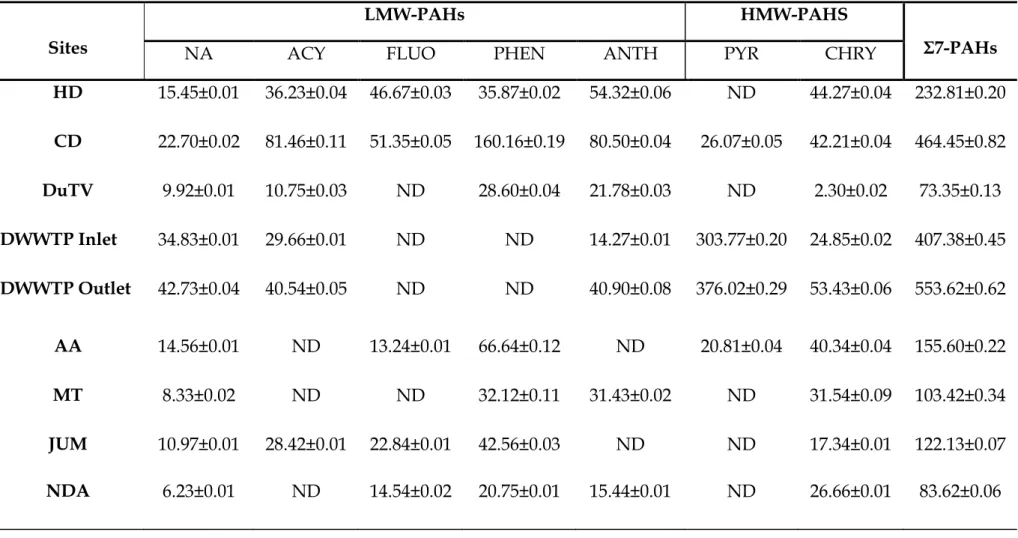
During the spring season, the pH and EC in the surface water fluctuated slightly from the source to the mouth of the river. The lowest cumulative concentrations of 7 PAHs were observed in water collected at the NDA sampling site (74.42 ng/L). This season showed an exception in the concentrations of 7 PAHs in the water from the source to the mouth of the river.
As shown by the sum of the concentrations of the 7 PAHs in Table 4.7, the sums of the concentrations were high in the upper and middle areas (between HD and DWWTP inlet sampling locations). The higher concentrations of PAHs in the soils collected from the AA sampling site during the winter season of 2014 may be related to the composition and texture of the soil at the sampling sites as explained during the fall season of 2014. A lower sum of the concentrations of the 7 PAHs were observed in the soil samples collected from the DuTV bridge and NDA sampling sites.
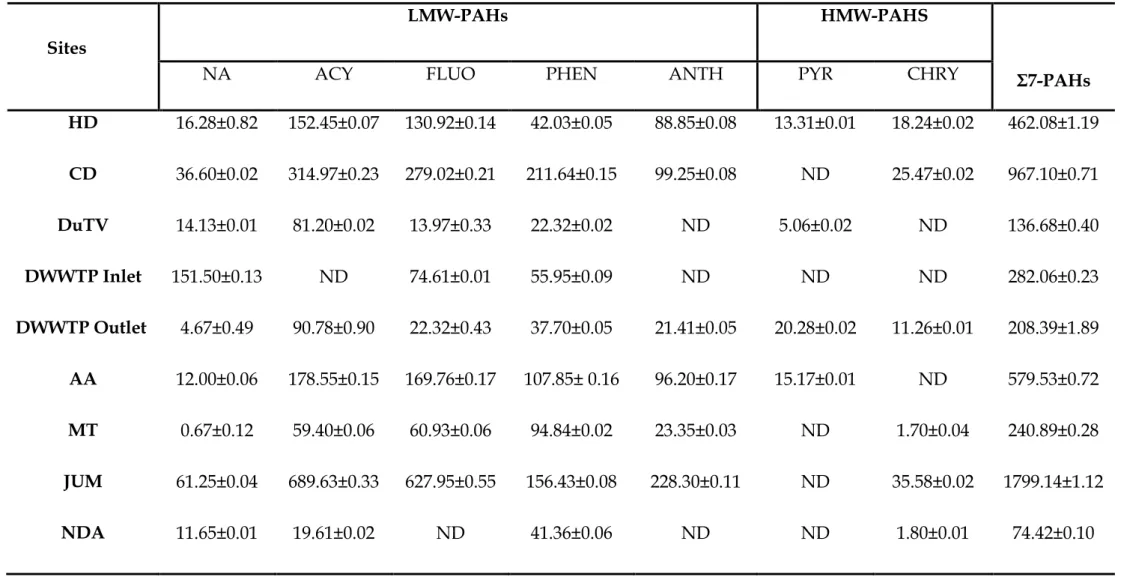
Other higher concentrations of individual PAHs were for FLUO found in surface sediments collected from the JUM sampling site (41.72 µg/g). The surface sediments collected from the JUM and NDA sampling sites (along the Umgeni River) were higher than the sum of the PAH concentrations found in the surface sediment collected from the MT sampling site.
Seasonal Variations of PAH Concentration and Physical Parameters
PAH concentrations in KwaZulu-Natal surface sediments were found to range from 0.006 to 3.24 µg/g dry weight (Vogt, 2014), which was low compared to the results of this study. The concentration of PAHs in soil and surface sediments was found to be relatively higher than in water samples. The occurrence of PAHs in the environment changes seasonally, as each season has its own physical and chemical parameters.
In South Africa, both of these phenomena usually occur during the summer and spring seasons when temperatures are high (Table 4.1), hence the significant concentration levels of PAHs in the atmosphere. During precipitation or wet deposition due to the availability of rain during these seasons, all the released PAHs are brought down again, increasing the occurrence of these pollutants in the water, soil and surface sediments. The results of the average pH shown in Section 4.3.1 indicated that the water in the Msunduzi River during this work was in the drinking water range, normally varying from 6 to 9.
Source Apportionment of PAHs in this Study
PAHs can be found in the environmental system due to different mechanisms such as post-depositional early diagenesis of biogenic precursors such as perylene, higher temperature pyrogenic processes or incomplete combustion of vegetation and fossil fuels, lower temperature diagenesis or petrogenesis for long periods of geological time (oil) products) (Meyers & Ishiwatari, 1993). The distribution of PAHs in the water, soil and sediment for autumn, winter, spring and summer seasons of the Msunduzi River is shown in the above tables. The PAH concentration levels were relatively high in the soil samples collected from the agricultural area for autumn, winter and summer seasons, while in the spring season it was higher in the samples collected from the Du Toit Viljoen Bridge sampling site.
In the surface sediment samples, higher concentration levels of PAHs were found in the samples collected from the agricultural area for autumn, winter and spring seasons, while they were found in the summer in the samples collected from the junction of the Msunduzi and Umgeni Rivers and the Nagle Dampersele, respectively. In this study, the ranges of the summed concentrations of the 7 PAHs are high in the soils, water and surface sediments during the spring season. The predominance of low and medium molecular weight PAHs in the surface sediments, soils and water of this study area reflects the presence of significant combustion products from low-temperature pyrolytic processes and/or petrogenic sources.
![Table 4.16 Calculated concentration ratio {[Anth]/([Anth]+[Phen]} for sediments and probable source of PAHs in the Msunduzi River](https://thumb-ap.123doks.com/thumbv2/pubpdfnet/10643816.0/137.1262.115.1064.181.581/table-calculated-concentration-sediments-probable-source-msunduzi-river.webp)
Conclusion
DRWTP inlet (summer 2014), CD and DuTV soils (spring 2015) also showed higher amounts of the concentrations of the PAHs studied in this work. Pyrene (PYR), phenanthrene (PHEN) and chrysene (CHRY) were the dominant individual PAHs in almost all seasons. Using PAH ratios, the calculated values in all seasons showed that approximately 70% of the PAHs examined come from petrogenic sources.
DWWTP showed a high sum of the concentrations of PAHs in wastewater during the autumn and winter seasons due to the fact that this treatment plant was under rehabilitation and expansion as well as the lack of rain during these seasons. According to the water quality information of the World Health Organization (WHO), the concentration levels of PAHs in the water should normally vary between 1000 and 11000 ng/L (Lewis, 2012). Almost all the current concentrations of PAHs in soils along the Msunduzi River are below the Catalan and Canadian permissible limits (see table 4.17), except that of PHEN (197.10 µg/g) found during the spring season at the DuTV Bridge sampling site.
Recommendations
Determination of the levels of polycyclic aromatic hydrocarbons in the toasted bread using gas chromatography-mass spectrometry. Polycyclic aromatic hydrocarbons (PAHs) in air and vegetation: A case study of three selected toll stations along north-south expressway in Johor, Malaysia (Doctoral dissertation, Universiti Tun Hussein Onn Malaysia). Distributions of polycyclic aromatic hydrocarbons in the surface waters, sediments and soils of Hangzhou City, China.
Determination of polycyclic aromatic hydrocarbons in water samples by solid phase extraction and gas chromatography. Comparison of extraction and purification techniques for the determination of polycyclic aromatic hydrocarbons in contaminated soil samples. Occurrence and source estimation of polycyclic aromatic hydrocarbons (PAHs) in surface waters of the Almendares River, Cuba.
Origin of polycyclic aromatic hydrocarbons (PAHs) in coastal marine sediments: case studies in the Cotonou2 (Benin) and Aquitaine (France) areas. Environmental assessment of polycyclic aromatic hydrocarbons (PAHs) in surface sediments of Santander Bay, northern Spain.