i
Effects of Foreign Aid in SADC Region:
A Case for Malawi
A Dissertation presented to
The Development Finance Centre (DEFIC) Graduate School of Business
University of Cape Town
In partial fulfilment
of the requirements for the Degree of Master of Commerce in Development Finance
By
Leah, Chalamba CHLLEA001
March, 2021
Supervisor: Associate Professor Abdul Latif Alhassan
University
of Cape
Town
The copyright of this thesis vests in the author. No quotation from it or information derived from it is to be published without full acknowledgement of the source.
The thesis is to be used for private study or non- commercial research purposes only.
Published by the University of Cape Town (UCT) in terms of the non-exclusive license granted to UCT by the author.
University
of Cape
Town
ii
PLAGIARISM DECLARATION
1. I know that plagiarism is wrong. Plagiarism means using another person`s work and pretend that it is one`s own.
2. I have used the American Psychological Association Format (APA 6) convention for citation and referencing. Each contribution to, and quotation in, this dissertation from the work of others people has been appropriately cited and referenced.
3. I certify that this dissertation is my own work.
4. I have not allowed, and will not allow, anyone to copy my work with the intention of passing it off as his or her own work.
5. I acknowledge that copying someone else`s assignment or essay, or part of it, is wrong, and I declare that this is my own work.
iii ABSTRACT
Most underdeveloped countries continue to receive Official Development Aid, and Malawi is not an exception. This research paper examined the effect of Official Development Aid on the Gross Domestic Product and Human Development Index in Malawi, using annual time series data from 1990 to 2018. In addition, the relationship of Gross Domestic Product, Human Development Index and Official Development Aid was analysed using cointegration, correlation and granger causality techniques.
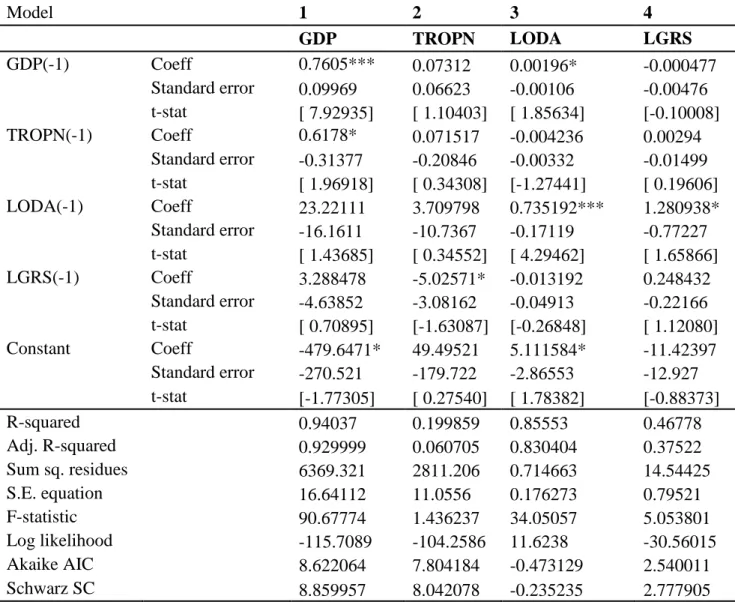
The results of cointegration indicated a short term relationship among the variables, hence the Vector Autoregressive (VAR) Model was used together with Ordinary Least Squares (OLS) to study the effect of Official Development Aid to Human Development Index and the effect of Official Development Aid to Gross Domestic Product. In the first VAR Model Equation, Gross Domestic Product was significantly positively influenced by Trade Openness and lagged value of Gross Domestic Product.
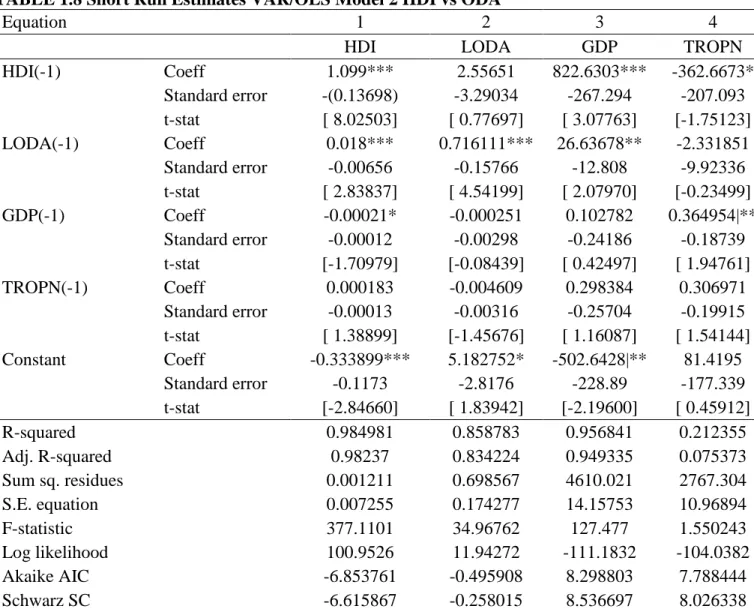
In the second VAR Model Equation, Official Development Aid and lagged value of Human Development Index were found to positively influence Human Development Index from 1990 to 2018. In addition, Official Development Aid showed significant influence to GDP. In summary, Official Development Aid showed significant positive influence to Human Development Index, while indicating varied results regarding influence to Gross Domestic Product. Findings suggest that policy makers in Malawi should gradually stop relying on donors, explore targeted foreign aid and think of other innovative ways like changing policies on trade openness and human development to boost the country’s GDP, among others.
iv
ACKNOWLEDGEMENTS
First of all, I would like to thank my supervisor Associate Professor Abdul Latif Alhassan for the guidance he gave me when I was working on this dissertation.
Secondly, I would like to thank my husband Mdziye Friday Kashoti Chalamba for his moral support during the time I was studying at GSB University of Cape Town till the time I finalised this dissertation. In addition, I want to thank my son Chisehwe Friday Chalamba and my daughter Wezi Chalamba for their understanding.
This dissertation is dedicated to my late father Dr Ronald Chananga Jaranthowa Mkandawire who kept on encouraging me when I was studying. A special thanks to my mother Myness Mkandawire and family for the support.
Lastly, I thank the Almighty God for making it possible for me to finalise my research paper.
v
TABLE OF CONTENTS
PLAGIARISM DECLARATION ... ii
ABSTRACT ... iii
ACKNOWLEDGEMENTS ... iv
TABLE OF CONTENTS ... v
LIST OF FIGURES ... vii
LIST OF TABLES ... viii
ACRONYMS ... ix
CHAPTER ONE: INTRODUCTION ... 1
1.1 Background of Study ... 1
1.2 Research Problem and Research Objectives ... 3
1.3 Research Objectives ... 5
1.4 Scope and Justification of the Study... 5
1.5 Organisation of the Study ... 5
CHAPTER TWO: LITERATURE REVIEW ... 6
2.1 Introduction ... 6
2.2 Definition of Terms and Concepts ... 6
2.3 Overview and Stylized Facts on Foreign aid in Malawi ... 7
2.3.1 Stylised Facts of HDI and GDP per Capita in Malawi ... 8
2.4 Theoretical Framework ... 10
2.4.1 Aid and Economic Growth ... 10
2.4.2 Aid and Human Development ... 11
2.5 Empirical Literature Review ... 11
2.5.1 Foreign Aid and Economic Growth. ... 11
2.5.2 Foreign Aid and Human Development ... 14
CHAPTER THREE: METHODOLOGY... 17
3.1 Introduction ... 17
3.2 Research Design ... 17
3.2.1 Data Period and Source ... 18
3.2.2 Regression Equations ... 18
vi
3.2.3 Variable Descriptions and Definitions ... 19
3.2.3.1 Dependent Variables ... 19
3.2.3.2 Independent Variable ... 20
3.2.3.3 Control Variables ... 20
3.2.4 Estimation Approach ... 21
3.2.4.1 Unit Root. ... 21
3.2.4.2 Cointegration ... 22
3.2.4.3 ARDL Bound Test and Johansen Cointegration Test ... 23
3.2.4.4 Testing for Causality ... 23
CHAPTER FOUR: RESULTS AND FINDINGS ... 25
4.1 Introduction ... 25
4.2 Descriptive Statistics ... 25
4.3 Unit Root Test Results ... 26
4.4 Correlation of ODA, HDI & GDP Results ... 26
4.5 Cointegration ... 27
4.6 Short-Run VAR (Vector Auto Regression Model) Regression Analysis ... 28
4.6.1 Short VAR: Model 1 (ODA and GDP) ... 28
4.6.2 Short VAR: Model 2 (ODA and HDI) ... 30
4.6.3 Residue Correlation Test ... 32
4.6.4 Granger Causality Test Results ... 33
CHAPTER FIVE: CONCLUSIONS AND RECOMMENDATIONS ... 35
5.1 Introduction ... 35
5.2 Summary and Conclusions ... 35
5.3 Policy and Recommendations. ... 37
5.4 Avenues for Future Studies ... 38
REFERENCES ... 39
vii LIST OF FIGURES
Fig 1.1 ODA (Current USD) SADC & Malawi 1990 – 2018 ... 8 Fig 1.2 Malawi GDP per Capital 1990 to 2018... 9
viii LIST OF TABLES
TABLE 1.1 Human Development Index (HDI) Malawi vs Least Developed Countries. ... 9
TABLE 1.2 Descriptive Statistics ... 25
TABLE 1.3 ADF Stationery Test Results ... 26
TABLE 1.4 Correlation of ODA, HDI & GDP... 27
TABLE 1.5 ARDL Bound Test Results ... 27
TABLE 1.6 Johansen Cointegration Test Results ... 28
TABLE 1.7 Short Run Estimates VAR /OLS Model 1 GDP vs ODA ... 30
TABLE 1.8 Short Run Estimates VAR/OLS Model 2 HDI vs ODA ... 32
TABLE 1.9 Breusch-Godfrey Serial Correlation LM Test: ... 32
TABLE 1.10 Granger Causality Tests in VAR GDP vs ODA, TROPN, GRS ... 33
TABLE 1.11 Granger Causality Test in VAR HDI vs ODA, TROPN & GDP ... 34
ix ACRONYMS
ADF Augmented Dickey - Fuller DAC Development Assistance Committee GDP Gross Domestic Product
GNI Gross National Income HDI Human Development Index MGD Millennium Development Goals MSME Micro Small Medium Enterprise.
ODA Official Development Aid/Official Development Assistance OECD Organisation for Economic Cooperation and Development OLS Ordinary Least Squares
SADC Southern Africa Development Community SDG Sustainable Development Goals
USD United States Dollar VAR Vector Autoregressive LDC Least Developed Countries IMF International Monetary Fund
UNDP United Nations Development Programme HIV Human Immunodeficiency Virus
GMM Generalised Method of Moments
1
CHAPTER ONE: INTRODUCTION
1.1 Background of Study
Malawi is a small economy country that had a GNI of $320 in 2016 (IMF, 2017). Malawi relies heavily on Agriculture which contributes up to one third of the country’s GDP. This means that agriculture performance is very key to the growth of the economy. Unfortunately, the agriculture sector in Malawi has been volatile because most farmers rely on rain fed farming (IMF, 2017). Due to reliance on rain fed agriculture, in 2001 the agriculture sector in Malawi lost US $ 161 million representing 4.3 percent of total agriculture production value. And in 2005, droughts caused loss of US $ 900 million which was 24% of total agriculture production based on 2006-2008 average (World Bank, 2016).
Economic growth in Malawi is affected by the agriculture sector. In 2013, Malawi had a GDP growth rate of 6.1 percent compared to 2012 due to positive growth in the agriculture and manufacturing sector (Ministry of Development Planning and Cooperation, 2014). In 2015, the agriculture sector contracted by 1.6% reducing GDP growth to 3.1 percent (Ministry of Finance and Economic Planning, 2016).
Then in 2018, the Real Gross Domestic product grew by 4.0 percent (Ministry of Finance, Economic Planning and Development, 2019)
In 2013, trade deficit for Malawi was US$1,364.9 million (f.o.b) representing an increase of 26.6 percent from 2012 deficit. The trade deficit had worsened between 2011 and 2013 (Ministry of Development Planning and Cooperation, 2014). In order to solve this problem of trade deficit, a Malawi Export Strategy 2013 to 2018 was approved to ensure Malawi strategizes on generating exports that should match the imports and allow export competitiveness and empowerment. This was one of the ways that would see Malawi graduate for the Least Developed Countries (Ministry of Trade, 2012).
Despite having an approved export strategy policy, the negative trade balance widened by 44% between 2016 and 2017 (Ministry of Finance and Economic Planning, 2019). Malawi should also take advantage of the regional blocks like Southern African Development Community(SADC). SADC has been a major source of imports from 2016. The African market is potential in terms of export diversification with SADC region being significant (Ministry of Finance and Economic Planning, 2019). On a positive note Malawi government approved the Micro, Small Medium Enterprise (MSME)
2
policy that could improve entrepreneurship, create jobs, encourage innovation and international competitiveness in February 2019 (Ministry of Finance and Economic Planning, 2019).
Malawi has high population density because the fertility rate is very high. Malawi has been affected by governance, political and climate related shocks (IMF, 2017). From 1966 to 2008, Malawi’s population grew from 4 million to 13.1 million and it is projected the population will reach 26 million by 2030 (NSO, 2012).
Poverty levels are still widespread in Malawi. The population of people living below the international poverty line (US $1.9 /day, 2011 PPP) was 69.6 percent in 2015 (World Bank, 2016). Despite the situation (IMF, 2017) reported that there was good progress in the non-monetary levels of poverty up to the extent that due to large flows of ODA, Malawi partially or fully achieved 4 out of 8 goals of Millennium Development Goals. Between 2004 and 2015 stunted growth reduced from 53% to 37%
and the number of deaths per 1000 births reduced from 133 to 64.
According to Hjertholm and White (1998) aid can be traced up to the nineteenth century. Donor focus of aid has evolved over the years. In 1940s donor focus was on reconstruction, in 1950s community development was the donors focus, between 1960s and 1990s donors focused on productive sectors, social sectors, macroeconomic reforms, poverty and governance. From 2000 the focus has been on Millennium Development Goals (MGDs), poverty reduction, ownership, health, water and education.
A lot of institutions were created after world war. The well-known post war institution is the Marshall plan that is seen as the model for development. Official Development Aid (ODA) between 1967 up to 1992 had a clear upward trend (Hjertholm and White, 1998)
Official Development Aid (ODA) is the type of aid that aims at promoting economic development and welfare of countries that are still developing (OECD, 2019). The gold standard that was adopted by DAC in 1969 is the main source for financing development aid. In addition, the document continues to inform that OECD figures have data that makes it easy to compare aid that is reported by 30 members of the Development Assistance Committee (DAC). Furthermore, there are also approximately 80 other providers of development cooperation and other Official Development Assistance. Sub Saharan countries are also included as recipients of Official Development Assistance (OECD, 2019).
Development Assistance Committee (DAC) is the specialized committee of OECD. DAC provides capacity and well-coordinated support so that donations from donors support development and
3
reduction of poverty in developing countries. Official Development Assistance (ODA) are flows to developing countries. DAC adopted the concept of ODA by separating ODA from other flows (Roeskau, 2006).
The debate on foreign aid is ongoing and there are a lot of papers that have been published. Researchers tend to have different outcomes. Collier (2006) supports foreign aid but needs the approach to change.
He explains that the reason why Africa is not developed despite receiving aid is because aid is not solving the main problems. He suggests aid to target improving corridors to land locked countries, aid to cushion countries with external shocks, post conflict countries, and to aid turnaround strategies on export break through. According to (Collier, 2006) these are some of the areas that have been ignored.
Following Collier`s proposal, if Malawi has Official Development Assistance that cushions external shocks and improves exports could this help?
On the other hand, Moyo (2009) wrote that aid is not working for Africa. According to (Moyo, 2009) Africa requires four options which are: following an example of Asian emerging market, learning from the Chinese policy of large investment in infrastructure, making sure they have a free trade in agriculture products, and lastly to encourage financial intermediation. Can Malawi survive without Official Development Aid?
Malawi still depends on Official Development Assistance (ODA). This has been the case since independence from British colonial rule in 1964 (OECD 2019). Despite receiving aid since independence, Malawi is still among the top ten poorest countries in Africa (Oishimaya, 2019). Malawi still receives Official Development Assistance but the percentage of this channelled through government reduced from 69 percent in 2009 to 30 percent in 2015. Its reported that Malawi government needs to look beyond Official Development Aid (ODA), increase domestic resource mobilisation in order to reduce aid dependency (World Bank 2016).
1.2 Research Problem and Research Objectives
Development aid aims at improving economic growth which can translate to human development in the recipient developing countries. Despite receiving development assistance, most Sub Saharan countries were yet to achieve the Millennium Development Goals that were transformed to the 17 Sustainable Development Goals as part of 2030 Agenda. A 2018 Sustainable Development Goals report states that maternal mortality rate in Sub Saharan Africa dropped by 35%, and under five
4
mortalities had dropped by 50%. However, HIV prevalence amongst reproductive age was 10 times the global average (United Nations, 2018). According to OECD (2008), Malawi received USD 669 Million of Official Development Assistance which was almost one-third of Malawi`s GNI. In the report it was stated that this makes it very important to find out if aid is effective in Malawi.
Dolley (2011) reported that in 2014, 40% of Malawi’s budget relied on donor aid. Similarly, Ngoma and Kouneva (2015) reported that 40% of Malawi`s budget was financed by development partners, and that ODA to Malawi from 2008 to 2012 amounted to USD 4.59 million. Net ODA averaged 21.1 percent of real GDP within the same period. As a researcher, the question that has not been answered successfully is why most Sub Saharan African countries are still least developed and still depend on foreign aid, despite receiving foreign assistance. Taking Malawi as a case study, it is noted that Malawi was rated as the 6th poorest country in the world (World Bank, 2018). This calls for a well balanced approach of analysing Malawi`s situation. By balanced approach, means analysing the effect of Official Development Aid to both economic growth and human development.
Macro-economic factors give a broader view of a situation. According to Andrews (2009), there are still few studies on effects of foreign aid to both macro and micro economic social factors. He stressed as an example that research on aid versus economic growth only are not enough to give a holistic picture in a particular country. It is important to look into human aspect as well in order to have a balanced view. With the introduction of Human Development Index by United Nations Development Programme (UNDP) in the 1990, research is now moving towards including more of the human aspect.
In a similar way, Simplice (2014) deviated from the norm of aid- development research and supported the idea of including adjusted Human Development Index in his study. According to Easterly (2005) his review indicated that aid towards education, health and water has shown good results. Education, and health are connected to human development. The purpose of this research is therefore to add on literature that studies relationships and effects of foreign aid to economic growth and human development in Malawi. It is important to have a holistic picture by looking into foreign aid in relation to human development and economic growth within a same study period. This will aid in getting an in-depth analysis of the situation on economic growth, access of knowledge, access to decent life and life expectancy in Malawi so that effectiveness of ODA in Malawi is analysed.
5 1.3 Research Objectives
The objectives of this research are:
1. To examine the effect of foreign aid on economic growth in Malawi.
2. To examine the effect of foreign aid on human development in Malawi.
3. To examine the relationship of Official Development Aid, human development and economic growth.
1.4 Scope and Justification of the Study
Bilateral and multilateral partners, donors, government officials, Civil Society Organisations(CSOs), various Non-Government Organisations (NGOs) and politicians will benefit from the outcome of this research because the results will add to their knowledge. The research is important because it will provide more information on the gap identified in the literature of adding empirical evidence of the effect of development aid to both economic growth and human development in Malawi. In this case, an analysis of the relationship of aid to economic growth and human development will be done within the same year by focusing on Malawi.
1.5 Organisation of the Study
The research paper is divided into five chapters of which chapter 1 is the introduction, chapter 2 is the literature review, chapter 3 is the methodology, chapter 4 is the results and findings and finally chapter 5 is the conclusion and recommendations.
Chapter 1 introduces the research paper and gives background. Research problem, and research objectives are all explained in this chapter. Chapter 2 consists of a literature review on human development and economic growth. The overview and stylised facts give some information on ODA, GDP and HDI. Theoretical frameworks of aid and economic growth, and aid and human development are also explained in this chapter.
Chapter 3 which is the methodology section gives details of the data, research design that provides details on regression equations, variable definitions and estimation techniques. After methodology section, chapter 4 is the section that explains the results and findings in line with the methodology section. Graphs and tables are included to explain the results. Chapter 5 is the last section in this research that has the conclusions and recommendations
6
CHAPTER TWO: LITERATURE REVIEW
2.1 Introduction
In this chapter, we start by definitions of a few terms and concepts. The stylised facts of Official Development Aid, Gross Domestic Product and Human Development Index will be reviewed, followed by theoretical frameworks on economic growth and human development. Literature review on Official Development Aid versus economic growth and Official Development aid versus human development will be in the last sections
2.2 Definition of Terms and Concepts
“The 17 Sustainable Development Goals and its 169 targets were part of the 2030 agenda that seek to build on the Millennium Development Goals to complete what these did not achieve. They are integrated and indivisible, balancing the three dimensions of sustainable development: thus economic, social, and environment” (SDG, 2015). Sustainable Development Goal 1 targets at reducing poverty.
Sustainable Development Goal 2 intentions are reducing hunger. Sustainable Development Goal 3 focuses on health and well-being, while as Sustainable Development Goal 4 objective is to achieve quality education for all. Finally, Sustainable Development Goal 5 focuses on gender equality, while Sustainable Development Goal 8 aims for decent work and economic growth (SDG,2015). As a researcher, there is an indication that, sustainable development goals 3,4, and 8 are more closely related to economic growth and human development.
GDP is measured as the total gross value added by all resident producers in any particular economy.
The change in GDP at constant price is used to measure the growth in an economy. An indicator GDP or GDP per capita in mostly used. In order to compare cross country information on social economic and other data the GDP per capital is used. In addition, Gross National Income (GNI) per capita is also used to measure growth in an economy. This is the sum of total domestic and foreign value added produced by residents that is then divided by total population. (https://data.worldbank.org/indicator)
Human Development Index (HDI) is a measurement of achievements for most key dimensions of human development. The most key measures include being able to have a decent standard of living, being knowledgeable, and having a long healthy life. The HDI not only focuses on income but other aspects like education and health as well. In addition, this helps define the complex concept of human development (UNDP, 1990).
7
As already explained in the introductory section, Official Development Assistance (ODA) is aid given by other government to support economic development and welfare of people in developing countries (OECD, 2019). As per the above definitions, it can be concluded that economic development and welfare of people are linked to Sustainable Development Goals 3,4,8, GDP indicators, and Human Development Index indicators. The more reason economic development and welfare of people needs to be analysed in line with ODA. The following section will look into the stylised facts of ODA, HDI, and GDP.
2.3 Overview and Stylized Facts on Foreign aid in Malawi
Southern African Development Community (SADC) was established in 1980 as a coordination conference then changed to development community. The objectives of SADC are development oriented and ensuring the people in southern Africa achieve economic development, alleviate poverty and many more through regional integration for the 16 member states (SADC, 2012).
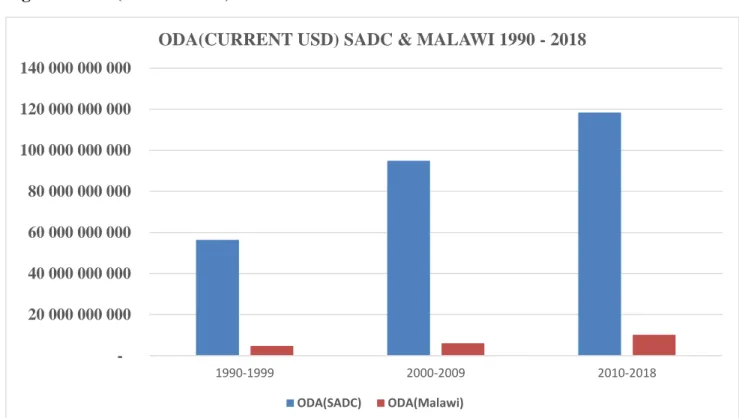
As per Fig (1.1) SADC region, including Malawi, is a beneficially of Official Development Aid. A cumulative total of USD 269 billion was transferred to SADC countries between 1990 to 2018. On the other hand, a total of 20 billion USD was transferred to Malawi between 1990 and 2018. The graph indicates that foreign aid transferred to the SADC region and Malawi between 1990 and 2018 has been increasing (Fig 1.1). Percentage of ODA transferred to Malawi ranges between 6% and 8% of SADC total during the period. This is an indication that Malawi and some other SADC member states are still receiving Official Development Aid from the developed nations. 8% of the aid came to Malawi and 92
% was shared among the other remaining member states.
8
Fig 1. 1 ODA (Current USD) SADC & Malawi 1990 – 2018
Source: Graph prepared from World Indicators figures (current USD).
https://data.worldbank.org/indicator/DT.ODA.ODAT.KD?locations=MW
2.3.1 Stylised Facts of HDI and GDP per Capita in Malawi
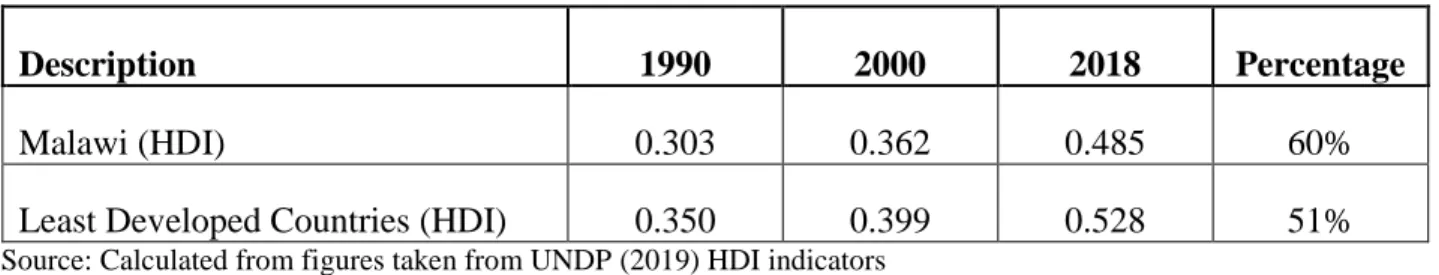
Table (1.1) shows the trend of the Human Development Index for Malawi compared to Least Developed Countries from 1990 to 2018. The HDI for Malawi increased by 60% between 1990 and 2018, while as the average HDI for Least Developed Countries increased by 51% between 1990 to 2018. According to UNDP (2019), the average annual percentage HDI growth for Malawi was 1.79%
for years (1990 - 2000) & 1.69% for years (1990 - 2018) compared to average annual growth of Least Developed Countries that was 1.30% for years (1990 - 2000) & 1.48% for years (1990 – 2018). This average annual growth was calculated as the annual compound growth rate. The figures give an indication that Malawi`s HDI average annual growth was higher than the average annual growth of Least Developed countries (UNDP,2019). If this trend continues with even higher growth percentages, Malawi would in the near future move out of this category of Least Developed Countries. According
- 20 000 000 000 40 000 000 000 60 000 000 000 80 000 000 000 100 000 000 000 120 000 000 000 140 000 000 000
1990-1999 2000-2009 2010-2018
ODA(CURRENT USD) SADC & MALAWI 1990 - 2018
ODA(SADC) ODA(Malawi)
9
to UNDP (2015) Malawi still has a long way to go in terms of human development. In 2014, the human development index of Malawi was 0.445 which is a lower figure compared to 0.518 an average of the Sub-Saharan Africa low human development group. Malawi was ranked 173 out of 189.
TABLE 1.1 Human Development Index (HDI) Malawi vs Least Developed Countries.
Description 1990 2000 2018 Percentage
Malawi (HDI) 0.303 0.362 0.485 60%
Least Developed Countries (HDI) 0.350 0.399 0.528 51%
Source: Calculated from figures taken from UNDP (2019) HDI indicators
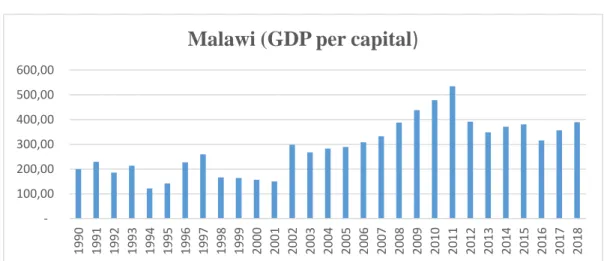
The GDP per capita for Malawi fluctuated between 1990 to 2018. GDP per capita reached the highest figure of 534.95 in 2011, and the lowest was 121.26 in 1994 (Fig 1.2). From 2012 to 2018 the graph indicates that GDP per capita has never gone beyond 534.95 being the 2011 GDP per capita. In addition, going up and down is an indication of a stagnant economic growth. This is mostly due to the adverse weather conditions since Malawi depends on Agriculture. For example, due to adverse weather conditions in 2015, the agriculture sector contracted by 1.6 percent. Since Malawi depends on agriculture, GDP growth went down to 3.1 percent in 2015 (Ministry of Economic Planning, 2016)
Fig 1.2 Malawi GDP per Capital 1990 to 2018
Source: Graph prepared by figures from World Development Indicators figures. https://data.worldbank.org -
100,00 200,00 300,00 400,00 500,00 600,00
1990 1991 1992 1993 1994 1995 1996 1997 1998 1999 2000 2001 2002 2003 2004 2005 2006 2007 2008 2009 2010 2011 2012 2013 2014 2015 2016 2017 2018
Malawi (GDP per capital)
10 2.4 Theoretical Framework
2.4.1 Aid and Economic Growth
There are several theories explaining the aid-economic growth nexus. Harold (1939) and Domar (1946) had their theory that foreign aid supported economic growth. In this theory they believed that aid will boost savings, then savings will increase investment which in the end will cause economic growth. Based on this theory, this paper is investigating if Official Development Aid influenced economic growth in Malawi between 1990 and 2018.
According to Harod (1939) and Domar (1946), foreign aid could cause an increase on direct savings and investment. Gross savings as a variable is also included in the research paper. The interaction and relationship of economic growth, gross savings and Official Development Aid will help in understanding the way they influenced each other.
Rosenstein-Rodan (1961) came up with their theory from Harrod-Domar growth model. The theory has assumptions that aid is an addition to aggregate stock of capital. They believed in a very big push in order to grow the economy.
Hansen and Tarp (2000) showed that aid led to increases in total savings in support of the model. On the other hand, Easterly (1997) asserts that the Harrod-Domar model has been used by economists in developing countries to calculate the financing gap between the required investment and available resources. According to Easterly (1997), there was no empirical evidence or theoretical evidence of justification of calculating the financing gap between investments and savings, despite being used by economists in developing countries.
Sometimes countries could try to improve on their status, but when they are trapped in poverty the story is always different. Agriculture sector in Malawi reinforces poverty traps because of cycles of shocks – recovery –shocks. Investors in this sector end up losing their surpluses in order to survive during periods of shocks (World Bank, 2016). Unfortunately, this is the situation for Malawi since it relies heavily on Agriculture in order to grow economically.
According to Sachs et al. (2004) by dating as far as 1798, Thomas Malthus`s work had economic ideas that poor countries can be stuck in poverty. As emphasized by Sachs et al. (2004) the three poverty- trap mechanisms built into the model have intellectual appeal but lack systematic empirical evidence.
11
These theories always change with time, but the good news is that they also help in explaining economic situations of different variables.
2.4.2 Aid and Human Development
Wetzel, C., Inglehart, R., and Klingemann, H.D. (2003) findings on theories to human development established that a coherent syndrome of social progress was constituted by socioeconomic development, emancipative changes in culture and democratization. And the syndrome is what is known as human development. In their analysis, social economic development gives people economic choice by increasing resources, demonstration indicates freedom of rights, and emancipative values strengthens subjective orientation towards choice.
The Human Development Index helps to measure or give a picture of some of the social economic factors explained above. By including the Human Development Index in the research means some of the issues related to human development theories have been considered. Upon investigating the interaction of Official Development Aid, Human Development Index and economic growth in this research paper we are able to learn more from these theories.
Asiama and Quartey (2009), in their methodology of analysing aid growth and welfare indicators, used reduced form of welfare indicators because human development theories were still in development stage. They mentioned Human Development Index and infant mortality rate. According to (Asiama &
Quartey, 2009) human development theories were still in their development stages meaning more will come.
2.5 Empirical Literature Review
2.5.1 Foreign Aid and Economic Growth.
The reviewed literature was done for countries in the Sub Saharan Africa which includes some countries in the Southern African Development Community region including Malawi. In the literature review, there are those that recommended that Official Development Aid supports economic growth and the others that recommend aid does not support economic growth. In addition, aid-growth nexus analysis was done by using gross foreign aid versus economic growth, by incorporating legal aspect, by splitting aid into bilateral and multilateral, by considering policies, by considering quality of institutions, by considering some
12
development aspects and tax. Furthermore, it was noted that Malawi being one of the Least Developed countries was mostly featured in group research paper and still having not enough specifically for Malawi. Research papers supporting the theory that foreign aid contributes to economic growth are explained in the following sections.
For example, one of the ways is that foreign aid versus economic growth has been analysed by using gross foreign aid versus economic growth. Arndt, C., Jones, S., and Tarp, F. (2010) in their study assert that foreign aid positively influences economic growth. Similarly, Juselius, K., Møller, N.F., and Tarp, F. (2014), using a well-specified cointegrated VAR model on long run effect of foreign aid on key macro-economic variables in 36 Sub Saharan African countries, realised that Official Development Aid had a positive effect on the macro economic variables. Malawi was one of the Sub- Saharan countries included in their research paper
In other cases, foreign aid is categorised. Minoiua and Reddyb (2010) analysed the impact of Official Development Assistance to developing countries. Aid was categorised as development aid and non- development. The GMM estimator was used on the data for period 1960 to 2000. Results demonstrated that developmental aid promotes long run growth. This is in line with the main objective of Official Development Aid.
Similarly, foreign aid was analysed as multilateral and bilateral. Khomba and Trew (2019) studied local impact of foreign aid to Malawi districts at project locations from 1993 to 2013. Findings showed that foreign aid does not stimulate sustained growth and that impact on growth peaked only after two to three years. In addition, bilateral aid was found causing growth in a better way than multilateral aid.
Lastly, aid distributed in form of grants had more impact than aid given in form of loans. For Malawi, a country that always has trade deficits, this makes sense in that they would struggle to pay back loans but if aid is in form of grants there would be no need of repayments, hence the grants help in replacing the deficits.
By incorporating legal aspects, (Wamboye, E., Adekola, A., & Sergi, B.S., 2013) using the dynamic framework and Generalised Method of Moments (GMM), examined the effectiveness of foreign aid to economic growth in a few selected African countries. Findings indicated that both quantity and quality of aid disbursed to least developing countries matter to economic growth, and that these differed based on the countries legal origin. Again, the research was about foreign aid versus economic growth with countries grouped in different legal systems, and was not country specific.
13
Ramesh, Norman and David (1998); Tang and Bundhoo (2017); Burnside and Dollar (2000) in their research of aid versus economic growth, also considered institutions quality, macro-economic policy environment, and trade policies just to mention a few. Ramesh, Norman and David (1998) assessed the impact of foreign aid to economic growth using a large sample. The augmented Fischer-Easterly type model was used. Malawi was included in the study. The results strongly support that foreign aid has some positive impact on growth, when there is stable macroeconomic policy environment.
Likewise, Tang and Bundhoo (2017) in their study of 10 largest aid recipients in Sub-Saharan countries over period of 1990 to 2012 concluded that aid promotes economic growth when the recipient countries have good policies, economic environment and good quality institutions. Malawi was part of the researched countries. Foreign aid was found to be a good supplement of investments and imports to the ten countries that were examined. This means in Malawi, foreign aid can enhance economic growth through investments and exports. Their model was derived from the basic neoclassical growth model developed by Solow. They believed that aid was conditional on political, economic and institutional environment. This according to Tang and Bundhoo (2017) explains why aid effectiveness is insignificant in the Sub Saharan Africa region. Finally, Burnside and Dollar (2000) examined the relationship among foreign aid, economic policies and growth of GDP per capita. The findings showed that in countries with good fiscal, monetary, and trade policies, aid had a positive impact on growth.
Chiumia and Simwaka (2012) examine the impact of aid and tax on economic growth in Malawi with data from 1970 to 2010. Studies showed that a decrease in tax burden could raise economic growth.
And also, a 10% increase in foreign grants increased economic growth by 0.3%. It means for the period of 1970 to 2010, grants promoted economic growth. In this case, economic growth was analysed in consideration of aid and tax. Result by Chiumia and Simwaka (2012) is in line with Khomba and Trew, (2019) since their results also showed that foreign aid in form of grants caused economic growth in Malawi.
On the other hand, there are studies that found negative relationship of foreign aid and economic growth. Liew, Mohamed and Mzee (2012) using pooled OLS, random effects and fixed effects examined the impact of foreign aid to economic growth in East African countries from 1985 to 2010.
The result was that foreign aid had a negative significant influence on economic growth.
14
In a related research for South Africa, the results showed that the relationship between aid and growth was negative both in the short run and in the long run. This was based on data from 1980 to 2009. Due to limitation of data, an autoregressive distributed lag (ARDL) was adopted (Leshoro, 2012). Finally, Mallik (2008) concluded that there was a negative relationship between foreign aid and economic growth in six poorest countries that included Malawi. The paper showed results that foreign aid did not improve economic growth in Malawi. Benedek, Crivelli, Gupta and Muthora (2012) also found a negative relationship of Official Development Assistance to grants and tax revenue to economic growth.
In the following case, research was not country specific. (Murshed, Mustari and Khanaum (2012 &
2013) states that foreign aid was not effective on growth and development. Aid has remained unsuccessful in achieving major objectives because of lack of predictability, increased conditionalities and absence of accountability, inter alias. (Murshed et al. (2012 & 2013) concluded that well targeted aid may increase the ability of poor countries to achieve economic growth.
Another negative result on aid is a country specific study. Tadesse (2011), using a multivariate cointegration method on data from 1970 to 2009, studied effectiveness of foreign aid to economic growth in Ethiopia. Foreign aid had a positive role in enhancing economic growth when entered alone.
On the other hand, a significant negative effect on growth was produced with the aid-policy interaction.
The overall effect of foreign aid on economic growth was negative due to lack of good policies.
As per reviewed literature on aid versus economic growth, there is positive and negative side of foreign aid in most Sub Saharan countries. In addition, the aid versus growth nexus was analysed by various researchers in view of various policies, institution quality, grouping aid, categorising aid, incorporating tax and legal aspect Inter alia. Finally, Malawi has been featured in group related research of Least Developed Countries and a few research papers on Malawi as a country.
2.5.2 Foreign Aid and Human Development
In a similar way to reviewed literature on aid and economic growth, aid and human development literature review was done for countries in the Sub Saharan Africa and Malawi. In the reviewed literature, there are those that recommend that aid improves human development when targeted. Other papers showed that when there is aid shock the human development and economy responded in different ways. In Malawi especially targeted aid produced good results. The following section gives more details on the foreign aid and human development.
15
Asiama and Quartey (2009) explain that human development theories are still in their developmental stage. The Human Development Index to some extent helps to give a picture on the micro analysis of the human development since its measure takes into account the economical, knowledge and most importantly the health of individuals in a country. This then made it another area of interest to research on. Just like the reviewed aid-growth nexus, studies have mostly concentrated on analysing only foreign aid-human development.
Amanda (2019); De and Becker (2015); Asiama and Quartey (2009); Simplice and Asongu (2014) examined the aid-human development. For example, Amanda (2019), after a desk top review of literature on Malawi for the period 2000 to 2015, observed that foreign aid has not significantly reduced poverty in Malawi. Major impact to donor effectiveness has been mismanagement of funds and corruption. Over emphasis of governance aid other than poverty alleviation aid had hindered progress on poverty alleviation in Malawi.
De and Becker (2015) in their study of impact of aid allocation to improving living standards in Malawi realised that there was a positive causal relationship of foreign aid on living standards. In their observation, foreign aid improves living standards when it is targeted towards solving a particular issue.
For example, health aid should target where there is a health problem, education aid should target where there are challenges to access education, and finally water aid can be targeted to places that have a lot of diarrhoea.
Asiama and Quartey (2009) in their study targeting the effects of foreign aid to indicators of welfare in Sub Saharan African countries, observed that bilateral aid did not show a significant effect on human development indicators and other welfare variables. On the other hand, disaggregated aid in sector and programme aid showed a significant effect of HDI. Since the data was finite, the GMM-SYSTEMS was the preferred method. OLS estimators was also used for comparison. Alternatively, Asongu (2014) assessed the aid -development nexus for 52 African development countries with a new indicator of human development, using updated data of 1996 to 2010. The General Methods of Moments System (GMMS) was preferred because data was finite. In addition, they also used Ordinary Least Square (OLS). The results indicated that developmental aid was detrimental to GDP growth, GDP per capital growth and inequality adjusted human development index.
Some research papers have analysed foreign aid with human development together with economic growth/development. For example, Gillanders (2010) studied the effect of aid on human development
16
and economic development on sample data 1973 to 2005 using PVAR model. Economic growth reacted better to aid shocks in a group of countries that had improved economic policies, poor institutions and high aid dependency. On the other hand, human development responded more to aid shocks in democracies and good institutional environments. Similarly, Arndt, Jones and Tarp (2014) also assessed long run effect of foreign aid to economic growth widened by indicators of social welfare and measures of economic transformation of foreign aid for 40 years. Results for the study period 1970 to 2007 show that aid contributed to economic growth. This was determined by physical capital accumulation and improving human capital, especially in education and health.
Alemayehu (2011) looked at the impact of foreign aid on human development by looking at infant mortality of 34 African countries from 1960 to 2005. They used time series data. The result yielded inconclusive results both directly and indirectly. According to them, this was due to data quality. Africa should invest in data quality.
In summary, human development-aid nexus has also been researched on by incorporating child mortality rates, measures of social welfare, bilateral aid, disaggregated aid, policies, and quality of institution. As indicated at the beginning, Human Development Index was introduced back in 1990 by UNDP hence has generated more interest amongst researchers. The results for Malawi have shown that targeted aid especially related to education, health and water has produced good results. In addition, the literature reviewed on human development shows there are still not enough country specific studies on human development versus aid for Malawi as a country.
To conclude, based on the literature reviewed on aid versus economic growth and aid versus human development, the results have been positive as well as negative in both cases. In addition, there are few country specific research papers for Malawi that researched on aid versus economic growth and those of aid versus human development. This research paper, will therefore, add on the literature and empirical evidence on the relationship of aid versus economic growth, and aid versus human development in Malawi in order to analyse the effectiveness of aid.
The other motivating factor is that the analysis of foreign aid versus economic growth, and aid versus human development index for Malawi will be done within the same period. Malawi has been included in quite a number of research papers that have targeted a group of Sub Saharan African countries as per reviewed literature. The reviewed literature then confirms a gap of additional research purely for Malawi.
17
CHAPTER THREE: METHODOLOGY
3.1 Introduction
This research paper analysed the effects of Official Development Aid (ODA) to Human Development Index (HDI) and Gross Domestic Product (GDP) in Malawi as well as investigating the relationships among ODA, GDP, HDI, trade openness, and gross savings. Learning from past theories and previous research papers further analysis was done specifically for Malawi in order to understand the effects of ODA towards GDP and HDI. The quantitative research method was used hence this involved getting data related to ODA, GDP, HDI, trade openness, and gross savings from different sources. This is secondary data that has already been compiled and not analysed. The advantage with this data is that it cannot be manipulated. Longitudinal approach was used to analyse data from 1990 to 2018. The time series data was analysed in the statistical package and results were interpreted.
The following section explains research design, data period and sources, regression equation by specifying independent and dependent variables, variable description and definition, and estimation approach in detail. This section explains the how and the why of the research methodology.
3.2 Research Design
This involved getting secondary data of ODA, GDP, HDI, trade openness, and gross savings from various websites, testing for suitability of data, deciding on the period, ensuring data is not manipulated, and finally using E views 11 a statistical package to analyse data and getting the results. In short, quantitative research method was used. According to Creswell (2002) quantitative research uses mathematical models for data analysis. It includes research design, test and measurement procedures, and statistical analysis. Data collection and inquiry methods are used in quantitative research method to ensure alignment with statistical data collection methodology. Therefore, this means that quantitative research uses figures that are easy to read and interpret. In this research paper, life was made easier when reading and interpreting data because information was in either form of graphs, lists and tables. Rahman (2017) asserts that quantitative research method has advantages and disadvantages.
One of the advantages they found was that quantitative method does not require a lot of time for data collection hence saving time while the disadvantage is that the method takes a snapshot of a phenomenon that is not in-depth. Advantage with what happened is that all information was obtained via internet, did not require questionnaires or surveys which can be time consuming sometimes. As
18
explained by (Rahman, 2017) the shortfall with this method is the rigidity of data, it was difficult to get the exact information as desired.
3.2.1 Data Period and Source
ODA, GDP, HDI, trade openness and gross savings were analysed with data from 1990 to 2018 which is the period under review. Official Development Aid information is available on World Bank data bank from 1960 to 2018. ODA from 1990 to 2018 was extracted out to be in line with the research period. GDP per capital data is available on World Bank national statistics data and OECD national statistics data. The website has information for Malawi and other countries. GDP per capita from 1990 to 2018 was taken from the website. Human Development Index from UNDP data information was extracted from 1990 to 2018. The source of information for all other variables like trade openness and gross savings is also from the World Development Indicators.
3.2.2 Regression Equations
Ordinary Least Squares and VAR regression was used for analysis of the two models. The independent variable analysed and used in both equations (Model 1 and Model 2) is the Official Development Aid received in Malawi. Dependent variable analysed and used in the first equation Model 1 is Gross Domestic Product per capita. Dependent variable analysed and used in the second equation Model 2 is the Human Development Index (HDI). In addition, the control variables analysed and used in the aid versus economic growth (Model 1) are trade openness and gross savings and control variables for the aid versus human development (Model 2) are Gross Domestic Product per capital and trade openness.
Equation (1) that was analysed in Model 1 consisted of Gross Domestic Product as a dependent variable, and independent variables are lagged value of Gross Domestic Product, lagged value of Official Development aid, lagged value of trade openness and lagged value of gross savings.
Model 1 - GDP equation 1
𝑮𝑫𝑷𝒕 = 𝜷𝟎+ 𝜷𝟐𝟏 𝑮𝑫𝑷𝒕−𝟏+ 𝜷𝟑𝟏 𝑶𝑫𝑨𝒕−𝟏+ 𝜷𝟒𝟏𝑻𝑹𝑶𝑷𝑵𝒕−𝟏+ 𝜷𝟓𝟏𝑮𝑹𝑺𝒕−𝟏+ 𝝁𝒕.…1
19
where GDP= Gross Domestic Product, ODA = Official Development Assistance, TROPN =Trade openness, GRS = Gross savings, β0 = Constant, 𝜇𝑡= Innovations
Equation (2) that was analysed in Model 2 consisted of Human Development Index as a dependent variable, and independent variables are lagged value of Human Development Index, lagged value of Official Development Aid, lagged value of trade openness and lagged value of Gross Domestic Product.
Model 2 – HDI equation 1
𝑯𝑫𝑰𝒕 = 𝜷𝟎+ 𝜷𝟐𝟏𝑯𝑫𝑰𝒕−𝟏 + 𝜷𝟑𝟏𝑶𝑫𝑨𝒕−𝟏+ 𝜷𝟒𝟏𝑻𝑹𝑶𝑷𝑵𝒕−𝟏+ 𝜷𝟓𝟏𝑮𝑫𝑷 + 𝝁𝒕.…2
where GDP = Gross Domestic Product, ODA= Official Development Aid, TROPN =Trade openness, HDI = Human Development Index, β0 = Constant, Constant, 𝜇𝑡 = Innovations
According to Onder (2006), Multiple Regression is used to assess relationships between a dependent variable and two or more predictor variables. This method has several advantages. The multiple regression analysis is a statistical procedure that is widely accepted in predicting the relationship among different variables. In addition, the results are easy to interpret and provides substantive information due to its multivariate nature.
3.2.3 Variable Descriptions and Definitions 3.2.3.1 Dependent Variables
Gross Domestic Product(GDP) is measured as the total gross value added by all resident producers
in any particular economy. The change in GDP at constant price is used to measure the growth in an economy (https://data.worldbank.org/indicator). As analysed in the literature review, GDP being a widely used indicator has been featured in a lot of studies hence the usage of GDP in this research paper.
Human Development Index (HDI) is a measurement of achievements for most key dimensions of human development. The measures are having a healthy life that is long, being knowledgeable and being able to have a standard decent life (UNDP, 1990). Human Development Index will help in analysing the human side effect of aid hence very important economic variable. There are still a few studies on effect of aid on Human Development Index in Malawi
20 3.2.3.2 Independent Variable
ODA received in Malawi for 28 years (1990 to 2018) is the independent variable. ODA- Official Development Assistance are flows to developing countries (Roeskau, 2006). Malawi being a Least Developed Country relies on ODA, and it is important to find out if there is aid effectiveness to growth of the economy and development of people.
3.2.3.3 Control Variables
Asmita, Fitrawaty and Ruslan (2017) in their analysis of factors that affect Human Development Index noted that increasing expenditures or improving indicators in the health and education sectors have a positive impact on the Human Development Index. This, therefore, means that increase in Gross Domestic Products can possibly cause improvement in Human Development Index hence the usage of GDP as a control variable on Model 2 Equation 1. For example, Ranis (2014) stated that human development will have an important effect on growth. This is only when it is to the extent that competencies and freedom improve economic performance. Similarly, it is believed that economic growth can enhance human development to the extent that income that is increased will cause an increase to the range of selections and capabilities by government and various households.
Trade openness has been used in various research papers that are connected to Human Development Index and Gross Domestic Products. Kabadayı (2013) analysed the effect of trade openness on Human Development Index hence the inclusion of the control variable in the Model 2 Equation No 1 in order to find out if Malawi will have similar results to this research.
Official Development Assistance affects economic growth, and this can be proved by evidence of an array of research papers on the aid-growth nexus. Apart from aid, there are other factors that affect economic growth. Chirwa and Odhiambo (2016) explains that economic growth is affected by aid, foreign investment, fiscal policy, investment, trade, monetary policies and financial factors. In this research, therefore, the control variables analysed for the development aid versus growth in Model 1 Equation No. 1 are gross savings and trade openness.
21 3.2.4 Estimation Approach
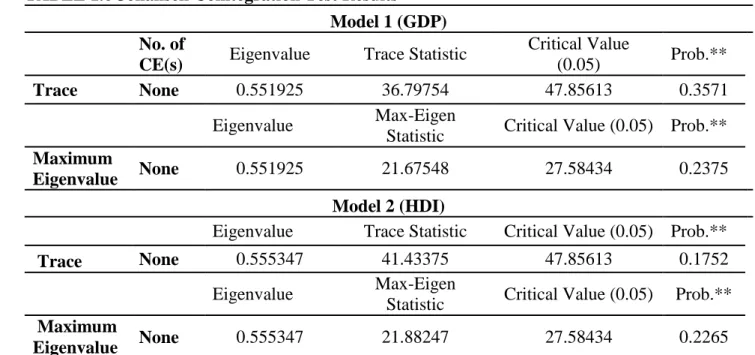
This sections explains how data was analysed. Analysis of data is in line with the quantitative method of research that requires data to be analysed so that results are produced. One thing that requires explanation is that in order to show reliability of the results on cointegration, two tests were used thus ARDL Bound test and the Johnsen cointegration test.
Unit Root tests, ARDL Bound test and Johansen Cointegration test were used to check cointegration and Granger Causality tests checked the causality among the variables. In addition, analysis also included running two short run VAR/OLS regressions in order to find out if ODA and some control variables affects GDP and HDI. After running regression analysis, LM normality test was done as part of diagnostic checks.
Lastly, relationship among ODA, GDP, HDI, GRS and TROPN was analysed by getting results from Granger Causality test and descriptive statistics which according to Larson (2006) explain the dispersion, location and shape of data. In addition, running correlation matrix analysis was done.
Mukaka (2012) explains that correlation is a statistical term that assesses a possible linear association between two variables. The ranges are from +1 perfect positive correlation to 0 which means no correlation up to -1 a perfect negative correlation.
3.2.4.1 Unit Root.
Unit Root test was done on the time series to check for stochastic trends and unit roots. Granger and Newbold (1974) discovered that macroeconomic data has stochastic trends and that this data is characterised by unit root which would lead to spurious regressions. Trended series are called non- stationarity with unit root. On the other hand, non-trended series are stationery without unit root. Time series data can be stationery as well as non-stationery.
Unit Root tests can be done using methods like Dickkey Fuller Test (1979), Augmented Dickkey Fuller (1981), and Philip-Perron (1988). Dickey Fuller or Augmented Dickey Fuller tests are mostly used methods for testing stationarity time series (Nkoro & Uko, 2016).
Mushtaq (2011) asserts testing for stationarity can be informal by using charts and diagrams, as well as formal by using Dicky- Fullers Test or Augmented Dicky Fullers Test. Getting some notes from
22
Banerjee, Dolado, Galbraith, and Hendry (1993) ADF Test will be used to test the null hypothesises of unit root. The null hypothesis and the alternative hypotheses will be stated as follows:
Ho: P = 1 representing non stationarity
H1: P < 1 representing that time series is stationery.
In addition, the t statistics to be used will be based on the 1979 Dicky and Fuller calculated t statistics.
In this research, Augmented Dicky Fullers Test was used to confirm if time series were stationery at either level 0 or level 1.
3.2.4.2 Cointegration
To achieve stationarity, unit roots test is needed in order to determine the number of times a variable or series will be differenced. Based on the result of root test, the definition of integration states that:
A variable Y is confirmed to be integrated of order d, I(d) if its stationarity was reached after differencing d times (Engle & Granger, 1987). After unit root testing, cointegration can be done using various methods, for example by the two-step approach (Engle- Granger 1987; Johansen 1988), and ARDL (Auto Regressive Distributed Lag).
Cañal-Fernández and Fernández (2018) used ARDL (Autoregressive Distributed Lag) bound approach to test long-run cointegration, Error Correction Model(ECM) to examine short term dynamics, while as causal relationships were tested using Granger Causality. In this research, the ARDL (Auto Regressive Distributed Lag) bound test approach was used to test for cointegration among the variables due to the advantages analysed in the following section.
Pesaran (1997); Pesaran and Shin (1999); Pesaran et al. (2001) developed the ARDL approach. This approach is sometimes preferred than other methods because of several advantages. For example, Johansen technique requires that all variables are cointegrated at the equal order of integration while the ARDL can be used even when variables are integrated at order one, and zero. In addition, ARDL can even be used with small fine sample, unlike Johnsen Cointegration technique that requires a larger sample for good results (Cañal-Fernández & Fernandez, 2018). Even though Johansen Cointegration test tends to favour larger samples, the test was also conducted in order to compare the results to ARDL bound test. This was to give more credibility to the results. Johnsen Cointegration test determine if three or more variables are cointegrated. The good news is that Maximum Likelihood Estimate (MLE) approach is used in testing the validity of cointegration in Johansen Cointegration test (Wee & Tan, 1997).
23
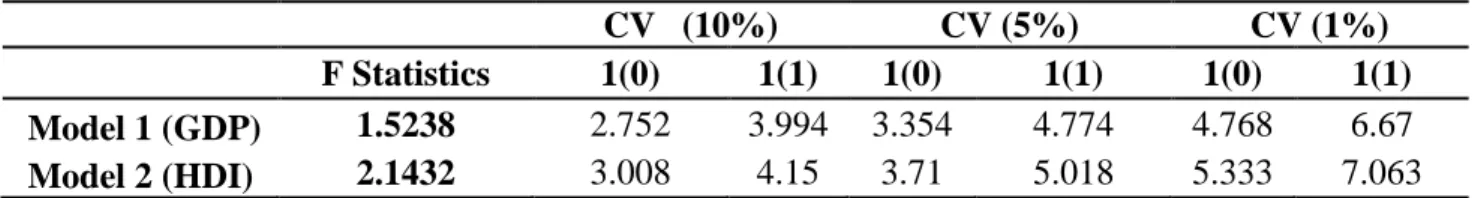
3.2.4.3 ARDL Bound Test and Johansen Cointegration Test
According to Nyasha and Odhiambo (2015) in cointegration testing, lower and upper bounds was established. F statistics was established. And if F statistics is above upper bound level, the null hypothesis of cointegration will be rejected, meaning variables in the question are cointegrated. On the other hand, if the F statistics is below the lower bound level, then the null hypothesis is accepted:
indicating no cointegration. If the F statistics is between the upper and lower boundary level, then the results become inconclusive.
Cointegration test for this research was conducted in EVIEWS 11 by using the ARDL Bound test and Johansen Cointegration test in order to find out if there was cointegration among the time series. The F statistics was analysed to find out if it was either below or above the lower and upper boundaries for ARDL and the Trace and Max – Eigen was analysed in the Johansen Cointegration test. Deciding on whether to run-long run and short-run regressions depends on the results from cointegration tests carried out.
Since there was no cointegration in all the test results, the Vector Autoregressive(VAR) Model was used in the regression analysis. Stock and Wats (2001) describes the VAR Model as an equation in which each variable is explained by its own lagged values, plus lagged values of other related variables.
The VAR Model is easy to use and to interpret. On the other hand, it is inherently difficult because it requires differentiation between correlation and causation as jargon of econometrics.
3.2.4.4 Testing for Causality
Granger Causality in the VAR Model is used in investigating relationships among different types of variables. It is a very useful tool that is used in analysing relationship between time series. The time series is said to have a causal effect on the other time series once it is discovered that the prediction of the other time series has improved because of incorporating it to the other time series. For example, Granger said a variable x Granger causes variable y if the lagged values of x are helpful for improving forecast of y (Y at future times). In other words, the null hypothesis can state that x does not Granger cause y. This null hypothesis is rejected when the coefficient of lagged value of x are significant (Granger, 1969). According to (Bose, Hravnak & Sereika, 2017) the VAR framework is flexible and that it provides an environment that allows this type of analysis.
24
Therefore, Granger Causality test was conducted using EVIEWS 11 to test if there is some Granger Causality among the variables. In order to analyse and understand the variables a bit further, correlation analysis was also done. Based on the above laid methodology, results were taken and interpreted. In the following chapter, results and findings will be given then followed by recommendations.
25
CHAPTER FOUR: RESULTS AND FINDINGS 4.1 Introduction
In this chapter, results of the analysis are explained in line with the methodology presented earlier. It covers the discussion of the descriptive statistics, unit root test, the Augmented Dicky Fuller (ADF) results, ARDL Bound test results, Johansen Cointegration test, and VAR short-run regression analysis results with emphasis for the two equations, LM Normality test, correlation matrix and Granger Causality analysis.
4.2 Descriptive Statistics
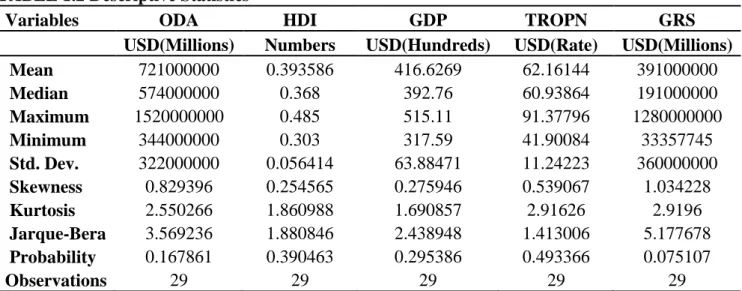
Table 1.2 shows that HDI, GDP & TROPN skewness ranges between 0.2 and 0.5, which means they are symmetrical around their means while skewness of GRS and ODA ranges between 0.8 and 1, indicating that they are moderately skewed. Kurtosis of all the variables is less than 3 and said to be platykurtic, meaning it produces fewer and less extreme outliers than the normal distribution. Lastly, the probability of Jarque-bera is above 0.05 % indicating data for all the variables is at least normally distributed.
TABLE 1.2 Descriptive Statistics
Variables ODA HDI GDP TROPN GRS
USD(Millions) Numbers USD(Hundreds) USD(Rate) USD(Millions) Mean 721000000 0.393586 416.6269 62.16144 391000000
Median 574000000 0.368 392.76 60.93864 191000000
Maximum 1520000000 0.485 515.11 91.37796 1280000000
Minimum 344000000 0.303 317.59 41.90084 33357745
Std. Dev. 322000000 0.056414 63.88471 11.24223 360000000 Skewness 0.829396 0.254565 0.275946 0.539067 1.034228 Kurtosis 2.550266 1.860988 1.690857 2.91626 2.9196 Jarque-Bera 3.569236 1.880846 2.438948 1.413006 5.177678 Probability 0.167861 0.390463 0.295386 0.493366 0.075107
Observations 29 29 29 29 29
NOTE: ODA=Official development assistance; HDI=Human development index; GDP=Gross domestic product;
TROPN=Trade Openness; GRS=Gross savings;
26 4.3 Unit Root Test Results
The ADF stationary results is presented in Table 1.3. All the variables (ODA, HDI, GDP, TROPN and GRS) are observed to stationery at 1st difference. In addition, stationarity test was conducted at critical values 1%, 5% and 10%. As per Table 1.3, there was no stationarity at levels because at level 1(0) the t statistic was below the critical values of 1%, 5% and 10% for all the variables. Stationarity for all the variables was achieved at 1st difference indicated as 1(1). At this level, the t statistic was above all critical values of 1%, 5% and 10%.
TABLE 1.3 ADF Stationery Test Results
Variables t statistic I(1) & I(0) CV (10%) CV (5%) CV (1%)
ODA -8.197159 1(1) -3.22923 -3.58753 -4.33933
0.599073 1(0) -3.69987 -2.97626 -2.62742
HDI -4.730791 1(1) -3.22923 -3.58753 -4.33933
-0.371561 1(0) -3.69987 -2.97626 -2.62742
GDP -6.641321 1(1) -3.22923 -3.58753 -4.33933
-0.035185 1(0) -3.69987 -2.97626 -2.62742
TROPN -7.584708 1(1) -3.22923 -3.58753 -4.33933
-0.416826 1(0) -2.65015 -1.95338 -1.6098
GRS -4.882209 1(1) -3.22923 -3.58753 -4.33933
-2.11589 1(0) -3.69987 -2.97626 -2.62742
Note: ODA=Official development assistance; HDI=Human development index; GDP=Gross domestic product;
TROPN=Trade Openness; GRS=Gross savings; CV= Critical value; I (0) = at level; I (1) = Rejected at 1st difference
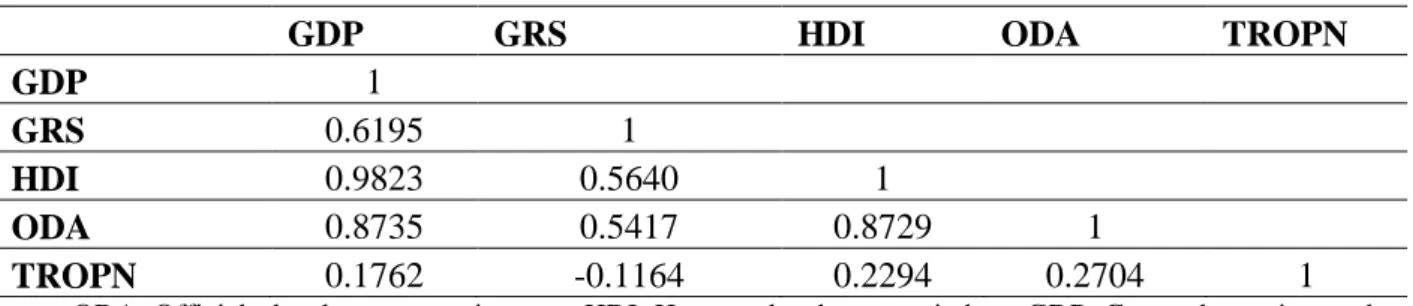
4.4 Correlation of ODA, HDI & GDP Results
The objective of the third research question is to analyse the relationship among ODA, HDI and GDP.
However, in the matrix (Table 1.4) variables TROPN and GRS have been included in order to have a broader view. In general terms, HDI and GDP are highly correlated at 98%, and seems to move in the same positive direction. These are the dependent variables in the two equations, respectively. This demonstrate that during the periods that GDP was increasing the Human Development Index was also increasing. Actually this is what happened during the period. In the stylised facts section, figure (1.2) GDP per capital had an upward trend from 2003 to 2011 and this is the same with HDI. As per UNDP (2019) Human Development Index was increasing annually at an average rate of 1.69 percent from 2000 to 2018. This is a revelation that it is important to have continuous economic growth so that the livelihoods of people improve