International Journal of Applied Business and Economic Research
ISSN : 0972-7302
available at http: www.serialsjournals.com
© Serials Publications Pvt. Ltd.
Volume 15 • Number 25 • 2017
The Effect of Foreign Direct Investment on Economic Growth, Carbon
Emission, and Social Welfare: A Cross-country Study
Suyanto
1and Aluisius Hery Pratono
21 Faculty of Business and Economics, Universitas Surabaya, E-mail: [email protected]; [email protected]
Abstract: The impacts of Foreign Direct Investment (FDI) on host countries have been highly debated in the literature. This study contributes to this debate by focusing on the impacts of FDI on economic growth, carbon emission, and social security spending. Utilizing the panel data of 120 countries during 2006-2009, this study found that FDI plays a pivotal role in fostering economic growth of the host countries and it has a significant effect on the addition of carbon emission. However, the initiative to develop quality of life is not a key element yet in FDI.
Key Words: Foreign direct investment, economic growth, carbon emission, social security spending. JEL Classification Numbers: F21, O44, O47.
INTRODUCTION
There has been an increasing debate on the role of foreign direct investment and multinational corporations on host countries development over the last three decades. The debate goes around two issues, which is discussed by Russ (2009) as two distinguished FDI models. The first model is defined according to Markusen (2002) that small capital flows to developing countries related to the scarcity in the supply of skilled labors. The second approach, which is in line with Richardian argument, claims that capital flows is a conceptual starting point triggered by excess labor supply.
Based on these two sets of models, Fukao and Wei (2008) classify FDI into two categories, that is vertical FDI and horizontal FDI. The vertical FDI refers to the initiative of intra firm vertical division of labor, while the horizontal FDI is the ability to gain access to local markets. These two models relate FDI to the growth of the host countries.
countries (Alfaro et al., 2004; Khaliq and Noy, 2007), some others provide a negative significant effect (Kawai, 1994; Djankov and Hoekman, 1999; Mencinger, 2003), and the rest shows no long-run effect (Ray, 2012). This mixed evidence indicates that the effect of FDI and economic growth varies across countries. The study on a specific country might not answer the question on the effect of FDI on economic growth. Therefore, a cross-country study with a panel data is required in an advantage to show the general average effect for all observed countries.
Accordingly, the environmental impacts of FDI on developing countries have been a concern of the governments. On the one hand, it is argued that FDI devastates environment of developing countries on account of lower environmental standards and “pollution havens” (Ravesz, 1992; Zarsky, 1997) On the other hand, foreign firms come up with promises to improve environmental performance by transferring both cleaner technology and management expertise in controlling environmental impacts (Letchumanan and Kodama, 2000; Ralston, 2010).
The ISO 14000 standards set target indicators to guarantee the sustainable management of forests and environmental management of production processes. Even though 60% of FDI in Latin America managed in agreement with this procedure, there are double standards in implementation. For example, there are two standards of environmental management in Chile that is international certification FSC and the domestic certification scheme CERTFO (Borregaard et al., 2008). This issue becomes an important concern for the government as well as the environmental institutions.
The effect of FDI on social welfare is another hot issue in literature. FDI is believed providing a positive effect on the host economy in aggregate. However, the impact on the worker welfare remains a matter of debate (Herman et al., 2005). Whether the existence of FDI on a host country increases the social welfare of the local workers is hardly justified.
In a spirit to answer the three issues above, the recent study address the following research question: “to what extend that the interest of foreign direct investment is associated with the initiative to foster local economic growth, to nurture environmental movement, and to promote social protection policy?”. To answer this research question, three models are applied. The first model is to address the impact of FDI on economic growth, the second model is on the effect of FDI on carbon pollution, and the third model is focused on the impact of FDI on promoting social protection policies.
This paper proceeds as follows. The following section provides literature reviews on the effect of FDI on economic growth, environment, and social security policies. It is followed by the models. Section 4 discusses the data and variables and section 5 presents the estimation results and analysis. The last section concludes the findings.
METHODS 1. Analytical Models
of FDI on economic growth using time series data (Alfaro et al., 2004; Khaliq and Noy, 2007). It focuses on a country specific and uniqueness. The third group, which is the most recent, evaluates cross-countries data to find out a general pattern of the effect of FDI on growth (Borensztein et al., 1998; Zhang, 2006; Wang, 2009). The advantage of the third group is the utilization of panel data that allow for identification of general pattern within a certain time horizon. The combination of cross-section and time-series data allows researchers to answer a question on the common pattern of FDI effect on economic growth.
This recent study follows the third group of literature, but develops a new empirical model based on Turckan et al.’s (2008) theoretical model. The main advantage of the new model is that it takes into account the capital accumulation, depreciation, and foreign direct investment (FDI). The conventional growth model represents FDI under Solow residual, which has no separation of FDI from other technological factors. In the new model developed in this study, FDI is treated as an exogenous variable affecting economic growth.
The Turckan et al. (2008) model is developed under an open economy where capital move freely between border. Domestic and foreign capitals are assumed to be perfectly substitutes for other factor productions with the same rate of return, r, the world interest rate. While k represents domestic capital per person and k* is a symbol for foreign capital per person, then (k* - k) represents total foreign investment in host countries. The model assumes an economy with immobile labor and abundant foreign invest tment, which is indicated by k* – k > 0. Then, budget constraint for the represented economy is
( )
k w r n k c�� � � � (1)
where k is domestic capital per person, w is real wage rate, r is the world real interest rate, n is population growth rate, c is the consumption, and a dot on top of variable indicates a time derivative of the variable.
Suppose that the production technology is represented by
Y = f(K*, N) (2)
in which Y output, K* is total physical stock available in the domestic economy, and N is labor stock. Hence the optimization condition for representative firm indicates equality between marginal product and factor prices:
f’(k*) = r (3)
f(k*) – k* f’(k*) = w (4) Turckan substitutes w from equation (4) into equation (1) and use equation (3) to determine the change in asset per capita, and therefore, equation (1) can be rewritten as:
FDI = f(gy, M) (7) M represents vector variables next to the growth rate of domestic economy that contributes to the determination of FDI, and gy is the growth rate of the country.
Furthermore, under Equation (6), one might expected that FDI affects growth through the accumulation of capital. Hence, the empirical model derived from the theoretical model of Turckan is as follows:
y = f(FDI, ODA) (8)
The equation above shows that the growth rate of an economy (y) is determined by foreign capital inflows in terms of Foreign Direct Investment (FDI) and Official Development Assistance (ODA).
If it is assumed that Equation (8) is linear and applied to panel data, then the following equation is formulized:
0 1 2
it it it it
y � �� � FDI �� ODA �� (9) where y is economic growth, FDI is foreign direct investment, ODA is official development assistance, �0, �1, �2 are parameter to be estimated, i represents the i-th country, t represent t-th time, and � is error term. In analyzing the impact of FDI on environment, the concepts of CSR and the pollution haven are put forward. Both profit interest and risk management have risen biased on CSR doctrines based on mistaken presumptions about recent economic developments. Henderson (2009) identifies that mistaken presumption of enterprises would make the world poorer and more over-regulated due to poor of standard regulations. Ralston (2010) argues that aligning the organization culture with existing local social norms and expectations can improve the capacity of organization to become more socially responsible. Thereafter, the most powerful way to create social value is by developing a new mean to address social problems and putting the best practices into widespread practice. It is the role of Chief Executive Officer (CEO) leadership to deserve sustainable development, as Waldman et al. (2004) mention that CSR activities are most likely to be related to the firm’s corporate and business-level strategies. Unless multinational company forces community and local government to deal with potential issue, the role of business seems never go beyond philanthropy and toward sustainable community development.
Seelos (2004) shows that the experimenting with unfocused CSR often is a zero sum game for society, and CSR without an explicit social compliance framework is lack credibility. It appears that participation in social corporate social responsibility program is not merely a question of rational choosing the right decision in value-free manner, as Berkhout et al (2003) explore contest between competing interests in public policy. While difficult issue rise, such as balancing conflicting stakeholder interests and measuring return to strategic CSR, it needs theory of how balance of tradeoff inherent in serving the various corporate constituencies (Lantos, 2001). The equilibrium has to be reaching a conclusive consensus is often very difficult to be achieved (Waddock, 2004) as different fields of interest (from business ethics to marketing management) cross paths (Bhattacharyya, 2010).
hold their government accountable, provide incentive for long-term investment, and promote the sustainable use of natural resources (Wydick, 2008). Moreover, most of the labor force is employed by small- and medium- enterprises instead of multinational corporations (Kunt and Levine, 2009). London (2010) argues that motivation, strategies, and persistence turn have practical value for corporate social responsibility and enhancing local and global initiatives that benefit individuals and society.
It appears that multinational corporations in under developing countries are more powerful than local communities, so negotiations between the giant companies and local people become arduous, especially while states do not comply with agreed measures, monitoring is poor and effective sanctions are rarely put in place. Bebbington (2006) points out the credibility of elites and governments with such temptation to weaken, de-legitimize, incorporate or indeed repress social movements. In some cases, CSR regimes have a number of indirect positive effects, such as attention to a shared understanding about causes and effects, and lead to the improvement of institutional structures. Berkhout et al. (2003) regards that effective policy making cannot solely be a matter of governments negotiating with governments to produce new international legal instruments. However, the multiple equilibrium model on account of public distrust which discourages social capital accumulation proposed by Aghion et al. (2009) suggest that individuals in low trust countries want more government intervention even though the government is corrupt.
To pursue a better world through promote foreign direct investment and fair international trade, United Nation set an organization, namely UNCTAD. This is part of united national bodies which dealing with trade, investment and development issues. Along with a belief that international trade and FDI as a mean to overcome wide gap between poor and rich countries, the organization aims to foster trade and investment for developing countries associated with world economic integration. This organization also publishes the annual report, namely World Investment Report.
In 2010, World Investment Report reveals the efforts to promote low carbon economy. The key issues of low carbon economy refer on clean-investment promotion strategies. This was about dissemination of clean technology, securing international investment contribution to climate change mitigation, harmonizing corporate greenhouse gas (GHG) emission disclosure, and establish an international low-carbon technical assistance center (L-TAC).
The pollution haven hypothesis or pollution haven effect refers migration of dirty industries from the developed to the developing countries (Akbostanci et al., 2007). Based on Heckscher-Ohlin model which points out that a region will export goods with abundant local factors as input, the model premises is that environment regulation prompts the cost of key inputs. The econometric models have typically focused on reduced-form regressions of a measure of economic activity on some measure of regulation stringency and other covariates:
i i i i i
y ��R X� �� �� (10)
where Y is economic activity, R is regulatory stringency, X is other characteristic that will affect Y, and � is an error term. The pollution haven hypothesis is that estimates �Y/�R will be negative
�
��ˆ 0 .�
0 1 2
2it it it it
CO � �� � FDI �� INC �� (11) where CO2 is the carbon emission (in metric tons per capita), FDI is foreign direct investment, INC is adjusted-national income, ٕ�0, �1, �2 are parameters to be estimated, i denotes the i-th country, t denotes the t-th time, and � represents error-term.
While there is an expectation that FDI can foster economic growth, some developing countries put some efforts to attract FDI sometimes with “unfair competitive advantage”. One of the absolute advantages is cheap labor and enormous labor supply with low labor standards (poor worker rights). Sharna (2005) names the competition as “a race to the bottom” where countries start weakening their regulations in order to gain a competitive edge. On the other hand, it is generally well-accepted that labor standards and workers’ conditions improve by themselves through economic growth and FDI brings this growth. Some international organizations (e.g. OECD and ILO) stick together to run up against the issue of labor standard. However, the absence of enforcement of standards, benefits coming from economic growth may remain restricted to only a small section of privileged workers, failing to improve conditions of majority workers.
Most foreign investors find it risky to invest in developing nations, where only few can afford private treatment or insurance. It is therefore more common to see FDI through joint ventures with local partners to ensure access to qualified personnel and a better understanding of local culture and characteristics (Smith, 2004).
The empirical model for testing the impact of FDI on social security is as follows:
0 1 2log 3
it it it it it
SOCH � �� � FDI �� INC �� ODA �� (12) where SOCH represents social security expenditure, FDI is foreign direct investment, INC represents adjusted-national income, ODA represents official development assistance, �0, �1, �2 are estimated parameters, � represents disturbance variable.
2. DATA SOURCES AND VARIABLES
The data uses in this study are taken from the World Bank Database, which is accessed online at http:// data.worldbank.org/. The data includes 120 developing countries that reported FDI (foreign direct investment), ODA (Official Development Assistance), and INC (Adjustment National Income), Carbon Emmision, and Social Security Expenditure for the years 2010 to 2013. The panel data are unbalance, consist of 474 observations.
Table 1
Variables and the Definition Symbol Variable Definition
INC National Income is the adjusted national income, calculated from gross national income minus consumption of fixed capital and natural resources depletion, using the constant 2000.
FDI Foreign Direct Investment Is the net inflow of foreign direct investment to the country, using the constant value 2000
ODA Official Development Assistance is the per capita grant flow to a country provided by donor agencies at all level, measured in constant price 2000.
CO2 Carbon Emission is metric tons of carbon emission per capita
SOCH Social Security is total expenditure in social security, measured in constant price 2000.
RESULTS AND DISCUSSION 1. The FDI and Economic Grwoth Estimation
Utilizing the empirical model in Equation (9), this paper estimates the observed data using three panel models: Common Effect (CE), Random Effect (RE), and Fixed Effect (FE). The CE model assumes that all countries have a same constant and slope, which is represented by the estimated coefficient in linear regression. The RE model is applied in an assumption that the unobserved effect is uncorrelated with the explanatory variables. The FE model has certain assumption. When is serially correlated, FE is moree efficient than first differencing. Hence, the feasible GLS estimator is more appropriate to deal with positive serial correlation in the error term (Wooldridge, 2008).
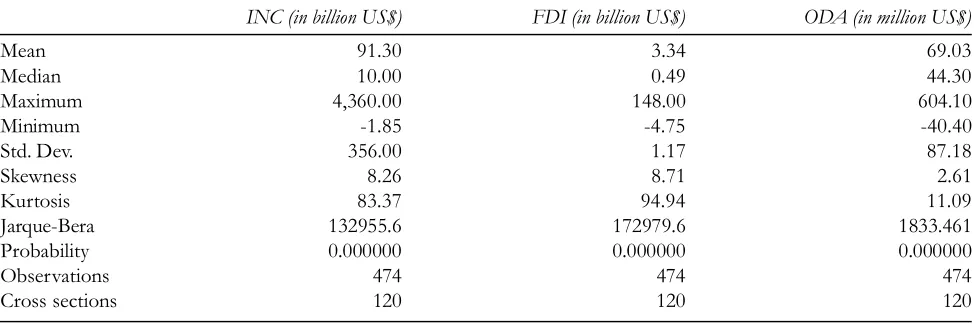
Table 1 presents statistic descriptive for the three chosen variables: INC, FDI, and ODA. The table shows that the income disparity among the observed countries was huge and the JB test indicates that null hypothesis of normal distribution was not accepted. The average observed GNI in 2009 was $ 91.3 billion. Five countries with highest GNI in 2009 were China, Brazil, India, Mexico, and Turkey. The GNI of China is around $4,360 billion, followed by Brazil and India, with GNI of $1,350 billion and $1000 billion, respectively. Indonesia GNI was around $350 billion. On the other hand, five countries with lowest level GNI were Liberia, Como, Tonga, Saotome and Equator.
Table 1
Statistic Descriptive for Variables
INC (in billion US$) FDI (in billion US$) ODA (in million US$)
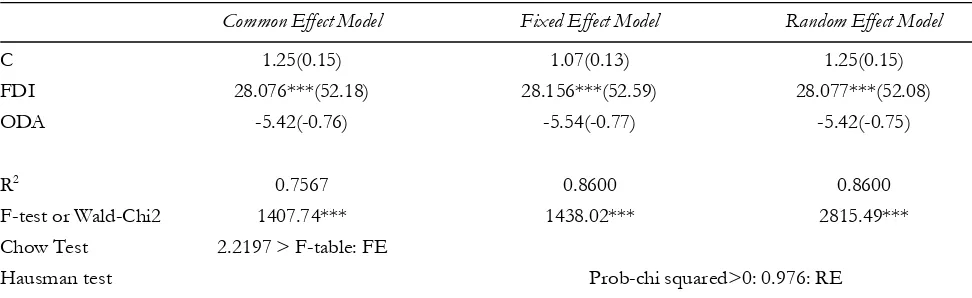
Table 2 presents the estimation results of the three panel models: Common Effect (CE) model, Random Effect (RE) model, and Fixed Effect (FE) model. The Chow test is employed to compare the common effect model with fixed effect model, while the Hausman test is used to compare the fixed effect model with random effect model. The Chow test justifies that the FE model is better than CE model, and the Hausman test confirms that the RE model is a more suitable model than FE model. Hence, the discussion of results are based on the RE model.
The estimation result of FDI variable shows that there is a positive and significant effect of FDI on economic growth (INC). The magnitude appears to be high, as the increase in US$1 in FDI might induce national income by US$28.08. This finding conforms the FDI induce growth hypothesis, and it is in line with the empirical result by Borenzstein et al. (1998) for 69 developing countries from 1970 to 1986, Wang (2009) for 12 Asian countries during 1987-1997 period, and Tiwari and Mutascu (2011) for 23 Asian countries between 1986 and 2008.
In contrast, ODA has no significant statistic effect to economic growth, which is reflected from the insignificance of the estimate. This finding does not support the theoretical argument of public debt increases economic growth as in Greiner and Fincke (2009). In term of the sign of coefficient, the finding is in line with Egert (2012) that there is a negative relationship between public debt and economic growth. However, finding of this recent study is more closely similar with the findings of Qureshi and Ali (2010) for Pakistan and Panniza and Presbitore (2012) for OECD countries.
Table 2
Regression with Dependent Variable: INC
Common Effect Model Fixed Effect Model Random Effect Model
C 1.25(0.15) 1.07(0.13) 1.25(0.15)
FDI 28.076***(52.18) 28.156***(52.59) 28.077***(52.08)
ODA -5.42(-0.76) -5.54(-0.77) -5.42(-0.75)
R2 0.7567 0.8600 0.8600
F-test or Wald-Chi2 1407.74*** 1438.02*** 2815.49***
Chow Test 2.2197 > F-table: FE
Hausman test Prob-chi squared>0: 0.976: RE
Notes: *** indicates significance at 1% level. Numbers in parentheses are t-statistics or z-statistics.
2. FDI and Environment
The variable represents environment quality is CO2 emissions (metric tons per capita), which are stemming from the burning of fossil fuels and the manufacture of cement. The variable includes carbon dioxide produced during consumption of solid, liquid, and gas fuels and gas flaring (World Bank, 2011).
homes, drive cars and generate electricity with coal. The U.S. fell to second at 19.78 tons per inhabitant a year while Canada was third at 18.81 tons.
The average Chinese person emits 4.5 tons of greenhouse gases a year and a typical Indian 1.16 tons. Because of populations in excess of 1 billion, the aggregate emissions of those two countries makes them the first and fourth-biggest emitters, according to the U.S. Department of Energy, which ranks the U.S. second and Russia third. China and India argue that developed nations such as the U.S., Canada and Australia must cut emissions by 40 percent from 1990 levels in 2020, and that poorer countries need room to raise their greenhouse gases to allow them to develop (Loon and Morales, 2010)
The ranking indicates how much more people in wealthier nations emit than those in large developing countries. That was a key argument used by China and India to push for emissions cuts in the U.S., Europe and Japan as the United Nations aims to write a climate-change treaty in Copenhagen Denmark in 2009. On the other hand, that was disaster meeting in which China managed to block the open negotiations for two weeks, and then ensure that the closed-door deal made it look as if the west had failed the world’s poor once again. And sure enough, the aid agencies, civil society movements and environmental groups all took the bait. The failure was “the inevitable result of rich countries refusing adequately and fairly to shoulder their overwhelming responsibility.
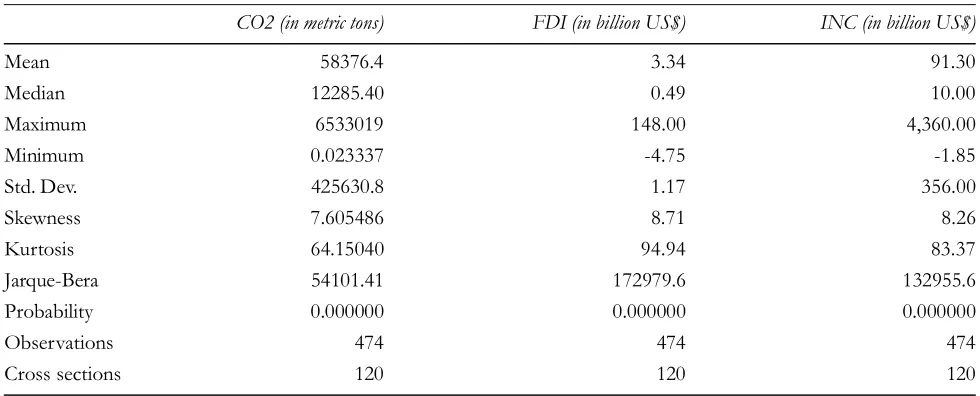
Table 3 presents the descriptive statistics for variables in Pollution Haven Model.
Table 3
Environment Data Description
CO2 (in metric tons) FDI (in billion US$) INC (in billion US$)
Mean 58376.4 3.34 91.30
Median 12285.40 0.49 10.00
Maximum 6533019 148.00 4,360.00
Minimum 0.023337 -4.75 -1.85
Std. Dev. 425630.8 1.17 356.00
Skewness 7.605486 8.71 8.26
Kurtosis 64.15040 94.94 83.37
Jarque-Bera 54101.41 172979.6 132955.6
Probability 0.000000 0.000000 0.000000
Observations 474 474 474
Cross sections 120 120 120
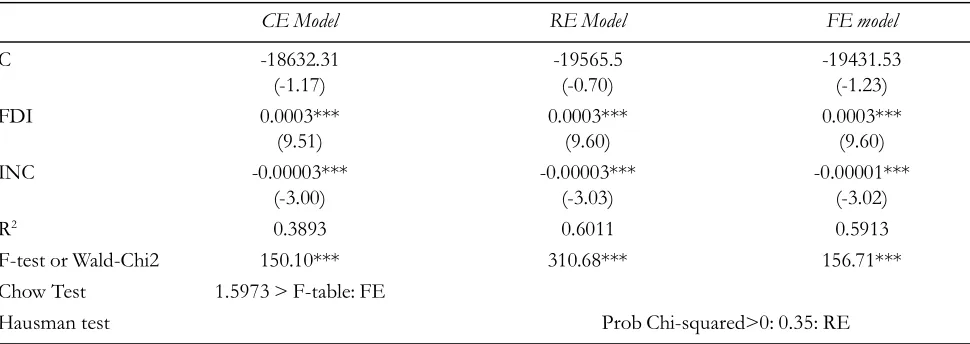
possible explanation for this finding is that most multinational enterprises do not really focus in corporate social responsibility in reducing emission. This result contradicts the theoretical argument of Ralston (2010) on that a foreign company tends to become more socially responsible after adapting with local culture. However, the finding is in line with empirical findings by Merican et al. (2007) for five Asian countries, Acharyya (2009) for India, and Shasbaz (2011) for 110 countries, in that FDI adds to pollution in host countries.
Table 4
Dependent Variable: CO2 emission per capita
CE Model RE Model FE model
C -18632.31 -19565.5 -19431.53
(-1.17) (-0.70) (-1.23)
FDI 0.0003*** 0.0003*** 0.0003***
(9.51) (9.60) (9.60)
INC -0.00003*** -0.00003*** -0.00001***
(-3.00) (-3.03) (-3.02)
R2 0.3893 0.6011 0.5913
F-test or Wald-Chi2 150.10*** 310.68*** 156.71***
Chow Test 1.5973 > F-table: FE
Hausman test Prob Chi-squared>0: 0.35: RE
Notes: Numbers in parentheses are t-statistic.
The estimate of INC on CO2 is negative and statistically significant, suggesting that the increase in income decrease the carbon emission. In other word, higher income countries have a lower carbon emission. This finding is not a surprise as a higher income country might put a substantial effort in maintaining its environment quality, by decreasing carbon emission. This result is similar with findings by Holtz-Eakin and Selden (1992) on 131 developed and developing countries, Narayan and Narayan (2010) for 43 developing countries, and Sanglimsuwan (2011) for 63 countries.
3. FDI and Social Security
The variable of social security presents the social security expenditure on health sector in percentage of total government expenditure. The average social security expenditure is 15.17% for 120 countries (Table 2.5). The median of 0% indicates that most observed countries spend nearly zero for social security on health sector, and the high standard deviation indicates a large gap in spending on social security among observed countries.
Following the same procedure as in the previous section, three models are estimated, and the results are presented in Table 6. Among the three models, RE model is the most suitable model, as Hausman test shows that the probability Chi-squared is 0.15, which is higher than 5%. Hence, we follow the RE model in interpreting the estimation results.
high income country has a higher likelihood to spend more on public health service if compare to a low income country. This results in line with the finding of Xu et al. (2011) for 143 countries, even though it is contradict finding of Acemoglu et al. (2009) for United States.
In contrast, FDI does not have a significant effect on public health expenditure, although the estimated coefficient is positive. This suggests that the inflow of FDI does not contribute to the social welfare in the host countries. This finding challenges results in Herzer and Nunnenkamp (2012), who argue a negative relationship of FDI and public health spending for developed countries. The difference in finding could be because the observed samples have different characteristics, where the current study examines developing countries while the study by Herzer and Nunnenkamp (2012) studies developed countries. Nevertheless, the finding is in line with Blonigen and O’Fallon (2011).
Table 5
Descriptive Statistics for FDI and Social Security Model
SOCH (in million US$) FDI (in billion US$) ODA (in million US$)
Mean 15.17 3.34 69.03
Regression with Social Security Expenditure as Dependent Variable
The negative sign and statistically significant of coefficient ODA indicates that the increase in public debt decrease social security expenditure. This finding is not surprising as the increase in public debt increases the interest payments and hence decreases the potential spending on social security expenditure. Olivera and Lora (2006) find the similar result for Latin America. A study by Mahdavi (2004) pictures the similar finding for 47 countries.
CONCLUSION
This study examines that impact of FDI on three important factors: economic growth, carbon emission, and social welfare. In evaluating the impact of FDI on economic growth, a new empirical model is developed under the theoretical framework of Turckan et al. (2008). The effect of FDI on carbon emission is analyzed under the framework of environmental CSR and the hypothesis of pollution haven. Furthermore, the impact of FDI on social security of the host countries citizen is tested under the argument of ‘unfair competitive advantage”.
The findings of this study indicate that although FDI has a pivotal role to foster economic growth, it contributes to the environmental degradation. In addition, FDI is found to be not significant affecting social security policy. These findings suggest that FDI seeks profit through expanding output capacity. However, the inflow of FDI comes with a cost of pollutant addition. More importantly, the initiative to develop quality of life is not the key element yet in FDI.
Findings of this study have two policy implications. Firstly, the policy in favour FDI in developing countries should consider not only the contribution of FDI on economic growth but also taking into account the cost on environmental degradation. Secondly, foreign firms those contribute to economic growth as well as environmental-friendly should be encouraged.
REFERENCE
Acharyya, Y. (2009), “FDI, Growth and the Environment: Evidence from India on CO2 Emission during the Last Two Decades”, Journal of Economic Development, Vol. 34, No. 1), pp. 43-58.
Aghion, P., Algan, ,Y., Cahuc, P. and Shleifer, A. (2010), “Regulation and Distrust”, Quarterly Journal of Economics, Vol. 125, No. 3, pp. 1015-1049.
Akbostanci, E., Tunc, G. I. and Turut-Asik, S. (2007), “Pollution Haven Hypothesis and the Roles of Dirty Industries in Turkey’s Exports”, Environment and Development Economics, Vol. 12, No. 2, pp. 297-322.
Aliyu, M. A. (2005), “Foreign Direct Investment and the Environment: Pollution Haven Hypothesis Revisited”, Eight
Annual Conference on Global Economic Analysis, Lubeck Germany June 9-11 2005 < https://www.gtap.agecon.purdue.edu/ resources/download/2131.pdf> accessed on August 21, 2011
Alfaro, L, Chanda, A., Kalemli-Ozcan, S. and Sayek, S. (2004), “FDI and Economic Growth: the Role of Local Financial Markets”, Journal of International Economics, Vol. 64, No. 1, pp. 89-112.
Bebbington, A. (2006), “Social movements and the politicization of chronic poverty policy”, Institute of Development Policy and Management School of Environment and Development University of Manchester, CPRC Working Paper 63. Berkhout, F., Leach, M. and Scoones, .I. (2003). Negotiating Environmental Change. Edward Elgar Publishing Limited,
Cheltenham, UK
Bhattacharyya, S.S. (2010), “Exploring the concept of strategic corporate social responsibility for an integrated perspective”,
Blonigen, B. and O’Fallon, C. (2011). “Foreign firms and local communities”. NBER Working Paper 17282. Cambridge, MA
Borenztein, E, J. De Gregorio, dan J. W. Lee (1998), “How Does Direct Foreign Investment Affect Economic Growth”,
Journal of International Economics, Vol. 45, No. 1, pp. 115-172.
Brakman, S., Garretsen, H., van Marrewijk, C., van Witteloostuijn, A. (2006), Nations and Firms in the Global Economy: An introduction to International Economics and Business, Cambridge University Press, New York.
Borregaard, N., Dufey, A. and Winchester, L. (2008), “Effect of Foreign Investment versus Domestic Investment on the
Forestry Sector in Latin America (Chile and Brazil): Demystifying Effect related to the Environment”, Working
Group on Development and Environment in the Americas, Discussion paper number 15 http://ase.tufts.edu/gdae/Pubs/rp/ DP15Borregaard_Dufey_WinchesterApr08.pdf.
Chowdhry, A. and Mavrotas. G. (2006). “FDI and Growth: What Causes What”, The World Economy, Vol. 29 No. 1, pp.
42-58.
Djankov, S. and Hoekman, B. (1999), “Foreign Investment and Productivity Growth in Czech Enterprises”, World Bank
Economic Review, Vol. 14, pp. 49-64.
Greiner, A. and Fincke, B. (2009) Public Debt and Economic Growth, Springer.
Hansen, H. and Rand, J. (2006), “On the Causal Links Between FDI and Growth in Developing Countries,” The World
Economy, Vol. 29, No. 1, pp. 21-41.
Henderson, D. (2009). “Misguided corporate virtue: the case against CSR, and the true role of business today”, Economic Affairs, Vol. 29, No. 4, pp 11-15.
Herman, M., Chisholm, D. and Leavell, H. (2005), “FDI and the Effect on Society”, Journal of International Business Research,
Vol. 4, No. 1, pp. 11-26.
Herzer, D. and Nunnenkamp, P. (2012), “FDI and Health in Developed Economies: A Panel Cointegration Analysis”,
Working Papers of Kiel Institue for the World Economy.
Holtz-Eikin, D. and Selden, T. M. (1992), “Stoking the Fires: CO2 Emission and Economic Growth”, NBER Working
Paper No. 4248.
Kawai, H. (1994), “International Comparative Analysis of Economic Growth: Trade Liberalisation and Productivity”,
The Developing Economies, Vol. 17, No. 4, pp. 373-397.
Khalid, A, and Noy, I. (2007), “Foreign Direct Investment and Economic Growth: Empirical Evidence from Sectoral Data in Indonesia”, Working Paper University of Hawaii, downloaded atTop of Form http://www.economics.hawaii.edu/ research/workingpapers/WP_07-26.pdf, last accessed 15 February 2013.Bottom of Form.
Kunt, A.D., and Levine, R. (2009),“Finance and Inequality: Theory and Evidence”, National Bureau of Economic Research,
working paper 15275 < http://www.nber.org/papers/w15275> accessed on July 15, 2011
Lantos, G. P. (2001), “The boundaries of strategic social responsibility”, Journal of Consumer Marketing, 18(7), p 595-630 Letchumanan, R. and Kodama, F. (2000), “Reconciling the Conflict between the ‘Pollution Haven’ Hypothesis and an
Emerging Trajectory of International Technology Transfer”, Research Policy, Vol. 29, No. 1, pp. 59-79.
London, M. (2010), “Understanding social advocacy: An Integrative Model of Motivation, Strategy and Persistence in Support of Corporate Social Responsibility and Social Enterpreneurship”, Journal of Management Development, Vol. 29, No. 3, pp 224-245
Loon, J. V. and Morales,A. (2009), Australia Overtakes US in Per capita CO2 Emission, Blomberg, downloaded from http:// www.bloomberg.com/apps/news?pid=newsarchive&sid=aN60ck4Sz4iE, last accessed on 20 August 2011.
Mahdavi, S. (2004), “Shifts in the Composition of Government Spending in Response to External Debt Burden.” World
Development, Vol.32, No. 7, pp. 1139-1157
Mencinger, J. (2003), “Does Foreign Direct Investment Always Enhance Economic Growth?”, Kyklos, Vol. 56, No. 4, pp. 491-508.
Merican, Y, Yusob, Z., Noor, Z. M. and Hook, L. S. (2007), “Foreign Direct Investment and the Pollution in Five ASEAN Nations”, International Journal of Economics and Management Vol. 1, No. 2, pp. 245-261.
Moran, T. H. (1998), Foreign Direct Investment and Development: The New policy Agenda for Developing Countries and Economies in Transition, Washington D.C., Institute for International Economics.
Narayan, P. K., and Narayan, S. (2010), “Carbon Dioxide Emission and Economic Growth: Panel Data Evidence from Developing Countries”, Energy Policy, Vol. 38, No. 1, pp. 661-666.
Olivera, M. and Lora, E. (2006), “Public Debt and Social Expenditure: Friends or Foes?”, Inter-American Development Bank Working Paper no. 563, downloaded at http://papers.ssrn.com/sol3/papers.cfm?abstract_id=905964, last accessed on 18 Feb 2013.
Panizza, U and A. F. Presbitore, (2012), “Public Debt and Economic Growth: Is There a Causal Effect?”, MOFIN Working
Paper number 46, downloaded from http://docs.dises.univpm.it/web/quaderni/pdfmofir/Mofir065.pdf, last accessed: 13 February 2013.
Qureshi, M. N. and Ali, K. (2010), “Public Debt Burden and Economic Growth: Evidence from Pakistan”, International
Research Journal of Finance and Economics, Vol. 53, pp. 100-108.
Ralston, E. S. (2010), “Deviance or norm? Exploring corporate social responsibility”, European Business Review, Vol. 22, No. 4, pp. 397-410
Ray, S. (2012), “Impact of Foreign Direct Investment on Economic Growth in India: A Co-Integration Analysis”, Advance
in Information Technology and Management, Vol. 2, No. 1, pp. 187-201.
Revesz, R.L. (1992). Rehabilitating Interstate-Competition: Rethinking the ‘Race to the Bottom’. New York University Law
Review, 67.Russ, K.N. (2009), “The New Theory of Foreign Direct Investment: Merging Micro-level and macro-finance”, Book Review, download from http://www.tau.ac.il/~razin/russ_bookreview.pdf, last accessed 13 February 2013. Sanglimsuwan, K. (2011), “Carbon Dioxide Emission and Economic Growth”, International Research Journal of Finance and
Economics, Vol. 67, pp. 97-102.
Seelos, C. (2004). “Finding a path in the sustainability jungle: a framework for corporate action”. Occasional Paper of IESE
Business School, University of Navara. No 05/1. Downloaded from http://129.3.20.41/eps/get/papers/0502/
0502071.pdf, last accessed on 26 August 2011
Sharna, R. (2005), The Impact of Core Labor Standards on Foreign Direct Investment in East Asia”, Working Paper The
Japan Institute for Labor Policy and Training, Tokyo Japan, downloaded from: http://www.jil.go.jp/profile/documents/Sarna.pdf,
last accessed on 13 February 2013.
Smith, R.D. (2004), “Foreign Direct Investment and trade in health services: a review of the literature”, Social Science and Medicine, Vol. 59, pp 2313-2323.
Tiwari, A. K., and Mutaschu, M. (2011), “Economic Growth and FDI in Asia: A Panel Data Approach”, Economic Analysis
and Policy, Vol. 41, No. 2, pp. 173-187.
Turckan, B., Duman, A. and Yetkiner, I. H. (2008), How Does FDI and Economic Growth Affect Each Other? The OECD Case, Proceeding of the International Conference on Emerging Economic Issues in a Globalizing World, Izmir, 2008 Waddock, S. (2004), Creating corporate accountability: foundation principles to make corporate citizenship real. Journal of
Business Ethics, Vol. 50, No. 4, pp. 313-327.
Waldman, D.A., Siegel, D.S. and Javidan, M. (2004), “Components of CEO Transformational Leadership and Corporate Social Responsibility”. Journal of Management Studies, Vol. 43, No. 8, pp. 1703-1725.
Wang, M. (2009), “Manufacturing FDI and Economic Growth: Evidence from Asean Economies”, Applied Economics,
Wooldridge, J. M. (2008), Econometric Analysis of Cross Section and Panel Data, The MIT Press, Cambridge. World Bank (2011) World Development Indicators, Washington DC.
Xu, K., Saksena, P. and Holly, A. (2011), “he Determinants of Health Expenditure: A Country-Level Panel Data Analysis”, Working Paper of World Health Organizatio.
Zarsky, L. (1997). “Stuck in the mud? Nation States, Globalization, and Environment”, In: OECD Ed.
Zhang, K. H. (2001), Does Foreign Direct Investment Promote Economic Growth? Evidence from East Asia and Latin America, Contemporary Economic Policy, Vol. 16, No. 2, pp. 175-185.