LANDSLIDE MONITORING BY FIXED-BASE TERRESTRIAL
STEREO-PHOTOGRAMMETRY
R. Roncellaa, *, G. Forlania, M. Fornaria, F. Diotrib
a DICATeA, University of Parma, 43124 Parma (PR), Italy - (riccardo.roncella, gianfranco.forlani, matteo.fornari)@unipr.it b FMS, Fondazione Montagna Sicura, Loc. Villard de La Palud 1, I - 11013 Courmayeur - [email protected]
Commission V, WG V/5
KEY WORDS: Hazard, Landslides, Terrestrial, Photogrammetry, Monitoring, Automation, Algorithms
ABSTRACT:
Photogrammetry has been used since long to periodically control the evolution of landslides; however, true monitoring is reserved to robotic total stations and ground based InSAR systems, capable of high frequency, high accurate 24h/day response. This paper presents the first results of a fixed terrestrial stereo photogrammetric system developed to monitor shape changes of the scene. The system is made of two reflex cameras, each contained in a sealed box with a control computer that periodically acquires an image and send it to a host computer; once an image pair is received from the two cameras, the DSM of the scene is generated by image correlation and made available for archiving or analysis. The system has been installed and is being tested on the Mont de la Saxe landslide, where several monitoring system are active. Some instability of the camera attitude has been noticed and is corrected with an automated procedure. First comparisons with InSAR data show a good agreement.
* Corresponding author. This is useful to know for communication with the appropriate person in cases with more than one author. 1. INTRODUCTION
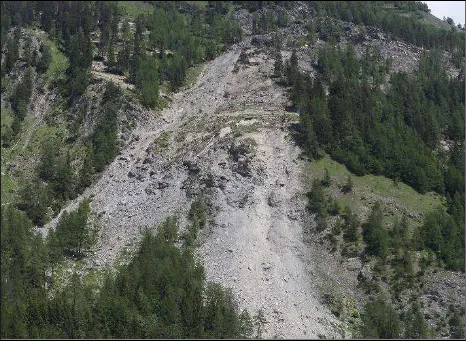
The landslide of Mont de la Saxe in Courmayeur (AO - Italy), above the hamlet of the same name, is considered one of the most complex landslides in Italy. With an estimated volume of about 8 million cubic meters (Crosta, et al., 2012), the movements threatens the villages of Entreves and La Palud as well as the A5 motorway and the national road SS 26. In the spring 2013 a sudden acceleration forced the local administration to evacuate the area and to close all the accesses to the Ferret Valley.
Figure 1: The Mont de la Saxe landslide (25 June 2013)
The landslide is monitored since 2009; a slow continuous movement alternates with sudden accelerations. This complex dynamics drew international attention not only to assess the geological and geotechnical problems, but also to evaluate and
compare different state of the art monitoring techniques. In particular, the trend of the phenomenon is now being followed by 7 permanent GPS stations, 25 prisms monitored every 2 hours by a robotic total station and a ground-based InSAR (Interferometric Synthetic Aperture Radar) system with 10 minutes acquisition interval. In addition, periodic Terrestrial Laser Scanning (TLS) surveys are performed to produce updated DSM of the landslide.
To this day, the only surveying techniques not considered are terrestrial or aerial photogrammetry: undoubtedly the precision of such techniques is not comparable with the other and cannot be used to assess displacements with enough reliability on a daily basis. Nonetheless the capability to produce a complete DSM of the whole slope front, with accuracies at least of the same order of those obtainable with TLS, makes it worth considering this approach as an alternative for monitoring with lower frequency.
The use of an helicopter would allow an ideal imaging geometry over the entire front, but at a prohibitive cost. At the same time, it would be quite difficult to use Ground Control Points (GCP) without significantly enlarge the size of the photogrammetric block: stable points can be found only at a certain distance from the landslide body. A solution would be positioning GCP inside the landslide body tracked by the robotic total station already installed: each different survey would have updated coordinates; however, the survey would be dependent on an additional device with an impact on the cost. From these considerations, it was decided to design and install a fixed photogrammetric system, on the opposite side of the valley, capable to discriminate the movements in critical accelerations phases and to acquire DSM of the front with high temporal frequency. A terrestrial system seems preferable to provide a continuous and low cost flow of dense geometric data, even if inherent limits on accuracy and camera stability should be dealt with. Well aware of such challenges, together and under the coordination of
Fondazione Montagna Sicura (FMS) – a not-for-profit foundation promoted by the Valle d'Aosta Region, which studies issues concerning the safety, rescue and life in high-mountain - our research group has been called to develop and implement a photogrammetric monitoring system and test its performance on the Mont de la Saxe landslide.
1.1 Previous work on the topic
Photogrammetry has been used since long time to periodically control the evolution of landslides, either from aerial images (Casson, Baratoux, Delacourt, & Allemand, 2003) well as from ground (Cardenal, et al., 2008); it has been used in combination with GPS surveys on the landlslide body (Mora, et al., 2003). More recently, terrestrial (TLS) and aerial (ALS) laser scanning is also being used as alternative (Bitelli, Dubbini, & Zanutta, 2004); (Abellán, Jaboyedoff, Oppikofer, & Vilaplana, 2009); (Prokop & Panholzer, 2009), the former particularly with landslides on steep slopes.
Ground-based or satellite based InSAR (Leva, Nico, Tarchi, Fortuny, & Sieber, 2003); (Colesanti & Wasowski, 2006) is also being used to monitor landslides, provided the kind of terrain allows for good coherence between multi-temporal images and the main displacement component is along the line-of-sight; the ground-based version need a fixed and stable installation and its installation and monitoring costs are relevant. However, the system is quite efficient and provides almost continuous monitoring over a large area with mm sensitivity.
The stability of the reference system is a key issue with any monitoring system; optical geodetic measurements with collimators, theodolites and total stations traditionally rely on precise centring devices and stable reference points for orientation; this applies to laser scanning as well (Monserrat & Crosetto, 2008), (Scaioni, Roncella, & Alba, 2013). In this respect, however, photogrammetry relies on GCP (photo-theodolites being a past exception) because GPS/INS integrated systems are not accurate enough for monitoring.
A true monitoring system, however, should be able to collect data at (possibly high) regular frequency, when the risk posed by the landslide and its activity need a continuously operating system. In practice, only permanent installations can be used to this aim, such as GPS receivers, GB-InSAR, robotic total stations, able to measure 24h/day and to transmit data from the sensor to a control center. The photogrammetric system developed and applied to the Mont de la Saxe landslide, in such respect, cannot obviously substitute for a true monitoring system because of limitation to daylight and good weather operation, but its strength lies in low cost, simplicity of components and scalability. The system is to our best knowledge the first attempt to use stereo photogrammetry from outdoor permanent photo stations for monitoring purposes. Two monocular systems with similar characteristics are described in (Travelletti, et al., 2010) and in (Motta, et al., 2013). In the former, a Nikon D70 camera with a 50 mm lens is placed on a pillar facing the landslide, at a distance ranging from 300 to 900 m; 4 images per day are acquired around noon. The exterior orientation of the camera is determined by resection from several GCP measured with GPS. The processing software tracks features in consecutive images producing a projection of the displacement field of the landslide in the image plane camera. To estimate the actual displacement in ground coordinates, a high resolution Lidar DTM of the area is projected on the image and associated to the image coordinates. Comparison of the system with GPS monitoring over a period of about 2 years show good correlation and a relative accuracy
between 10-20% is reported. Systematic errors due to changes in the DTM morphology as well as from camera movement are also reported; the latter can be detected by a statistical test on the estimated displacement field. System performance is also strongly affected by illumination conditions, meteo conditions and seasonal changes in land surface.
2. THE PHOTOGRAMMETRIC SYSTEM
2.1 System requirements
The system has been designed to produce periodically three-dimensional models of the scene; the frequency of acquisition should be related to the attainable accuracy and matched to the expected magnitude of the displacement. In the Mont de la Saxe case, a Ground Sampling Distance (GSD) of ca. 20 cm and an accuracy of about 5 - 10 cm were foreseen; given the landslide dynamics, such values are compatible for a comparison on a monthly base.
During the initial design stages, many different aspects that the system should satisfy were considered. The system should operate under any outdoor weather conditions with temperatures way beyond -20 °C in winter and exceeding +30 °C in summer under sunshine. The system should be autonomous w.r.t. energy supply; a large solar cell panel should be avoided if, for practical reasons, the box and the panel are fixed to the same rod, to avoid disturbance by strong winds: the hardware must therefore use energy sparingly and backup batteries are necessary. At the same time, to keep system costs at the lowest, customer-grade cameras and off-the-shelf hardware must be utilized. Finally, being the system conceived for high-mountain environment, it’s likely to be installed in hard-reachable locations: all the hardware must be remotely controlled and checked, to keep to a minimum the on-site user intervention.
The photogrammetric requirements for the system were demanding as well: as already stated the system should provide a displacement field on a monthly scale, given the movements of the landslide that may exceed 2 m/year in the most active areas. To this aim, an accuracy of about 10 cm in depth (i.e. along the optical axis direction) should be granted. Considering the distance from the slope where a good imaging geometry can be obtained (ca. 500-600 m) long focal length optics must be used. This makes the estimation procedure of interior and exterior parameter particularly troublesome. Being the system designed for use where more expensive monitoring equipment cannot be afforded, the resolution and the quality of the camera and of the optics cannot be chosen regardless of their weight on the system total cost.
Finally, the system must be completely autonomous in elaborating and comparing the images: at each measurement epoch, the system should send the data to a centralized archiving and processing server, which autonomously produce a DSM of the slope. Finally, the new DSM should be automatically compared with a reference DSM of the slope to evaluate the movements and, in case, send an alert.
2.2 System overview
As far as the system hardware is concerned the requirements were quite demanding: low costs, low energy consumptions, hard environment conditions, camera and optics interchangeability, wireless remote control. At first, some commercial solutions, including very high performance webcam, were considered but discarded due to their severe
limitations on photographic configurability and energy consumption. Moreover, all solutions were also limited by closed, not customizable, software. It was therefore preferred a completely custom made system using a SLR (Single Lens Reflex) camera with interchangeable lens coupled with a programmable board for camera control and data transmission. All the devices are housed in an IP67 watertight box (Figure 2) that can be easily transported, sufficiently robust to endure the most critical wheatear conditions, equipped with a special joint to allow an easy orientation of the camera. To prevent condensation at low temperatures, the air is removed with a vacuum pump from a valve.
Figure 2: The watertight IP67 box housing all the acquisition and transmit equipment.
Inside the box, next to the camera, a micro-computer controls shooting, storing, processing and data transmission. The operating system uses a very lightweight Linux Debian 6.0 "Squeeze", with plenty of available open-source software. The micro-computer is connected to a GSM modem for data transmission. The user, through SSH (Secure SHell) protocol, controls all the acquisition parameters, as well as any other aspect of the system (battery status, temperatures, etc.) in order to have maximum capacity for intervention. The system is permanently connected to the Internet and automatically reconnects in case the board loses for some reason the GSM signal (e.g. temporary hardware malfunction, low batteries, etc.). Every fifteen minutes the system clock is updated to have a good synchronization between the two acquisition units. In the quite wide range of digital cameras that, at affordable prices, can fulfil all the requirements, a 21 megapixels Canon EOS 5D Mark was selected. A 50 mm lens was chose to frame completely the area of interest.
For easier system management and safety reasons one of the stations was installed near the FMS facilities; the second box was installed at about 150 m from the first, at a slightly lower elevation. The location was carefully chosen to obtain an homogenous frame scale.
The distance from the installation site to the object varies between 500 m and 650 m. The pose of the camera stations is slightly convergent to ensure maximum overlap. Considering the camera characteristics, the camera relative geometry and assuming an image matching precision of 0.25 pixel, the theoretical accuracy of ground point coordinates is of ca. 5.5÷9 cm along the mean optical axis direction. Nonetheless, any unaccounted variation in terms of interior orientation parameters (especially the principal distance of the optical system) and/or of the exterior orientation (particularly the rotations) can easily produce systematic errors of many cm, making all the previous assumption meaningless.
2.3 System calibration
Once the final photogrammetric box design was approved, a global calibration, estimating the interior parameters of the optical system and the camera position and orientation w.r.t. the box, was performed on the prototypes.
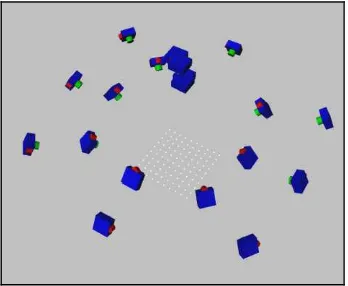
The optical calibration procedure was pretty cumbersome. During the calibration the camera must be kept in the box (due to the external protecting glass) and is controlled remotely via Ethernet connection to shoot the images; handling the box to aim at the calibration panel was impractical, so it was placed in a fixed position. Due to the long focal length optics, a big calibration panel with coded targets was produced: rotating and moving the panel in different positions and changing the box pose provides camera stations with wide base-length; rotating the box around the camera optical axis should remove correlation between parameters. A bundle block full-field analytical calibration, with 20 images approximately distributed on a spherical surface centred on the calibration panel (see Figure 3), was performed . A RMS of the collinearity residuals of ca. 0.7 pixel for both cameras was obtained: usually, with FX consumer-grade camera and optics of the same quality, better results should be expected (i.e. ca. 0.2-0.3 pixel residuals) and, as a matter of fact, calibrating the camera without the box, much better residuals have been obtained. The most obvious explanation is that the protective glass introduce some distortion not modelled by the calibration procedure (which uses a standard (Brown, 1971) distortion model). Right now, a thinner protective glass has been installed on the box, trying to reduce distortion effects and obtain brighter images. In the correlation matrix, apart from the principal point position w.r.t. the P1 and P2 decentring distortion parameters that always show high correlations, no value exceed 50%.
Figure 3: The image block used for camera calibration
Correlation between parameters must be carefully evaluated and corrected in this case, since the subsequent exterior orientation procedure cannot be performed using (just) Ground Control Point (GCP). Most of the slope areas are not accessible, making rather difficult the installation of proper targets on its front. At the same time, being the area framed by the cameras completely in the active part of the landslide, such targets can be used just once or their movements should be tracked as well (e.g. with a robotized Total Station (TS)). Moreover, to be clearly visible at such distances, the targets should be at least 60x60 cm: the transportation and installation on the slope would be dangerous and troublesome. For all these reason, considering the limited budget provided for the photogrammetric system, just few GCP can be materialized in the scene. It is therefore important to carefully consider interior and exterior orientation parameter
correlations: the positional parameters of the camera could be determined through appropriate procedures or by the combination of topographic and photogrammetric information; in this case, any error in interior orientation parameters would be reflected directly on the ground coordinates of the points with little predictability.
Using natural targets instead is unfortunately difficult: the scene lacks natural features easily identifiable both from the eyepiece of a total station and on the images (see, for instance, Figure 1). At such distances from the object the TS rangefinder is usually not enough reliable/accurate, considering the big footprint of the laser beam and its incidence angle with the slope.
In conclusion, a resection for the single images or a relative and absolute orientation of the stereo model was considered inappropriate; an Integrated Sensor Orientation procedure (Jacobsen, 2004) (Forlani & Pinto, 2007) was instead
implemented. On top of the box a 5/8’’ connection was placed
to mount a retro-reflective prism. The prism centre is eccentric with respect to the centre of perspective of the camera by an unknown eccentricity vector e.
With the two boxes installed in front of the landslide, taking into account the eccentricity and measuring with a TS the prism location, the coordinates of the projection centre of each camera station can be obtained; the attitude parameters must be indirectly obtained using tie points. If three not-aligned cameras were used, the informations (prism location, eccentricity vector and tie point image coordinates) would be sufficient to provide a stable and reliable sensor orientation solution. The mathematical model is the same used in aerial triangulation (Forlani & Pinto, 1994): the prism location is introduced as pseudo-observation togheter with the collinearity equations in the bundle adjustment:
Since the photogrammetric monitoring system consists of just two acquisition boxes, the described bundle adjustment system is rank-deficient unless some GCP are provided fixing all the rotation degrees of freedom of the stereoscopic model. For this reason few GCPs were materialized on the slope.
The eccentricity vector e in image space can be recovered easily by calibration, in principle even with a single image: taking one or more images of a testfield with GCP from the box with the prism installed, the relative position of the optical system and the prism centre can be computed. Using the acquired images the exterior orientation parameters and can be recovered by space resection, while the prism centre position is directly measured by the TS at each shooting station.
To obtain a good redundancy in the eccentricity vector estimation and removing (possible) correlation between the parameters, 7 different poses were considered for both acquisition system changing distance and viewing angles: in both cases the standard deviation of each computed eccentricity components was ca. 1 mm.
3. IMAGE STABILITY OF THE SYSTEM
As already highlighted, a very small unmodelled variation in the mutual or individual position or attitude of the camera stations can introduce apparent shifts in the DTMs comparison that may well exceed the system accuracy. For instance, considering the
actual distance from the object, an unaccounted rotation of 0.01° can introduce a variation of more than 45 cm along the optical axis direction.
A change in the base-length (i.e. a movement along the direction connecting the two perspective centre) is indeed less likely since the support structure of the protection box is extremely rigid and well secured to the ground; if any, its amount would therefore not introduce significant changes in the coordinates.
Conversely, the supporting system is not as impervious to rotational movements: with the snow load on the box in winter and especially the wind thrust, variations to camera attitude angles may occur.
3.1 Correction of unwanted rotations
To highlight the possible movements between different epochs, and (hopefully) subsequently correcting them, two automatic orientation algorithms have been implemented in the processing pipeline. The first compares each of the two images obtained at a certain time with the conjugated position of the previous epoch to highlight possible movements. In fact, especially in windy months, this situation occurs almost at every acquisition epoch. In addition, from time to time a larger rotation of the box has been noticed: whether this is due to a plasticization of the support (unlikely) or a push by external forces (cows, goats and deers usually pasture in the installation area) it’s not clear. Anyway, since small unwanted variations in the camera attitude are very frequent, the second automatic orientation system corrects, at each epoch, the orientation parameters. The system compares any acquired image with a reference one with known exterior orientation and determines the geometric transformation to restore the image plane to the conditions of the original attitude. Assuming that the main contribution to the movement of image plane features is due to unwanted box rotations, an homography can map approximately the transformation between the reference and the acquired image plane. As shown in (Hartley & Zisserman, 2003) any two images of a general scene with the same camera centre can be expressed by their camera matrix (selecting appropriately the reference system) as: calibration matrices (containing the interior orientation parameters associated with each camera) and R is the relative rotation matrix between the two cameras. Considering a generic object point X
denoting with x1 and x2 corresponding image points on the first and second frame, eqs. [3] represent the generic collinearity equations for the two images. With a trivial analytical step, it’s easy to demonstrate the following relation, mapping corresponding points on the two image plane:
1
where H is a 3x3 matrix that, in projective geometry, represents a general planar projective transformation (i.e. an homography). [3]
It’s worth noting that eq. [4] can be used here in two different ways: if some variation in interior parameters of the camera occur (in particular a change in the focal length was considered critical) the full 8 DoF H matrix should be estimated; on the contrary, if the interior parameters are stable enough (i.e. for the epochs considered) only the 3 DoF rotation matrix R could be evaluated. With a procedure identical to that used, for example, to produce panoramic or spherical images, an automatic algorithm, by comparing a series of interest points identified in areas considered stable, determines the transformation with robust estimation models such as RANSAC (Fischler & Bolles, 1981). If just the rotation R is estimated in the procedure, assuming the camera calibration matrix fixed, from eq. [4] the corresponding planar projective transformation H can be derived. The image at the epoch considered is then resampled and brought to a condition projectively equivalent to the configuration in which there is no motion lag.
3.2 Analysis of the exterior orientation stability
Even if the correction workflow described earlier seems pretty
straightforward, it’s unlikely that images at any epoch can be compared with the first frame of the monitoring sequence due to seasonal changes as well as landslide morphology changes. What is currently difficult to quantify, given the nature of the application and the lack of similar experiences in the scientific literature (at least according to author’s knowledge), is the interval of time after which the aspect of the slope changed so much that it prevents the identification of enough corresponding points. When this occurs, the intervention by an operator in necessary to update the exterior orientation parameters and choose a new image to whom report the successive rotations of the frames. However, if such adjustment occurs too frequently, the accumulation of random errors in the process of determining the orientation parameters may lead to erroneous assessment of the movement of the landslide.
For this reason, it was decided to investigate more thoroughly the problem by performing a test where the camera rotations are computed using three different ways to determine the corresponding points:
1. the first method finds automatically corresponding image points with Feature Based Matching (FBM) algorithms;
2. the second consists of manual collimation of recognizable features, well distributed on the frame: it is believed that manual collimation, though less precise, is definitely more robust and ensures reliable recognition of the elements even after a long time interval with respect to the reference frame epoch; 3. a third method uses Area Based Matching (ABM)
algorithms to improve, where possible, the accuracy of image coordinates measured manually by the operator
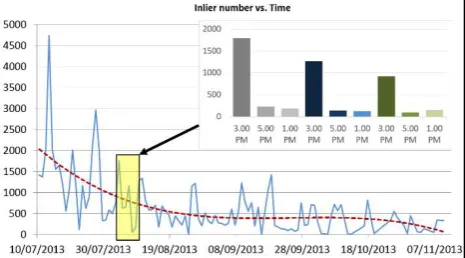
An initial comparison was made between manual and automatic AB collimations in terms of number of identified inlier (points that are consistent with respect to a predetermined threshold of acceptance, with the homography estimated) and of norm of the residuals of the homographic transformation, as well as evaluating differences between obtained angle values. The first, trivial, outcome is that, regardless of the method used for collimation, with the progress of the days less and less inlier can be extracted reliably for the modification of illumination and shadows on the slope, as well as changes in vegetation and other elements of the slope. Figure 4 shows the number of inliers at different epochs using the FBM method.
It’s worth noting that, apart when weather conditions (fog, clouds, haze) prevent any sensible outcome of the algorithm, the inlier number clearly decreases the higher the difference between the time of the day of image acquisition. The images should always be compared considering the same time of the day (or better the same sun position) since the algorithms are far from insensitive to illumination and shadows changes.
Therefore, in further analysis only image pairs where the point matching was reliable were used. Manual collimation is the ideal to provide reference, because the operator is unlikely to make blunders in identifying points.
Figure 4: Inlier number at different epochs. On the upper right side the inlier number obtained at different time of the day is reported.
Finally, to estimate what might be the effect of an incorrect assessment of rotational parameters on the final DSM a numerical simulation was performed. Using the standard deviations of the angle differences identified in the previous analysis (omega = 0.004 °, fi = 0.0022 °, kappa = 0.007°), 1000 error triplets were randomly generated using a Gaussian probability distribution and added to the known initial camera orientations. Five points were considered detected on the surface of the slope at increasing distance, starting from an average distance of 480 m up to a distance of about 700 m. For each set of errors the effect on the coordinates (East, North and Height) of each virtual point was evaluated using a forward intersection algorithm. The results are summarized in Table 1:
EAST
Distance RMS max min %|err| < 10 cm
480 0.04 0.14 -0.14 98
552 0.05 0.14 -0.15 96
604 0.05 0.15 -0.16 93
643 0.07 0.19 -0.2 87
695 0.08 0.24 -0.25 79
NORTH
Distance RMS max min %|err| < 10 cm
480 0.02 0.07 -0.07 100
552 0.04 0.11 -0.1 100
604 0.05 0.14 -0.13 98
643 0.05 0.14 -0.13 97
695 0.06 0.16 -0.16 93
HEIGHT
Distance RMS max min %|err| < 10 cm
480 0.01 0.03 -0.03 100
552 0.01 0.04 -0.05 100
604 0.02 0.06 -0.08 100
643 0.03 0.07 -0.09 100
695 0.03 0.09 -0.12 100
Table 1. Statistics of the effects of a Gaussian (zero mean) distribution of attitude errors in terms of 3D coordinates variation.
It’s worth noting that, for all distances, the percentage of errors
in excess of 10 cm on the final model (considered the tolerance limit of the project) is extremely limited. It can be therefore concluded, from the results emerged so far, that the correction system of the orientation parameters is compatible, in terms of obtainable precisions, with the project requirements.
3.3 Analysis of the interior orientation stability
Unfortunately, the influence of climatic conditions on the interior orientation parameters of consumer-grade cameras in close range photogrammetry is scarcely investigated: all the experiences related by analogy to the one under examination, choose to use a temperature-controlled environment making the camera less prone to thermal changes. Anyway, we must consider that the main purpose of the system is to compare digital models acquired at regular intervals and quite close in time, so the problem could be much more severe than it seems. Most likely, acquiring the images at the same time of day, should limit the temperature difference. Equipping the box with temperature sensor and limiting image capture at nearly the same temperature conditions or, alternatively, sending the temperature data to the control station to decide later if use or not the images acquired at too different climatic conditions might be an option. Moreover, an abrupt change in focal length, being an effect that is reflected systematically on all the estimated object points, can be easily highlighted (and partially corrected) by looking at stable areas where zero displacements should be expected.
Another option is to consider all the DoF in eq. [4] (i.e. estimate the full homography matrix) taking into account possible variation in the interior orientation parameters. Even if, at first glance, such solution sounds very promising and efficient, the results (reported in the next chapter) highlights that, in that case, the over-parameterized solution system suffers of numerical instability. On the contrary, quite surprisingly, considering all the interior parameters constant in time seems to produce quite satisfactory results. At present the system trial, with about eight months of processed and compared data, didn’t show any issue connected with changes in focal length. Moreover, during the winter season, when wider temperature ranges should be expected, the landslide body is completely covered by the snow, and the system is unusable.
4. IMAGE PROCESSING WORKFLOW
Upon arrival of new data, all processing units are activated: a centralized server awaits for incoming images from both stations; then the DTM generation sequence starts, as described below:
1.The images are resampled to remove the distortion; 2.Through an interest operator (Bay, Tuytelaars, & Van Gool, 2006) well defined points, located in the more stable areas of the scene, are extracted on both frames; preliminary point pairs are then established, considering a similarity score of their descriptor (Barazzetti, Forlani, Remondino, Roncella, & Scaioni, 2011); these pairs are then filtered by a RANSAC procedure considering as consistent a projective planar
transformation induced by an (unknown) rotation of the support;
3.The transformation is used to resample the input images, removing the effect due to unwanted movement of the box; 4.The new images are used in the matching procedure after epipolar resampling (Pollefeys, Koch, & Van Gool, 1999). The points on the master image are selected always on the same regular grid (commonly with a 2 pixel spacing); 5.To filter vegetation or gross matching errors, every matched point on the master grid are compared with its neighbours: if there is a sudden change in the disparity values (corresponding to an equally sudden change in depth in 3D space) the point is labelled as an outlier and discarded; 6. At the end of the matching step the points extracted are triangulated using the parameters of the reference image orientation;
7. At this point, an automatic comparison module compares the positional data of all the points and produce a false-color map of the displacements measured by the system (see Figure 6, for instance);
8.Simultaneously, the system saves the DSM both as a .txt point cloud and as a triangulated model (.ply format) that can be, if needed, be verified by an operator.
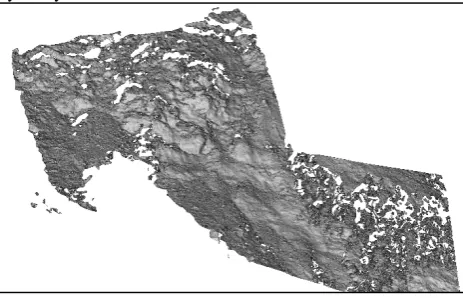
The whole process requires, usually, ca. 15 minutes on a medium performance server with eight processing cores and produces digital models of the surface with an average of 600-700 thousand points (actually the number of measured points is higher, but a part of them is removed by the filtering step). Figure 5 shows an example of a DSM produced automatically by the system.
Figure 5: The DSM of the slope acquired on July 23rd at 1 PM.
5. RESULTS
As a consistency test to evaluate the level of performance achieved by the system, it was decided to produce and compare, either automatically and manually, a series of 20 DSM referring to the time interval that goes from July 10th, 2013 to September 10th, 2013. The DSM were selected, considering the best days and time of the day according to two criteria: first, trying to monitor some periods of consecutive days evenly distributed on the two months period, and then selecting pairs with the higher number of inlier. Comparing consecutive days DSMs, the measurements repeatability can be evaluated: on such short periods the possible landslide displacements can be considered insignificant for the system accuracy level, and the models should not manifest any change. In other words, the differences shown by the comparison should be considered derived by the measurement noise of the system itself. The comparison is presented in Figure 6 in which the false colours represent the distances (absolute differences) between two separate models
separated by four hours. Most of the points are coloured in blue (corresponding to a movement of 2 ÷ 4 cm) with peaks reaching, in some cases (green), ca. 10 cm. It should be noted that usually the maximum discrepancies show up in those areas where the complexity of the object or the presence of shadows makes the matching procedure more troublesome.
Figure 6: Repeatability between two 4-hours separated DSMs.
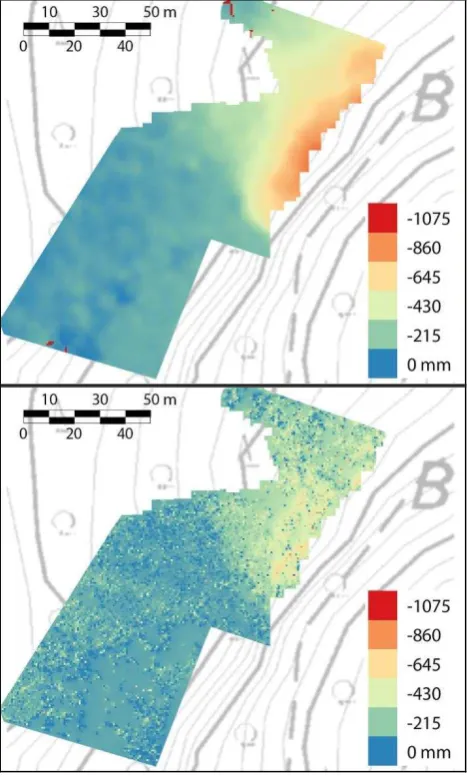
Figure 7: Side by side comparison of displacement maps acquired on the 9th of October. Top: the SAR displacement map. Bottom: the photogrammetric displacement map.
Evaluating the differences point wise (in this case considering the signed distance of more than 600,000 points), and analysing their distribution, some remarks can be made. The data are approximately normally distributed with a mean distance between the two epochs considered in the different comparisons usually not null. A sort of systematic misalignment of the two DSM (surely connected to a non-perfect box movement removal) is encountered quite often. However the mean distance between two epochs is always lower than 2 cm and can be considered negligible if compared to actual system accuracy. Finally, the data extracted daily in a period of time much longer (ca. 4 months during the summer and fall season) were compared with the displacement maps measured by the InSAR system. The latter is certified as a much higher accuracy displacement measuring system, since can identify movements up to some mm.
The interferometer system obviously has also a much higher level of detail and proves indispensable to evaluate the smallest movements or analyse the landslide on limited time intervals. Figure 7 shows the comparison between two displacements maps, roughly at the middle of the monitoring period (October, the 9th). The SAR system monitors a much wider region of the slope, including also areas with vegetation: in the comparison such regions have been removed.
The map shows clearly that the photogrammetric system is much noisier than the SAR; nonetheless, the results are similar and both system achieves the same level of detail for finer and more localized movements.
From a quantitative point of view, a comparison of local displacement values can be more efficient. The SAR system, at each epoch, produces a displacement value for a set of 15
“virtual” points on the slope. Some of them are, luckily, placed
in the same region monitored by the photogrammetric system, and can be used to check the system accuracy. In Figure 8 the plot of the displacements in the analysed period is shown.
Figure 8: Photogrammetry vs. Ground Based SAR in one of the
“virtual” measurement points on the slope.
Even in this comparison the photogrammetric system shows noisier results, but the agreement of the two systems is clear. The mean value of the differences is 35 mm, with a standard deviation of 118 mm. However, the maximum observed difference was more than 40 cm high (the negative peak on the 27th of September in Figure 8): the local, point wise, displacement value can suffer from gross errors and should never be used individually. The system seem to capture the landslide behaviour with an accuracy bettern than expected: computing a moving average also on short time interval (i.e. on
a weekly basis) to remove gross errors and noisy peaks, can produce quite good results.
CONCLUSIONS
The paper presented an innovative stereo-photogrammetry monitoring system to evaluate, on a full-field basis, the movements of a landslide. To this day, very few examples can be found in literature of a similar approach.
The selected testing scenario is one of most important and most
studied landslide of the Alps. Valle d’Aosta Region
administration is investing resources and efforts implementing advanced technologies that should guarantee the highest safety level of its territory. Nonetheless, state of the art methodologies, as for instance Ground-based InSAR, are usually too much expensive to be used diffusely. The proposed monitoring system, on the contrary, it’s very cheap and even if it will never be able of giving, with enough reliability, information on landslide accelerations on an hourly or daily basis, can be effectively used to evaluate accurately global and local behavior on longer periods, especially on smaller slopes. Still, in the near future, a deeper testing stage should be performed, to assess the real performances of the method on the whole landslide extension and make sure that the photogrammetric system is reliable enough over a long period of time.
ACKNOWLEDGMENTS
This research is supported by the Italian Ministry of University and Research within the project “FIRB - Futuro in Ricerca
2010” – Subpixel techniques for matching, image registration and change detection.
The authors would like to thank Michéle Curtaz and all the
FMS and Regione Valle d’Aosta staff, for their priceless
contribution to this research.
REFERENCES
Abellán, A., Jaboyedoff, M., Oppikofer, T., & Vilaplana, J. (2009). Detection of millimetric deformation using a terrestrial laser scanner: experiment and application to a rockfall event. Nat. Hazards Earth Syst. Sci., 9, 365-372.
Barazzetti, L., Forlani, G., Remondino, F., Roncella, R., & Scaioni, M. (2011). Experiences and achievements in automated image sequence orientation for close-range photogrammetric projects. SPIE Optical Metrology. International Society for Optics and Photonics.
Bay, H., Tuytelaars, T., & Van Gool, L. (2006). Surf: Speeded up robust features. Computer Vision–ECCV 2006, 404-417.
Bitelli, G., Dubbini, M., & Zanutta, A. (2004). Terrestrial Laser Scanning and Digital Photogrammetry Techniques to Monitor Landslide Bodies. The International Archives of the Photogrammetry, Remote Sensing and Spatial Information Sciences, Vol. XXXV, Part B5, pp. 246-251. Istanbul (Turkey).
Brown, D. (1971). Close-range camera calibration. Photogrammetric engineering, 37(8), 855-866.
Cardenal, J., Mata, E., Perez-Garcia, J., Delgado, J., Andez, M., Gonzalez, A., & Diaz-de-Teran, J. (2008). Close Range Digital Photogrammetry Techniques applied to Landslide Monitoring. International Archives of the Photogrammetry, Remote sensing and Spatial Information Sciences, Vol XXXVII. Part B8.
Casson, B., Baratoux, D., Delacourt, C., & Allemand, P. (2003). La Clapière landslide motion observed from aerial differential high resolution DEM. Eng. Geol., 68, 123-139.
Colesanti, C., & Wasowski, J. (2006). Investigating landslides with spaceborne Synthetic Aperture Radar (SAR) Interferometry. Eng. Geol., 88, 173-199.
Crosta, G., Cancelli, P., Tamburini, A., Alberto, W., Broccolato, M., Castellanza, R., . . . Leva, D. (2012). Chasing a complete understanding of a rapid moving rock slide: the La Saxe landslide. EGU General Assembly 2012. Vienna, Austria.
Fischler, M., & Bolles, R. (1981). Random sample consensus: a paradigm for model fitting with applications to image analysis and automated cartography. Communications of the ACM, 24(6), 381-395.
Forlani, G., & Pinto, L. (1994). Experiences of combined block adjustment with GPS data. International Archives of Photogrammetry and Remote Sensing, ISPRS Commission III, 30 Part 3/1, pp. 219-226. Munchen.
Forlani, G., & Pinto, L. (2007). GPS-assisted adjustment of terrestrial blocks. Proc. of the 5th Int. Symp. on Mobile
Mapping Technology (MMT’07), (pp. 1-7). Padova.
Hartley, R., & Zisserman, A. (2003). Multiple view geometry in computer vision. Cambridge University Press.
Jacobsen, K. (2004). Direct Integrated Sensor Orientation-Pros and Cons. Proceedings of the XXth ISPRS Congress.
Leva, D., Nico, G., Tarchi, D., Fortuny, J., & Sieber, A. (2003). Temporal analysis of a landslide by means of a ground-based SAR interferometer. IEEE Transactions on Geoscience and Remote Sensing, 41, 745-752.
Monserrat, A., & Crosetto, M. (2008). Deformation Measurement Using Terrestrial Laser Scanning Data And Least Squares 3D Surface Matching. ISPRS Journal of Photogrammetry & Remote Sensing, 63, 142-154.
Mora, P., Baldi, P., Casula, G., Fabris, M., Ghirotti, M., Mazzini, E., & Pesci, A. (2003). Global Positioning Systems and digital photogrammetry for the monitoring of mass
movements: application to the Ca’ di Malta landslide (northern
Apennines, Italy). Eng. Geol., 68, 103-121.
Motta, M., Gabrieli, F., Corsini, A., Manzi, V., Ronchetti, F., & Cola, S. (2013). Landslide Displacement Monitoring from Multi-Temporal Terrestrial Digital Images: Case of the Valoria Landslide Site. In C. Margottini, P. Canuti, & K. Sassa, Landslide Science and Practice (Vol. 2, pp. 73-78). Berlin: Springer-Verlag Berlin Heidelberg.
Pollefeys, M., Koch, R., & Van Gool, L. (1999). A simple and efficient rectification method for general motion. Computer Vision, 1999. The Proceedings of the Seventh IEEE International Conference on. 1, pp. 496-501. IEEE.
Prokop, A., & Panholzer, H. (2009). Assessing the capability of terrestrial laser scanning for monitoring slow moving landslides. Nat. Hazards Earth Syst. Sci., 9, 1921-1928
Scaioni, M., Roncella, R., & Alba, M. (2013). Change detection analysis in Point Clouds: Application to Rock Face Monitoring. PE&RS, 78(5), 441-455.
Travelletti, J., Malet, J., Schmittbuhl, J., Toussaint, R., Bastard, M., Delacourt, C., . . . van Dam, D. (2010). Multi-temporal terrestrial photogrammetry for landslide monitoring. Proceedings of mountain risks international conference, (pp. 183-191). Florence (Italy).