FACTORS OF TAX COMPLIANCE THAT INFLUENCE SMALL
BUSINESS GROWTH IN KZN
By
Yergenthren Naicker Student Number: 203517445
A dissertation submitted in partial fulfilment of the requirements for the degree of:
MASTER OF ACCOUNTANCY
In the School of Accounting, Economics and Finance Supervisor: Dr Rajendra Rajaram
February 2018
i Declaration I, Yergenthren Naicker, declare that
i) The research reported in this thesis, except where otherwise indicated, is my original research.
ii) This thesis has not been submitted for any degree or examination at any other university.
iii) This thesis does not contain other persons’ data, pictures, graphs or other information, unless specifically acknowledged as being sourced from other persons.
iv) This thesis does not contain other persons’ writing, unless specifically acknowledged as being sourced from other researchers. Where other written sources have been quoted, then:
(a) their words have been re-written but the general information attributed to them has been referenced;
(b) where their exact words have been used, their writing has been placed inside quotation marks, and referenced.
v) This thesis does not contain text, graphics or tables copied and pasted from the Internet, unless specifically acknowledged, and the source being detailed in the thesis and in the References sections.
Signature__________________________Date_____________________________
Yergenthren Naicker (Student)
Signature__________________________Date_____________________________
Dr. Rajendra Rajaram (Supervisor)
ii
Acknowledgments and dedication I would like to thank:
My father, Mr Roy Naicker, for all that you have done for me. You have never doubted in my ability and have always supported me throughout my life and career. Nothing in my life was possible without you and your guidance. Although you are no longer with us, you are still my inspiration and motivation in life, and this is dedicated in your memory.
My mother, Mrs Dolly Naicker, for her unconditional love and for all that she has done for me over the course of my life. Without you, I could have not have achieved this and I thank you.
My partner, Ms Prisha Harigen, for your love, patience and being there for me when I needed you the most. You have been my pillar of strength. Thank you for always believing in me and for all the sacrifices you have made.
My supervisor and friend, Dr Rajendra Rajaram, for his guidance, wisdom and never-ending support from the beginning. You have been a perfect role model and inspiration and have always provided support throughout the study.
My colleagues and friends from the MACC class of 2017. Thank you all for contributing towards a wonderful learning environment. I have learnt a lot from you all. A special thank you to Mr Jugjith Deodutt who co-ordinated our MACC program and provided us with valuable resources in order to complete our studies.
Mr friend and colleague, Dr Sanjay Soni for all the advice, support and mentorship throughout this study. Your patience with me is much appreciated.
My friends, Mr Amit Anandlal and Mr Pavane Chetty for the support and encouragement during the course of my studies. Your help throughout this process has been invaluable.
iii Abstract
Small and medium enterprises play an important role for South Africa. They serve as a vehicle in creating jobs for local communities. KwaZulu-Natal (KZN) is the second largest province in the country and the necessity of developing sustainable small and medium businesses cannot be overemphasized. The South African government has identified and made the development of small businesses as one of their strategic objectives.
Despite the importance of these businesses for the country and province, there are many challenges that these businesses face. One of the most onerous and time- consuming challenges is tax compliance. Tax compliance was defined as the preparation, submission and payment of taxes due within the specified time periods and in order to achieve the objectives set out by government, it is necessary that the tax systems for small businesses be efficient and simplified in order to meet the needs of the sector.
The research has been undertaken to determine if tax compliance is a factor which has negatively influenced businesses in KwaZulu-Natal.
The literature review suggested that tax compliance is a significant factor for small businesses and the current system of taxation is ineffective. The research design was quantitative in nature. A questionnaire was completed by eighty-five small business owners and these findings were statistically analyzed.
The empirical research indicated that small business owners perceive tax as a threat for business growth and sustainability. In addition, these business owners also feel that the current initiatives introduced by the South African Revenue Services (SARS) is not helping to address the problems with compliance and they require more from the government and the SARS. The findings from this study will assist the SARS in understanding the specific challenges that small and medium business face and help to improving the current tax policies for small businesses.
iv Table of contents
Declaration ... i
Acknowledgments and dedication ... ii
Abstract ... iii
List of figures ... viii
List of tables ... x
CHAPTER ONE: OVERVIEW OF THE STUDY ... 1
1.1 Introduction ... 1
1.2 Context of the study ... 1
1.3 Problem statement ... 3
1.4 Aim and objectives ... 3
1.5 Research design ... 4
1.6 Limitations of this study ... 4
1.7 Outlines of the study ... 5
1.8 Conclusion ... 6
CHAPTER 2: LITERATURE REVIEW ... 7
2.1 Introduction ... 7
2.2 Small and medium sized businesses ... 7
2.3 The importance of small and medium enterprises ... 12
2.4 The profile of SMEs in South Africa ... 15
2.4.1 Distribution of small and medium enterprises in South Africa ... 15
2.4.2 Small and medium enterprises by economic sector ... 16
2.4.3 Demographic distribution of SMEs ... 16
2.4.4 The financial profile of SMEs ... 16
2.5 Provincial statistics and unemployment in South Africa ... 17
v
2.6 Challenges faced by small businesses ... 19
2.7 Tax compliance for small businesses ... 23
2.7.1 Importance of taxation ... 23
2.7.2 Value-Added Tax (VAT) ... 24
2.7.3 Corporate income tax ... 25
2.7.3.1 Corporate income tax on different business types (Partnerships and Sole proprietors) ... 25
2.7.3.2 Sole proprietor ... 26
2.7.3.3 Partnership ... 26
2.7.4 Provisional tax ... 26
2.7.5 Employees tax ... 26
2.8 Challenges in tax compliance ... 28
2.9 Tax compliance costs ... 29
2.10 Tax relief initiatives for small and medium businesses ... 34
2.10.1 Small business corporation tax (SBC) ... 35
2.10.2 Favorable and graduated tax rates ... 36
2.10.3 Accelerated depreciation allowances ... 36
2.10.4 Turnover tax... 37
2.11 Reasons for tax relief initiatives not being utilized ... 39
2.12 Theories of tax compliance ... 41
2.12.1 Economic based theories ... 41
2.12.2 Psychology theories ... 41
2.13 Conclusion ... 41
CHAPTER THREE: RESEARCH METHODOLOGY ... 43
3.1 Introduction ... 43
3.2 Research problem ... 44
3.3 Research objectives ... 45
vi
3.4 Nature of the research ... 45
3.5 Target population ... 45
3.6 Sample size ... 47
3.7 Ethical considerations ... 48
3.7.1 Informed consent ... 48
3.8 Data collection and research instrument ... 49
3.9 Questionnaire design ... 49
3.10 Reliability and validity ... 51
3.11 Data Analysis ... 52
3.12 Conclusion ... 53
CHAPTER FOUR: RESEARCH FINDINGS ... 54
4.1 Introduction ... 54
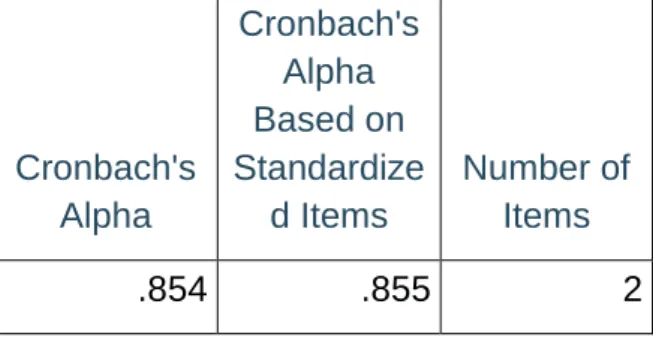
4.2 Cronbach’s Alpha ... 55
4.3.1 Personal details of interviewee ... 56
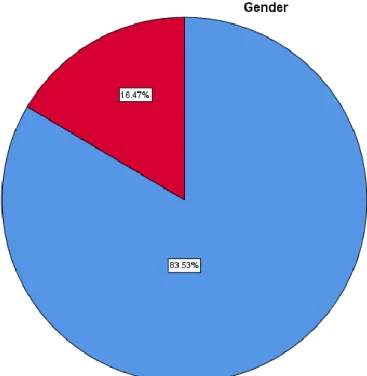
a. Gender ... 56
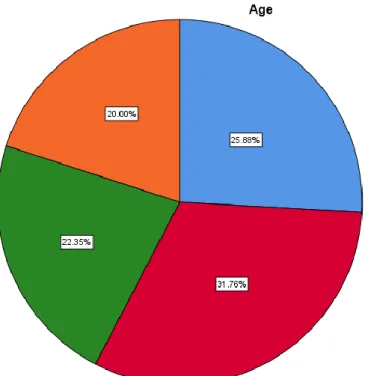
b. Age ... 57
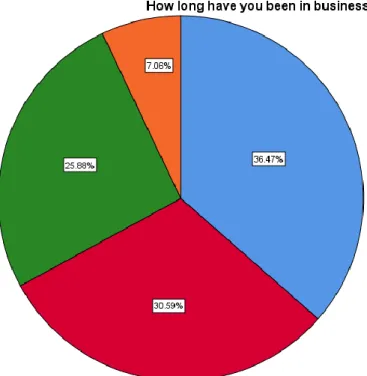
c. Length of time in business ... 58
d. Business type ... 59
4.3.2 Registration of taxes ... 60
a. Income tax registration of business ... 60
b. Provisional tax registration of business ... 61
c. Value-added tax (VAT) registration of business ... 62
d. Employees tax registration of business ... 63
4.3.3 Ranking of complexity of taxes ... 64
a. Income tax ... 64
b. Provisional tax... 65
c. VAT ... 66
vii
d. Employees tax ... 67
4.4 Two-step cluster analysis ... 68
4.5 Do you understand tax legislation? ... 75
4.5.1 Factors of tax compliance ... 76
a. Is preparation and submission of tax returns timeously a challenge? ... 76
b. Is time spent dealing with SARS a negative factor? ... 77
c. Is the payment of monies to SARS within stipulated times a challenge? .. 78
d. Are inflexible regulations pertaining to small businesses a challenge for compliance? ... 79
e. Are complex returns considered a challenge for tax compliance? ... 80
4.5.2 Costs of compliance and issues pertaining to compliance... 81
a. Which cost is considered most excessive to ensure tax compliance? ... 81
b. Are business owners aware of tax relief initiatives for small businesses? 82 c. Do small business owners utilize tax relief initiatives? ... 83
d. Do you utilize SBC rates? ... 84
e. Do you utilize turnover tax? ... 85
f. Why do you not utilize the initiatives? ... 86
4.5.3 Have initiatives been successful in assisting with tax compliance? ... 87
4.5.4 Should more tax relief initiatives be introduced? ... 88
4.6 Descriptive Statistics ... 90
4.7 The Kolmogorov Smirnov test and the Shapiro-Wilk test ... 91
4.8 Hypothesis Testing ... 92
4.8.1 Chi Square Test ... 93
4.8.2 One sample t test ... 93
4.9 Conclusion ... 94
CHAPTER FIVE: RECOMMENDATIONS, CONCLUSION, LIMITATIONS AND AVENUES FOR FURTHER RESEARCH ... 96
5.1 Introduction ... 96
viii
5.2 Overview of the study ... 96
5.3 Achievement of research objectives ... 96
5.3.1 Research objective 1 ... 96
5.3.2 Research objective 2 ... 97
5.3.3 Research objective 3 ... 98
5.4 Recommendations ... 98
5.5 Limitations of the study ... 99
5.6 Areas for future research ... 99
5.7 Conclusion ... 100
References ... 101
Appendices Appendix 1 – Questionnaire 107
Appendix 2 – Informed consent 110
Appendix 3 – Ethical clearance 111
List of figures Figure 4.1 Gender 56
Figure 4.2 Age 57
Figure 4.3 Length of time in business 58
Figure 4.4 Business type 59
Figure 4.5 Income tax registration of business 60 Figure 4.6 Provisional tax registration of business 61
Figure 4.7 VAT registration of business 62
Figure 4.8 Employee tax registration of business 63 Figure 4.9 Income tax ranking 64
ix
Figure 4.10 Provisional tax ranking 65
Figure 4.11 VAT ranking 66
Figure 4.12 Employees tax ranking 67
Figure 4.13 Two-step cluster analysis 69
Figure 4.14 Cluster one 70
Figure 4.15 Cluster two 71
Figure 4.16 Cluster three 72
Figure 4.17 Cluster four 73
Figure 4.18 Cluster five 74
Figure 4.19 Business owners understanding of tax legislation 75 Figure 4.20 Preparation and submission of tax returns 76
Figure 4.21 Time spent at SARS 77
Figure 4.22 Payment of monies within stipulated time periods 78 Figure 4.23 Inflexible regulations for small businesses 79
Figure 4.24 Complex returns 80
Figure 4.25 Most excessive costs 81
Figure 4.26 Aware of tax relief initiatives 82
Figure 4.27 Do businesses utilize tax relief initiatives? 83
Figure 4.28 Do businesses utilize SBC rates? 84
Figure 4.29 Do you utilize turnover tax? 85
Figure 4.30 Why do you not utilize the initiatives? 86
Figure 4.31 Have initiatives been successful? 87
Figure 4.32 Should more tax relief initiatives be introduced? 88
x List of tables
Table 1.1 Outline of the study 5
Table 2.1 Thresholds for the classification for micro, very small, small and
medium enterprises 11
Table 2.2 The role and size of small and medium enterprises. 14 Table 2.3 Small, medium and micro enterprises by province 15 Table 2.4 Mid-year population estimates by province 17 Table 2.5 Advantages and disadvantages of being registered for tax 28 Table 2.6 Average cost of compliance for small businesses 32 Table 2.7 Rates of taxation applicable to small business corporations 36 Table 2.8 Rates of turnover tax for the period ending 28 Feb 2018 38 Table 4.1 Cronbach’s Alpha: Factors of tax compliance 55 Table 4.2 Cronbach’s Alpha: Tax relief initiatives for small businesses 55
Table 4.3 Results of gender of respondents 56
Table 4.4 Results of the age of respondents 57
Table 4.5 Results of length of time in business 58
Table 4.6 Results of business type of respondents 59 Table 4.7 Results of the businesses registered for income tax 60 Table 4.8 Results of businesses registered for provisional tax 61 Table 4.9 Results of businesses registered for VAT 62 Table 4.10 Results of businesses registered for employees tax 63
Table 4.11 Ranking of income tax complexity 65
Table 4.12 Ranking of provisional tax complexity 66
Table 4.13 Ranking of VAT complexity 67
xi
Table 4.14 Ranking of employees tax complexity 68
Table 4.15 Understand tax legislation 75
Table 4.16 Preparation and submission of tax returns 76
Table 4.17 Time spent at SARS 77
Table 4.18 Payment of monies within stipulated times 78 Table 4.19 Inflexible regulations for small businesses 79
Table 4.20 Complex returns 80
Table 4.21 Most excessive costs 81
Table 4.22 Aware of tax relief initiatives 82
Table 4.23 Do businesses utilize tax relief initiatives? 83
Table 4.24 Do you utilize SBC rates? 84
Table 4.25 Do you utilize turnover tax? 85
Table 4.26 Reasons for not utilizing tax relief initiatives 86
Table 4.27 Success of tax relief initiatives 87
Table 4.28 Should more relief initiatives be introduced? 89
Table 4.29 Descriptive statistics 90
Table 4.30 Kolmogorov Smirnov and Shapiro-Wilk test 92
Table 4.31 Chi square test 93
Table 4.32 One sample t test 94
1 CHAPTER ONE: OVERVIEW OF THE STUDY 1.1 Introduction
The first chapter presents an overview of the study. The chapter commences with a context of the study by highlighting the progress of South Africa since 1994 and addressing the importance of small and medium businesses in achieving the South African government’s strategic objectives. Small and medium businesses are required to comply with all the relevant tax laws, however the requirement of tax compliance for these businesses has become an increasingly serious challenge.
Research on tax compliance in South Africa has been done, however there has been limited research from a provincial perspective. KwaZulu-Natal is one of the largest provinces in the country and the need to understand the effects of tax legislation on the small business sector is important. The chapter defines the problem statement and lists the aims and objectives of the study. The research methodology adopted together with limitations of the study are also briefly presented. The chapter concludes with a tabulation of the contents of each chapter.
1.2 Context of the study
South Africa is a country that was previously dominated by coloniasm, racism, apartheid, sexism and repressive labour practices. The aftermath of the apartheid policies and practices has resulted in an unequal distribution of income, poverty and degradation amongst many South Africans. After the first democratic elections in 1994, one of the top priorities of the newly elected government was to address the need to reduce poverty in South Africa. (African National Congress, 1994)
Since 1994, the country has made exceptional headway in addressing some of these issues. The endorsement of the Constitution, setting up of institutions of democracy, and transformation of multiple institutions has paved the way for a new nation resulted in improved facilities including education, medical services, housing, water and electrification for many citizens. However, despite all the positive progress that has been accomplished, there were still some serious shortcomings in the development of the country. Millions of South Africans continued to remain unemployed and a large number of households were living close to the poverty line. As a result of these
2
shortcomings, the South African President, in 2010, appointed the National Planning Commission to establish a vision and national development plan. One of the essential objectives of this vision and plan is to eliminate poverty in the country by the year 2030. Increasing employment is considered to be the most viable solution to assist in eliminating poverty and to reduce the significant levels of inequality that the people of South Africa are faced with. The National Planning Commission is focused on expanding a robust, innovative and entrepreneurial economy. (National Planning Commission, 2011)
Small and Medium Enterprises are perceived to be one of the most effective mechanisms to assist economies in prospering and growing. Small businesses aid the creation of sustainable employment, contributes to an economies gross domestic product and assists with numerous other forms of economic and social development.
(Krasniqi, 2007). Therefore, developing, nurturing and sustaining small businesses is one of the key strategies identified to assist in alleviating poverty and generating meaningful employment together with creating sustainable incomes for communities.
(Dockel & Ligthelm, 2002).
Smaller and medium sized businesses however, do suffer from increased resource constraints and the amount of regulations needed to comply with are considered as a continuing constraint on business operations (Moody (2001) as cited in Hasseldine &
Hansford (2002)). These smaller businesses face many risks, which threatens their existence as a going concern. The majority of South African small and medium sized businesses rarely survive and last for an average of three and a half years. Regulatory compliance costs are considered substantial and a large amount of valuable resources are consumed in order to ensure that these businesses in South Africa remain compliant with all the applicable laws and regulations. Alternative utilisation of these valuable resources may have been focused on advancing, promoting and bolstering business in the both the local and international context however, they are used for the excessive compliance requirements. (SBP, 2004)
One of the several issues that influence the overall regulatory environment for small and medium enterprises is tax compliance (SBP, 2003). Tax compliance issues are believed to be some of the most time consuming and troublesome regulations for SMEs in the country and the largest portion of regulatory compliance costs and
3
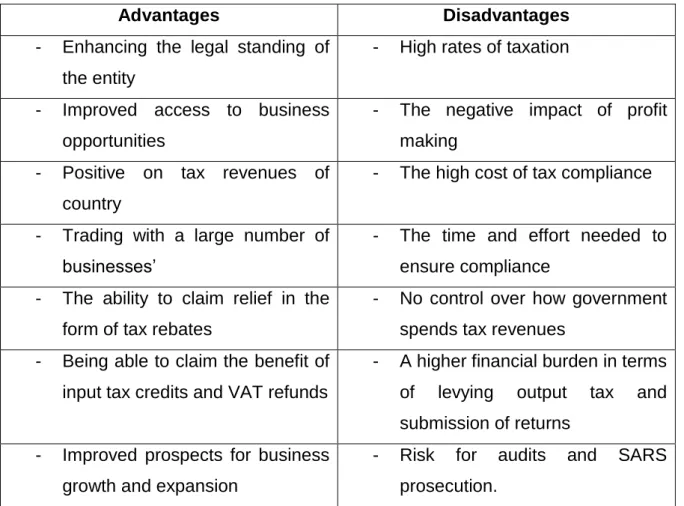
resources are directly attributable at ensuring tax compliance. (SBP, 2004). Tax compliance is perceived as a large regulatory expense and burden that disparages small-scale entrepreneurs (Junpath, et al., 2016), and smaller businesses are reluctant to enter into the formal economy by registering for tax. Despite the many advantages such as access to finance, improved access to business opportunities and improved legal standing of the business registering for tax now implies falling into the tax system (Junpath, et al., (2016) and Govender (2008). One of the main reasons for this reluctance is the complexity of tax systems and the relevant costs associated with compliance (SBP, 2003).
1.3 Problem statement
The cost and complexity of tax compliance for small, medium and micro enterprises in the country has been highlighted by the National Treasury and South African Revenue Services (SARS) as an important matter (Govender, 2008).
In KwaZulu-Natal, the failure rate of small businesses is extremely high, with a large proportion of them not developing into established firms. (Olawale & Garwe, 2010).
This is contrary to the strategic objectives set out by the national government. One of the main reasons for business failure is the excessive regulatory burdens that are placed on small businesses. Although there has been literature on tax compliance and the costs associated with compliance, there has been limited research about the influence of tax compliance on the small business sector especially in KwaZulu Natal.
The study will answer the question “Is tax compliance a factor which negatively influences business performance and growth”.
1.4 Aim and objectives
This study aims to identify the tax compliance challenges for SMEs in KZN as well as to evaluate if current tax relief initiatives are effective.
The objectives of the study were to:
Identifying the specific taxes that small and medium businesses in KwaZulu Natal consider most complex and challenging.
4
Determining the specific challenges, complexities and costs in respect of tax compliance for small and medium business in KwaZulu Natal.
Determining if tax relief initiatives introduced by SARS have been successful at addressing compliance challenges for small businesses.
1.5 Research design
The research objectives were met by utilising a quantitative approach. A questionnaire was used to evaluate the perceptions of tax compliance from small business owners.
Permission to distribute the questionnaire to the small businesses was obtained from the accounting practitioners of these businesses. Ethical clearance was obtained from University of KwaZulu Natal’s Humanities and Social Science Research Ethics Committee. The questionnaire had a total of sixteen questions and was manually distributed to 216 small and medium business owners who had met the definition of an SME as defined in the study. A total number of eighty-five business owners completed and returned the questionnaire on or before the due date.
The questionnaires were first reviewed for completeness and accuracy before being analysed. Descriptive statistics which included the mean, median, mode, standard deviation and variances were calculated.
In chapter two a literature review highlighting the significance of small and medium sized businesses as well as the taxes that these business are exposed to will be presented. The chapter will also focus on tax compliance and some of the challenges faced by small and medium sized businesses in respect of compliance. To determine the rankings and complexities of tax, cross tabulations were used. A two-step cluster analysis was also used to evaluate the complexity of taxes in respect of business types. The hypothesis devised in chapter three was also tested using Chi Square test and a one sample t test.
1.6 Limitations of this study
The limitations of the study were as follows:
a) The research sample was limited to the location involved in the study.
b) The response rate to the questionnaires were approximately 40%.
5
c) Only formally registered businesses that had accountants were used in the study.
No informal businesses were used.
The research sample was limited due to the location and number of respondents involved in the study. The sample was obtained from three accounting practices in the Pietermaritzburg area. These three practices did have clients across the province that participated in the study but the majority of respondents where from the Pietermaritzburg area.
Any significant results may not be necessarily generalizable across the province but will add value by giving policy makers a clear indication of what the major tax compliance issues are in the province.
1.7 Outlines of the study
The study has been arranged in five chapters as reflected in Table 1.1.
Table 1.1: Outline of the study
CHAPTER CONTENT
1 Chapter one highlights the overall context of the study. The study is contextualised and filters into the development of the problem statement. In addition the aim and research objectives are presented.
The research design and limitations of the study are also briefly explained.
2 Chapter two is a review of existing literature of small and medium businesses as well as tax compliance. The gap in literature identified is the justification of undertaking the empirical research.
3 Chapter three contains the methodology used to achieve the research objectives of the study, detailing the research design, nature, sample frame, research instrument and relevant sample size.
4 Quantitative analysis of the data is presented and analysed in chapter four. The objectives of the research and hypotheses developed in the previous chapter are also evaluated using the methodology that was devised.
5 Chapter five of the research summarises the results derived from the study, relating this to the objectives, with concluding remarks, limitations and recommendations.
6 1.8 Conclusion
Chapter one presented the context for the study. SMEs play a pivotal role in society and for communities especially in KwaZulu-Natal. Small and medium businesses are a means of addressing the unemployment and poverty challenges in the country.
Despite the significance, regulatory compliance is a significant challenge for these smaller businesses. This study has sought to identify if tax compliance is a significant factor which negatively influences business growth in the province. The first chapter has presented the objectives, research methodology adopted as well as any limitations. An outline of the study highlighting the purpose of each chapter is also presented in this chapter.
Chapter two which is presented next, commences with a review of the existing literary work pertaining to small and medium businesses and tax compliance.
7 CHAPTER 2: LITERATURE REVIEW 2.1 Introduction
Chapter one presented an overview of the study, which highlighted the significance of small and medium businesses. These businesses play a pivotal part in the economies of numerous societies, countries and governments, and thus the focal point of governments is on the improvement of the small business sector to enhance economic growth (Olawale & Garwe, 2010). Small and medium enterprises generally provide the only realistic opportunities of employment in rural areas for developing countries, and governments worldwide strongly encourage entrepreneurship to assist with job creation and poverty alleviation. (IMF, 2007)
Whilst there are numerous small and medium businesses that emerge, a large proportion of them do not survive (Ladzani & van Vuuren, 2002). Reasons of failure vary for many different reasons but one of the most common problems is the heavy regulatory burdens placed on these small and medium businesses.
2.2 Small and medium sized businesses
In South Africa, approximately ninety one percent (91%) of formal business entities are small and medium sized entities. These entities contribute between fifty two percent (52%) and fifty-seven percent (57%) to gross domestic product (GDP) and provide about sixty one percent (61%) to employment (Abor & Quartey, 2010). The importance of small and medium sized businesses’ to the economy is stressed by these statistics as they are a major contributor to gross domestic product (GDP) and employment. A successful economy is strongly driven and influenced by the generation, success and sustainability of SMEs and in South Africa, all stakeholders and political parties unanimously agree on the significance of promoting the establishment of SMEs as well as facilitating their growth. (Small Business Project, 2003)
Although there is general agreement that the small and medium size business market is significant in size and is important to economic growth, the definition of small and medium sized entities differs amongst many countries across the world. The definition
8
of small and medium sized businesses becomes problematic because of their diversity in different economies, countries, industries and business sectors (Nkwe, 2013). Small and medium sized businesses could possibly range from part time businesses with no employees to incorporated businesses with many employees. They could also fall in the parameters of rapid growing firms to exclusive private family firms that have not been altered in a long time (Tambunan & Xiangfeng , 2006)
Abor & Quartey, (2010) have also concluded that there is no single uniform definition of small and medium sized enterprises but the most commonly used definitions are based on the number of employees, total revenue and total assets. In practice, in South Africa and across the world, the number of employees and turnover bands generally provide the best guidance on the definition of what an SME is.
A common definition of small and medium sized entities worldwide is registered businesses with less than two hundred and fifty (250) employees. (IFC, 2010). The European Union also designates small and medium business as having two hundred and fifty employees (250) or less. However, in the United States, small and medium businesses are considered to be firms with fewer than five hundred (500) employees (OECD, 2005), and in China, the definition also includes number of employees, revenue and total assets of a company. Generally, a smaller enterprise in China is considered as an entity having fewer than three hundred (300) employees. (Xiangfeng, 2008).
In common with the other European countries, the Ministry of Economy in the Czech Republic also uses guidelines to classify businesses into petty, small and medium sized enterprises. Ordinarily, these businesses use a range of ten to two hundred and fifty (10 – 250) employees, assets in the range of two million euros to forty three million euros, and turnover that does not exceed fifty million euros. (Ponorica & Al-Saedi, 2015).
In Africa, Nigeria also defines SMEs using turnover and net asset value as a guide.
Businesses with a turnover generally not exceeding five million Naira (Atawodi &
Ojeka, 2012), and in Botswana, SMEs are businesses which have between six (6) and one hundred (100) staff and turnovers ranging between sixty thousand Pula and five million Pula. (Nkwe, 2013)
9
In South Africa, The National Small Business Act of 1996 defines a ‘small business’
as follows:
“… a separate and distinct business entity, including co-operative enterprises and nongovernmental organizations, managed by one owner or more which, including its branches or subsidiaries, if any, is predominantly carried on in any sector or sub sector of the economy mentioned in column I of the Schedule.’’
Smaller businesses can be classified as micro, very small, small or medium enterprises. In South Africa, the National Small Business Act defines the thresholds under which small businesses can be classified. (DTI, 2008)
Business Sectors in South Africa
Size Full time
staff complement
Average Yearly Revenue
(Rm) (Less
than)
Total Asset Value (fixed property excluded)
(Rm) (Less
than)
Agriculture Medium
Small Very small Micro
100 50 10 5
5.00 3.00 0.50 0.20
5.00 3.000
0.50 0.10 Mining and Quarrying Medium
Small Very small Micro
200 50 20 5
39.00 10.00 4.00 0.20
23.00 6.00 2.00 0.10
10
Manufacturing Medium
Small Very small Micro
200 50 20 5
51.00 13.00 52.00 0.20
19.00 5.00 2.00 0.10 Electricity, Gas and
Water
Medium Small Very small Micro
200 50 20 5
51.00 13.00
5.10 0.20
19.00 5.00 1.90 0.10
Construction Medium
Small Very small Micro
200 50 20 5
26.00 6.00 3.00 0.20
5.00 1.00 0.50 0.10 Retail and Motor Trade
and Repair Services
Medium Small Very small Micro
200 50 20 5
39.00 19.00 4.00 0.20
6.00 3.00 0.60 0.10 Wholesale Trade,
Commercial Agents and Allied Services
Medium Small Very small Micro
200 50 20 5
64.00 32.00 6.00 0.20
10.00 5.00 0.60 0.10 Catering,
Accommodation and other trade
Medium Small Very small Micro
200 50 20 5
13.00 6.00 5.10 0.20
3.00 1.00 1.90 0.10
11 Finance and Business
Services
Medium Small Very small Micro
200 50 20 5
26.00 13.00 3.00 0.20
5.00 3.00 0.50 0.10 Community, Social and
Personal Services
Medium Small Very small Micro
200 50 20 5
13.00 6.00 1.00 0.20
6.00 3.00 0.60 0.10 Transport, Storage and
Communication
Medium Small Very small Micro
200 50 20 5
26.00 13.00 3.00 0.20
6.00 3.00 0.60 0.10
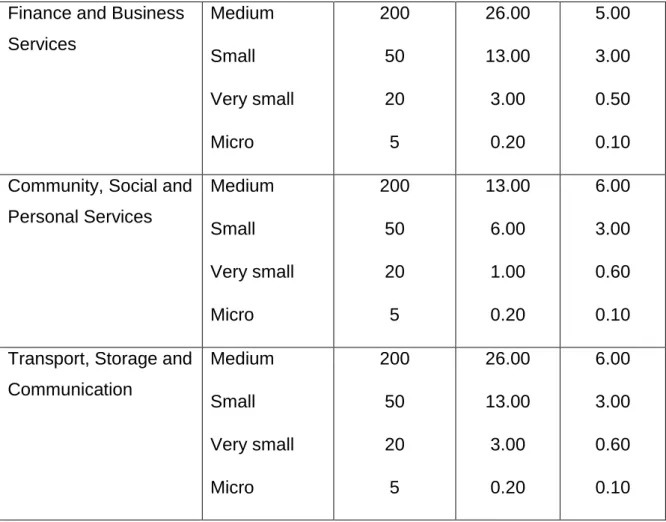
Table 2.1: Ranges for the designation micro, very small, small and medium enterprises
Source: Schedule 1 to the National Small Business Act of 1996, as revised by to the National Small Business Act as amended in 2003 and 2004. (Department of Trade and Industry, 1996)
Table 1.2 is a summary of the different ranges for the division for micro, very small, small and medium enterprises in the country. The different industries have different thresholds for number of staff, revenue and total assets. From the above table, the number of full time employees ranges from a minimum of five (5) employees for micro businesses to two hundred (200) for medium enterprises, turnover ranges from two hundred thousand rands (R200 000) to sixty four million rands (R64 000 000) and total assets range from one hundred thousand rands (R100 000) to twenty three million rands (R23 000 000). In each sector a classification is made for, micro, very small, small and medium enterprises.
12
Across the globe, many different definitions are used as there is no single data source that has all of relevant information at a given point in time (Gale & Brown, 2013). In this study, SMEs will be defined with reference to only the employee and revenue thresholds mentioned above. For this study a SME is defined as an enterprise with a revenue in the range of R70 000 and R20 000 000 and businesses employing between five (5) and two hundred (200) people.
2.3 The importance of small and medium enterprises
The growth of any economy relies heavily on the advancement of SMEs. There is an ever increasing recognition of the importance that SMEs play in the expansion of economies and societies. SMEs are job creators and are the engines of the economy.
(Abor & Quartey, 2010). Formal and informal businesses constitute approximately eighty to ninety percent (80 – 90 %) of the workforce and also contibutes to over fifty percent (50%) of gross domestic product (GDP) on average in many developed countries (Ponorica & Al-Saedi, 2015). The South African government has identified the small and medium business sector as one of the most viable means to improve job creation and generate future prosperity in the country (Llyod, 2002), and small business improvement is a significant feature in the countries economic development, poverty reduction and employment creating plan which is in line with the National Development Plan (DTI, 2008).
Economic growth, employment and wealth creation are generally the key factors for which SMEs are recognised (Booysens, 2011). SMEs make a significant contribution to GDP and a provides a bigger hand in creating work for South Africans (DTI, 2008) and the main source of job creation, development and innovation is generally perceived to be new businesses (Morteza Azimadeh, et al., 2013). In addition, small and medium businesses are considered to be much more flexible, they provide new services and products quickly and efficiently. These small and medium sized businesses are also able to apply robust solutions to the everchanging market conditions (Bondoc & Hagiu, 2011).
Small and medium sized businesses have a number of benefits which include, growing employment at a faster rate than the larger corporations, increasing the competitiveness of the market and reducing the monopolsitc strong holds of the large
13
corporates and they also promote and foster a culture of innovation and entrepeneurial skill (Todd & Javalgi, 2007). In South Africa, there is a much emphasis that is placed on the potential of small and medium sized businesses to generate employment and assist in the alleviation of poverty which is in one the key startegies of the national development plan (Booysens, 2011).
The South African government invests heavily in the creation and sustainability of SMEs. The government specifically pinpointed small business development as the opportunity to address the challenges of employment creation, fiscal and commercial expansion and equity redistribution in the country (Peters & Naicker, 2013). A number of initiatives have been aimed at growing and supporting the small and mediums sized business sector and a number of support agencies including Ntsika, subsequently replaced by SEDA (Small Enterprise Development Agency) were introduced. Financial support included Khula Enterprise Finance and the Apex Fund that provides micro finance loans. Some of the measures introduced in terms of policies were The National Small Business Act which was passed in 1996 and the BEE Code of Good Practice (SBP, 2009).
Not only in South Africa, but internationally, governments assist small and medium businesses. In the United States of America (USA), most employers are small and medium sized businesses and most employees are employed by these businesses (Gale & Brown, 2013). In Europe, small and medium sized enterprises have an important role in the welfare of local and regional societies and communities. Strategy Europe 2020 recognises that small and medium businesses aid in contributing to the economic development and robustness of European economies (Bondoc & Hagiu, 2011). In China, small and medium businesses account for more than ninety nine percent (99%) of all enterprises in China. These SMEs contribute at least sixty percent (60%) of the countries gross domestic product (GDP) and is responsible for generating more than eighty two percent (82%) of the employment opportunities in the country (Xiangfeng, 2008).
14 The role and size of SMEs
Arrangement of SMEs (% of SMEs)
SME Contribution
Country Year Micro Small Medium SMEs
per 1000 people
SME employment
(% total)
Austria 2004 86 12 2 31 65
Belgium 2003 96 3 1 42 69
Bulgaria 2003 90 8 2 28 79
Finland 2003 94 5 1 42 59
United Kingdom
2004 95 4 1 74 39
Poland 2001 99 - 1 43 67
Sweden 2005 96 3 1 99 39
United States
2004 78 20 1 20 51
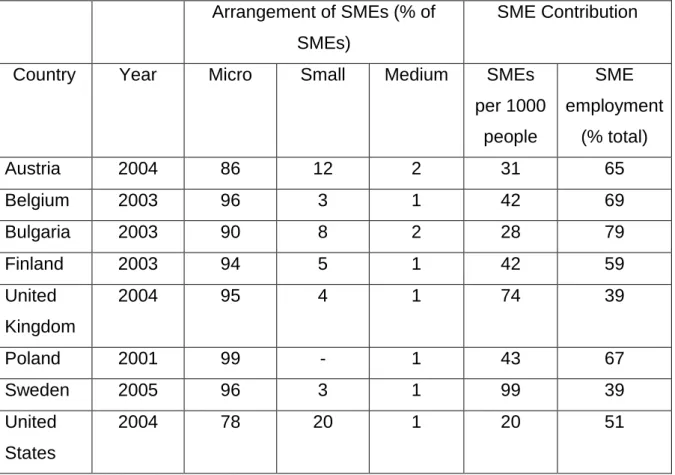
Table 2.2: The role and size of small and medium enterprises.
Source: Micro, Small, and Medium Enterprises: A Collection of Published Data, International Finance Corporation (IFC), Washington D.C. (2007)
Table 2.2 provides a brief summary of the situation in Europe and America. This information illustrates the importance of the different sub groups of small and medium sized enterprises as well as the significant part they play in contributing to employment. The contribution to employment is quite significant to many European countries. In Austria, Belgium, Bulgaria and Poland, small and medium enterprises contribute to over sixty percent (60%) of all jobs. In the United States, these businesses contribute to over fifty percent (50%) of employment. In the United Kingdom and Sweden, businesses contribute to almost forty percent (40%) of employment. These statistics indicate how important SMEs are highlight the contributions made towards employment.
15 2.4 The profile of SMEs in South Africa
The following subsection of this chapter provides an overview of the SME sector in the country.
2.4.1 Distribution of small and medium enterprises in South Africa
SMES Number (2008 Q1) Number (2015 Q2)
Total Formal Informal Other Total Formal Informal Other Total 2 182 823 666 501 1 420 933 95 389 2 251 821 667 433 1 497 860 86 528 Western
Cape
223 933 114 976 95 212 13 745 230 324 110 107 110 188 10 030
Eastern Cape
218 865 56 579 154 631 7 655 197 366 50 670 141 739 4 957
Northern Cape
29 894 11 450 11 768 6 676 20 611 8 534 9 058 3 019
Free State
114 949 31 040 76 127 7 783 96 846 26 224 60 816 9 806
KwaZulu Natal
418 406 102 591 289 347 26 468 373 434 74 976 283 165 15 293
North West
109 860 25 817 76 855 7 188 112 856 27 430 79 153 6 273
Gauteng 687 556 270 093 405 180 12 283 785 321 306 231 465 100 13 989 Mpumal
anga
193 259 29 760 156 814 6 685 185 399 35 208 141 129 9 063
Limpopo 186 101 24 193 155 001 6 907 249 663 28 054 207 512 14 098
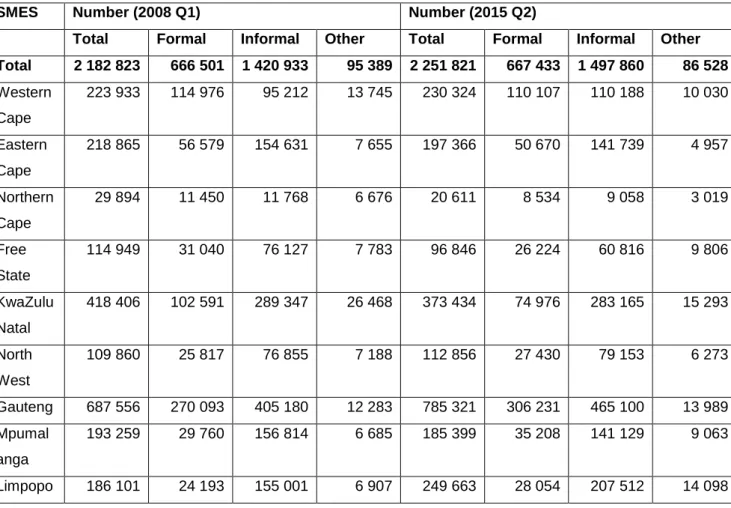
Table 2.3: Small, medium and micro enterprises by province Source: Stats SA, 2016
Table 2.3 illustrates the distribution of SMEs between the nine provinces of the country between 2008 and 2015. Overall the number of small and medium businesses increased from 2 182 823 to 2 251 821 business over the seven year period which represents an increase of only three percent (3%). This increase is significantly less than the fourteen percent 14% increase in gross domestic product over the same time frame. Limpopo and Gauteng had the biggest growth rate in its number of businesses
16
with thirty-four percent (34%) and fourteen percent (14%) respectively. The Northern Cape and Free State lost the biggest percentages of businesses with thirty one percent (31%) and sixteen percent (16%) respectively. KwaZulu-Natal lost a total of 44 972 businesses which represents a reduction of eleven percent (11%) in the number of businesses for the period 2008 to 2015. The number of informal businesses exceeded the number of formal businesses in all provinces for the period ending 2015.
The rural provinces tend to have more informal businesses because of the number of hawkers and informal traders. Most of the countries formal small, medium and micro enterprises are based in Gauteng (46%) followed by the Western Cape (16%). The largest number informal, small and medium sized enterprises are located in Gauteng as well (31%) followed by KwaZulu Natal (19%) (SEDA, 2016).
2.4.2 Small and medium enterprises by economic sector
Most of the SMEs in South Africa conduct their business in the retail, wholesale and accommodation sector and the personal services, social and community sectors follow. (SEDA, 2016)
2.4.3 Demographic distribution of SMEs
The majority of both formal and informal small and medium enterprise owners are black who own seventy one percent (71%) of businesses. Whites own twenty percent (20%) whilst coloureds and Indians own the remaining nine percent (9%). Whites however own and operate fifty one percent (51%) of formal businesses whilst blacks are the largest owners of informal businesses with eighty nine percent (89%) (SEDA, 2016).
2.4.4 The financial profile of SMEs
Turnover of the small and medium business sector increased from 2010 to 2015. The major increases were in the real estate, community and construction sectors. The other sectors, which includes electricity, gas and water, manufacturing, mining, transport and trade sector mainly, increased due to inflation. The sector with the highest turnover was the manufacturing sector. The business services and the real estate sector have averaged the highest profits in this period followed by the trade sector. In terms of total expenditure, the trade industry is the largest amongst small
17
businesses. Finance costs in the real estate and businesses services sector are much higher when compared to other sectors for this period. In general, across the small business sector, expenditure increased relatively more than turnover and profit levels in most industries. Taxes that were paid by small and medium enterprises increased substantially between 2010 and 2015. Currently most taxes are paid by businesses in the trade and manufacturing sectors (SEDA, 2016).
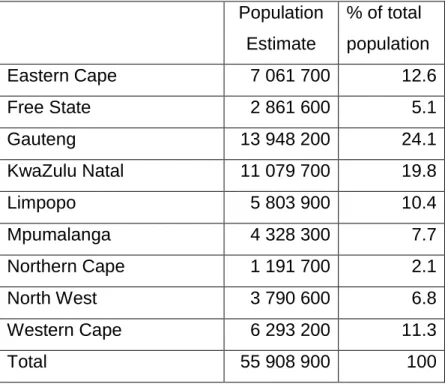
2.5 Provincial statistics and unemployment in South Africa South Africa has nine provinces and had an approximate population of 55.9 million
people in 2016.
A breakdown of the population per province is noted in the table below.
Population Estimate
% of total population
Eastern Cape 7 061 700 12.6
Free State 2 861 600 5.1
Gauteng 13 948 200 24.1
KwaZulu Natal 11 079 700 19.8
Limpopo 5 803 900 10.4
Mpumalanga 4 328 300 7.7
Northern Cape 1 191 700 2.1
North West 3 790 600 6.8
Western Cape 6 293 200 11.3
Total 55 908 900 100
Table 2.4: Estimates by province of mid-year population, 2016
Source: Mid-year population estimates by province, 2016. Compiled by Statistics South Africa. (Statistics South Africa, 2016)
As can be seen in Figure 2.4 above, Gauteng and KwaZulu-Natal make up most of the population in South Africa with almost forty four (44%) of the population living in these two provinces.
18
The impact of the 2008 and 2009 international financial crisis had a significant impact on KZN. The province suffered as a result but since then has risen faster than the rest of the economy however; since the end of the commodity boom, it has been affected by the general slowdown. Average growth from 2003 to 2011 averaged about four percent (4%) a year but from 2011 to 2014 it fell to 2.4%. In 2015 only thirty eight percent (38%) of the population eligible for work was employed in comparison to the country average of which was in excess of forty percent (40%) and sixty percent (60%) internationally. The province gained two hundred thousand (200 000) jobs from 2010 however the percentage of working age population with employment had remained virtually unchanged because of the population growth (Trade and Industry Political Strategies, 2016).
According to the quarterly labour report prepared by Statistics South Africa, employment levels increased in six of the nine provinces during the period 1 March 2015 to 31 March 2016. During this period KwaZulu-Natal, Gauteng and the Free State suffered job losses of 57 000, 16 000 and 12 000 respectively. With the second largest population in the country, KwaZulu-Natal recorded the most job losses for the period 1 March 2015 to 31 March 2016 and in addition, the official unemployment rate for the province increased from 20.5% to 23.5% in the space of one year (Stats SA, 2016).
As at the end of September 2017 the unemployment rate for the province was approximately 24.6% and in the third quarter of 2017, KwaZulu Natal recorded forty seven thousand (47 000) job losses.
The growth in the number of small and medium sized businesses over the last decade has been lower than the economic growth rate (SEDA, 2016). While KwaZulu Natal accounts for about twenty percent (20%) of South Africa’s population, it contributes approximately sixteen percent (16%) of the gross domestic product (GDP) (Trade and Industry Political Strategies, 2016). This indicates that there seems to be many challenges in the small business sector that is influencing business growth and performance.
Govender in his study in 2008 found that KwaZulu Natal only accounted for ten percent (10%) of the formal registered small and medium sized business population in South Africa. Ten years later KZN has lost roughly 11% of businesses since 2008. (SEDA, 2016). With only ten percent (10%) of registered small business in the country and the
19
increase in unemployment together with the increase in the failure rate of SMEs, these statistics indicate that there are serious problems in the province in terms of developing and sustaining small businesses.
2.6 Challenges faced by small businesses
Despite the significant contribution to economic growth, small businesses globally and internationally still face many challenges. Obstacles and challenges that businesses are faced with are significantly more than they were previously as the environments small businesses operate in, are significantly more complex and dynamic. To assist in the development of the economy within a country it is imperative to have knowledge of the factors and risks which impact small business success or failure (Sitharam, 2014).
Cant, et al., (2003) have estimated that less than 50% of new and developing businesses last more five years and argue that the failure rate of SMEs internationally is between seventy percent (70%) and eighty percent (80%). In South Africa, the failure rate is extremely high as well, with seventy five percent (75%) of small businesses not becoming established firms. (Olawale & Garwe, 2010).
There has been much research on identifying and understanding the various factors that influence business failure. According to Sitharam (2014), small business failure can be attributed to a number of internal and external factors as well as entrepreneurial culture. (Everett & Watson, 1998) identified and discussed the three types of risk that small business owners are exposed too. Economic, industry and firm based risk are the three risks that are considered the main determinants of business success or failure. They further argued that economic factors are associated with about thirty percent (30%) to fifty percent (50%) of small business failures. According to Olawale
& Garwe (2010), there are many other different variables that act as obstacles to growth. Internal factors such as lack of finance and management skills together with external factors such as tough economic conditions and a lack of quality in infrastructure are considered to be some of the most important challenging factors that small businesses have to deal with in South Africa.
Limitations of access to finance for SMEs is considered to be a very common problem in South Africa. Financial institutions are more likely to invest and lend money to more
20
established businesses as opposed to start-up businesses who are looking for funding in order to expand and grow operations. According to the GEM South Africa 2014 report, some of the major factors for business failure are the lack of access to finance and poor profitability. In terms of infrastructure, ease of access to communications, transport, utilities, land and renting space at affordable prices are all important considerations for new businesses. (SEDA, 2016).
Oxford, et al., (2004) argued that small businesses face serious financial management capacity weaknesses. (Xiangfeng, 2008) identified weak linkages to the external market, weak technological innovation, poor physical infrastructure, high operational costs, inadequate financing and limited managerial and entrepreneurial skills as specific concerns and challenges for small and medium sized businesses. Sitharam, (2014) also agreed that management competency and skills shortages which includes experience in small business management is an important factor that also affects the performance of business. A lack of technical accounting and financial management skills is considered to be a significant threat to the performance and survival of small businesses. The Small Enterprise Development Agency also agrees with this and acknowledges that a shortage of skills, especially accounting and sales capabilities, are serious constraints to business and employment growth. (SEDA, 2016)
The high level of crime in South Africa is another serious factor that has influenced society and business. Both the formal and informal sectors are equally affected.
Business owners are forced to spend more money on private security, which has a snowball effect on the cost of doing business and causes unnecessary expenditure that puts a strain on cash flows and also decreases profits. (SEDA, 2016).
Other important factors that influence the performance of SMEs in South Africa include competition, government bureaucracy, foreign exchange rates, inflation and interest rates. (Sitharam, 2014). The GEM (2014) report also highlighted government bureaucracy in South Africa, as a major hurdle for business sustainability and activity.
Key issues identified in government bureaucracy, were the time delays in obtaining necessary permits and licences to trade. Government departments were considered inefficient in handling these duties. It was also argued that there is a lot of red tape around starting and managing a business, which includes the copious amount of
21
registration and compliance with the relevant Acts and regulatory bodies in South Africa (SEDA, 2016).
Specifically, tax laws and labour laws have been identified as the major laws and regulations that negatively affect business growth (Sitharam, 2014). Labour laws have been specifically pin pointed as a major problem when it comes to business growth, especially when it relates to the termination of staff (OECD, 2015). Small and medium businesses are also exposed to high labour costs in South Africa, which is a result of the high minimum wages that are sanctioned by the South African labour law (SEDA, 2016).
In a study conducted by SBP in 2004, it was reported that the regulatory environment imposed significant costs on business activities. These costs reduced the businesses ability to expand operations and create jobs. More importantly, the single largest growth inhibiting aspect identified was the pure red tape of regulatory compliance costs (SBP, 2004). Small and medium businesses and more importantly the new entrepreneur starting his business is faced with many different obstacles. Vast amounts of legislation and regulations that apply, taxes, consumer protection, access to information and corporate laws impose reporting and administrative burdens, with the constant threat of non-compliance and risks (Retief, 2010).
In terms of all regulations and laws, tax compliance costs are considered to be the largest component of all compliance costs incurred by businesses. (SBP, 2004).
Value-Added Tax and other tax related issues are considered to be the most problematic regulations for these small businesses. (SBP, 2004).
Storey, (1994) as cited in (Krasniqi, 2007) argued that compliance costs for small firms are much higher than larger firms relative to their size and (Schiffer & Weder, 2002) also agreed that taxes and regulations is one of the areas that small and medium firms had more problems in as opposed to the larger firms. (Krasniqi, 2007) further argued that time consuming regulatory requirements and tax structures are also major obstacles to small business growth in transition countries. In addition to the cost of tax compliance, the complexity of ensuring compliance is another factor that is a challenge for small and medium sized enterprises in South Africa.
22
Govender, (2008) defined these tax compliance costs as all the costs incurred in ensuring proper compliance with relevant tax regulations. These costs include the following:
Expenses related to record retention, filing and sorting records, invoices and receipts.
Costs incurred in the preparation and submission of all relevant tax returns.
Opportunity cost in respect of time utilized by SMEs in ensuring tax compliance.
Costs of external advisors that are required for tax compliance and/or to address disputes with the tax authorities.
Any costs to ensure compliance as well as any incidental costs and travel expenditure.
Clover & Darroch, (2005) argued that small and medium sized business owners in KwaZulu-Natal perceived a lack of government support for small and medium enterprises as a significant constraint to business survival and growth. Complex legislation and complex tax requirements such as VAT registration and VAT compliance are the major contributors to this.
Appropriate institutional environments for small and medium enterprises and simple administrative processes aid small business creation and growth. In many countries, there are numerous taxes and the processes associated with compliance can be very complicated. These complex methods often force small businesses to employ outside advisors, which increases costs. Tax rates and the time owners waste in negotiating with tax offices are restrictions for small businesses. The administrative burden and high tax rates are considered to be two of the biggest problems in firm performance and slows down growth of small businesses. (Krasniqi, 2007)
According to Gill & Biger (2012), regulatory issues are one of the more important barriers to small business growth in Canada and there are various other impediments to SME growth across the globe because of differential economic sanctions, practices, policies and political systems.
The success and failure of economic initiatives are of great significance to the entire country as a whole (DTI, 2008). The creation and development of sustainable small businesses is crucial for the country and economy, and understanding the specific
23
challenges faced by them is extremely important. Not only locally but also internationally are small businesses are recognised as the chief generators of jobs (SBP, 2012). With the government aspiring to develop small businesses, the increase in unemployment indicates that small businesses are not being developed or growing fast enough to meet the ever-changing demands of the growing population in South Africa. To effectively deal with the unemployment crisis, the growth and expansion of existing business must be supported, together with the emergence of new businesses.
Small and medium businesses can be used as a vehicle to assist with transformation in South Africa by redistributing productive assets to the previously disadvantaged individuals and communities (Sitharam, 2014).
2.7 Tax compliance for small businesses 2.7.1 Importance of taxation
Taxes are an important factor that defines the business climate. Tax also serves and operates as a political accountability mechanism (Ponorica & Al-Saedi, 2015). Taxes are the main stream of revenue generation for developing countries and these revenues are necessary for improving infrastructure, dealing with climate changes and most importantly to finance poverty reduction (Keen, 2012). The small business sector consists of approximately 165 000 registered businesses and contributes about thirty six percent (36%) of all corporate taxes collected in South Africa, which is quite substantial (Davis Tax Committee, 2016)
An imparity between a country’s tax systems and the economic environment can have unfavourable ramifications for the future. Considerations such as reducing tax liabilities, elimination of red tape and improving tax processes must be considered when endorsing policies and procedures pertaining to the tax systems. (Marusa &
Ashrafzadeh Ileana, 2013). The objective of any regulations imposed by government is to maintain and enhance the environment that allows an economy to function. These regulations that have been established and enforced, has an important impact on shaping the economy. (Kitching, 2006).
SMEs in the country could be accountable for eleven various taxes (income tax, capital gains tax, provisional tax, dividends tax, value added tax, employees tax, employment related levies, customs and excise duties, transfer duty, donations tax and stamp
24
duty). In order to comply, small businesses are required to obtain and complete the prescribed forms and ensure that submissions are made on time.
Compliance requires a vast amount of administration and non-compliance may result in fines, penalties and interest. The complexity and compliance of these tax systems are considered to be an obstacle for small enterprises (Abrie & Doussy, 2006), and it is assumed that small businesses are generally uncertain about getting in the formal economy as they consider tax as a high legislative expense and this discourages smaller entrepreneurs from embarking on business ventures. (SBP, 2003)
The four major tax compliance areas for small businesses are considered to be VAT, corporate income tax, provisional tax and employee’s tax. Corporate income tax returns need to be submitted on an annual basis. Provisional tax submissions include two returns to be submitted with payments during the year together with a third provisional payment if necessary. VAT returns may be submitted monthly, bi-monthly, six monthly or annually. Employees taxes and returns need to be submitted and paid monthly. For the purposes of this study only these four taxes will discussed and evaluated.
2.7.2 Value-Added Tax (VAT)
Value added tax is commonly known as VAT. VAT is an indirect tax levied on the consumption of goods and services in the economy. Revenue is generated for the South African Revenue Services (SARS) by requiring certain businesses to register and charge VAT on the taxable supplies of goods and services. These businesses register as VAT vendors and act as the agent for SARS in collecting the VAT. VAT is charged at each stage of the production and distribution process and is proportional to the price charged for the goods and services. VAT is currently levied at a rate of fourteen per cent (14%) on the supply of most goods and services and on the importation of goods. From 1 April 2018 the VAT rate levied will be fifteen per cent (15%). Any business may register for VAT, however it becomes mandatory for businesses where the taxable supplies for any consecutive twelve-month period will exceed one million rand. All VAT vendors are required to submit VAT returns (VAT 201) and make payments of the VAT liabilities or claim a VAT refund in accordance with the tax period allocated to the vendor. (SARS, 2017)
25 2.7.3 Corporate income tax
Corporate income tax is a tax levied on companies registered in South Africa. The corporate tax rate for companies is currently levied at twenty eight per cent (28%) on the taxable profits of that company. Corporate income tax is applicable (but not limited) to the following companies:
Public companies that are listed on the stock exchange
Public companies that are not listed on the stock exchange
Private companies
Close-corporations
Co-operatives
Collective investment schemes
Small business corporations (taxed according to the tax tables for Small Business Corporations)
Body corporates
Share block companies
Dormant companies
In terms of the Income Tax Act No.58 of 1962 all companies listed above are required to register with SARS as a taxpayer. Every registered taxpayer is required to submit an income tax return no later than twelve months after the end of the financial year (SARS, 2017).
2.7.3.1 Corporate income tax on different business types (Partnerships and Sole proprietors)
Close corporations and private companies make up the bulk of the small and medium sized enterprises by accounting for approximately seventy five percent (75%) of the small business sector. Sole proprietors and partnerships account for the remaining twenty five percent (25%) (Govender, 2008). These other business forms generate profits that are taxable. The tax implications of these two business forms is discussed below.