In this study, a study is conducted to evaluate the feasibility of on-board weighing systems in the South African sugarcane transport industry. An economic evaluation of an on-board weighing system was carried out using the capital budgeting method.
INTRODUCTION
- Project Background
- Objectives of Study
- Research Approach
- Document Layout
Provide an overview of on-board weighing systems, showing the advantages and disadvantages of the technology. After the field evaluation, an economic analysis of an onboard weighing system is presented.
OVERVIEW OF ON-BOARD WEIGHING SYSTEMS
Introduction
Types of Systems
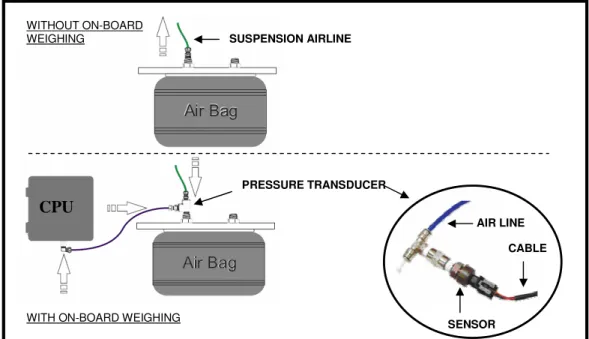
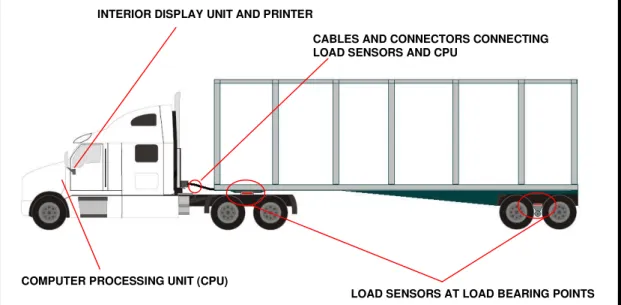
Components
- Load sensors
- Load cell sensors
- Pneumatic load sensors
- Computer processing unit (CPU)
- Interior display unit
- Printer unit
- Adaptations and optional extras
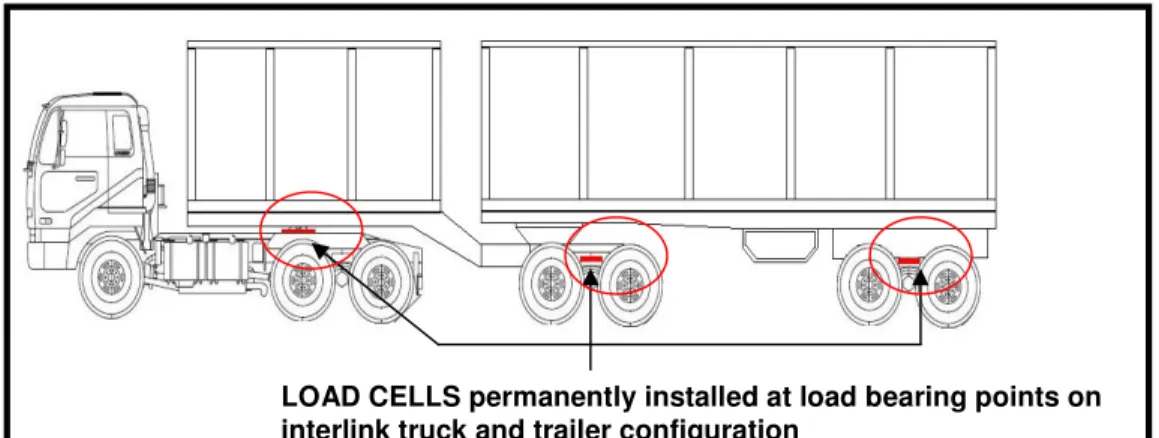
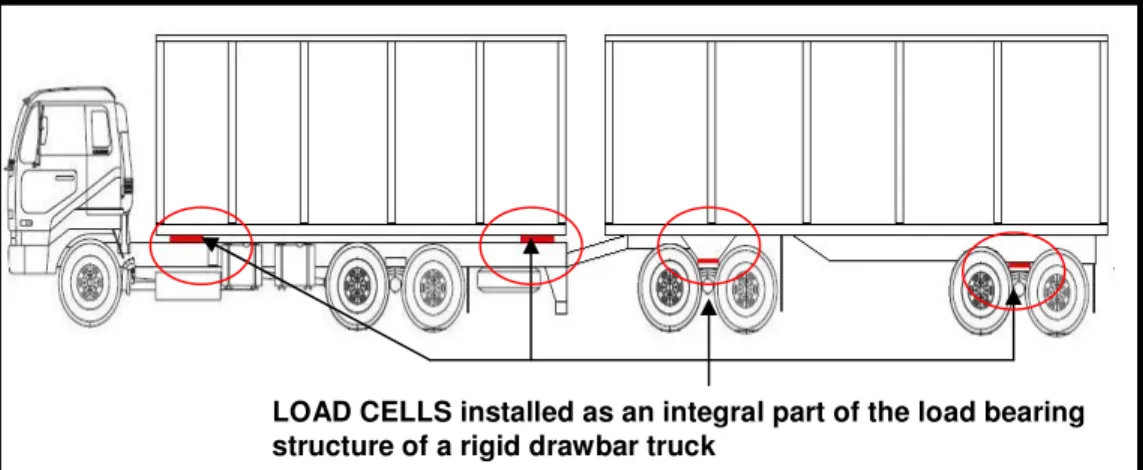
LOAD CELLS installed as an integral part of the supporting structure of a truck with a rigid drawbar. The onboard weighing system's internal display unit is the primary interface between the truck operator and the weighing system.
Benefits
- Vehicle benefits
- Improved vehicle utilization/reduced transport costs
- Prevention of vehicle breakdowns
- Fleet managerial benefits
- Improved vehicle/driver safety
- Increased driver productivity
- Reduced time between deliveries
- Reduced weight disputes
- Road benefits
- Increased road safety
- Prevention of road infrastructure damage
This fact can be attributed to insufficient control of the on-board weighing system. With tighter control of the weighing system on board, it is envisaged that this can be achieved.
Negative Drawbacks
- Capital investment
- Increase in fleet managerial duties
Factors Affecting Scale Effectiveness
The errors of the on-board weighing system with respect to its regression value are indicated by the line E(y) in Figure 4.18. It is anticipated that a greater reduction in overloading can be achieved through better management of on-board weighing systems. The efficiency of the integrated weighing system is also influenced by the variety and quality of the cane.
The topography of the loading environment is therefore of great importance for the successful operation of on-board weighing systems. For loose sugarcane loaded into zones, three factors are considered critical to the successful operation of the on-board weighing systems. When evaluating the accuracy of the onboard weighing systems, the mill weighbridge was used as a control measure.
Discussion and Conclusions
OVERVIEW OF SOUTH AFRICAN SUGARCANE ROAD
- Introduction
- Road Transport
- On-board Weighing and Road Transport
- Optimising payloads of articulated and rigid trucks
- Loading methods
- Lead distance
- Discussion and Conclusions
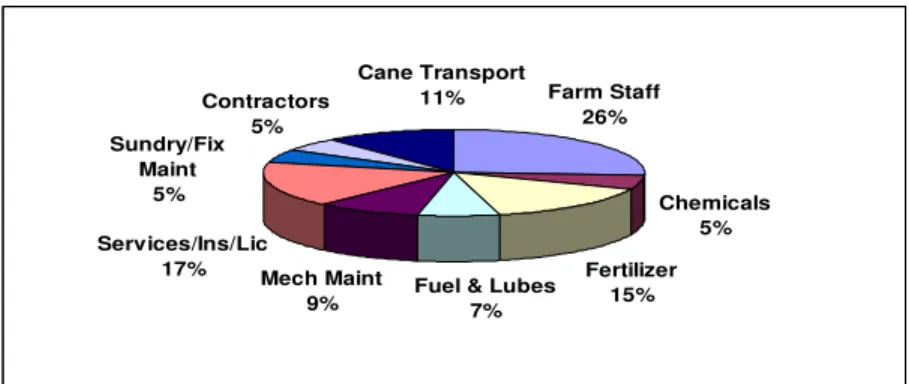
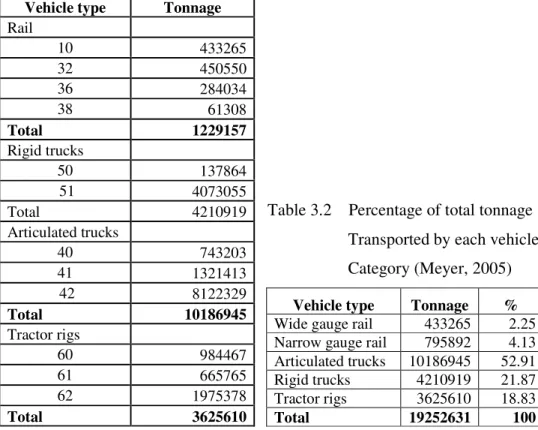
It is important to note from the flow diagram that road transport is an important component of every system, regardless of the particular farm process. It is notable from Table 3.2 that articulated trucks and rigid trucks make up 75% of the total tonnage hauled per year. season. Another factor that has a major influence on the truck's payload is the loading method.
Currently, it is estimated that 60% of the total annual sugarcane crop in South Africa is mechanically stressed on the estate (Meyer and Fenwick, 2003). Much of South Africa's industrial crop is transported from the field to strategically located transshipment areas on sugarcane farms. Road transport of sugarcane from grower to mill is a critical component of the sugarcane industry.
Trucks loaded with bulk cane in transshipment areas can achieve the most consistent mass loads, while truck mass loads loaded in the field can vary considerably depending on field topography.
EVALUATION OF ON-BOARD WEIGHING SYSTEMS IN SOUTH
Introduction
Research Approach
Unitrans Agriculture and TSB Sugar are large transport companies that have a number of trucks in their fleet that work with built-in weighing systems, while Kevard Transport is a small private grower and transporter. Unitrans and Kevard Transport vehicles operating with on-board weighing systems are loaded with loose sugar cane by grab loaders at trans loading zones and are referred to as zone loaded field evaluation. The following specific objectives are proposed to meet the general objective described on page 2, which is to evaluate the accuracy and consistency of on-board weighing systems under different loading scenarios.
Objective One: Evaluate the accuracy and measurement consistency of on-board weighing systems for zone-loaded sugarcane and field-loaded sugarcane and compare the two loading systems. Objective two: Determine whether vehicle utilization has been significantly improved for vehicles with on-board weighing systems. Objective three: Determine whether external factors within the transportation operation influence the effectiveness of onboard weighing systems.
Objective Four: To determine whether truck overloading is significantly reduced by the use of on-board weighing systems.
Field Evaluation for Zone Loaded Cane
- Unitrans operation description and configuration
- Data collection
- Data analysis
- Accuracy of the on-board weighing system
- Consistency of the on-board weighing system
- Factors affecting GVM of vehicles with on-board
- Average GVM of vehicles with on-board weighing
- Comparison of overloads
- Kevard Sugar operation description and configuration
- Data collection
- Data analysis
- Average payloads and payload variation
- Percentage of loads overloaded
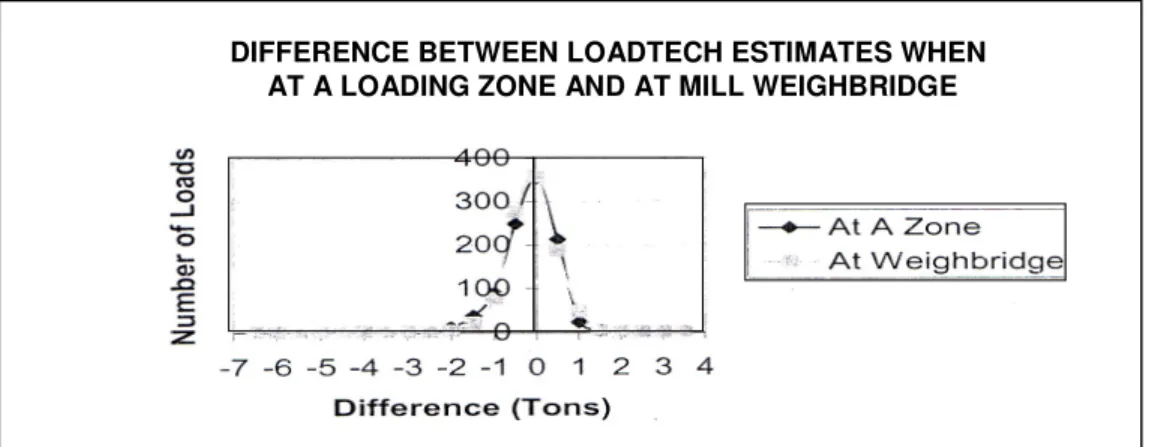
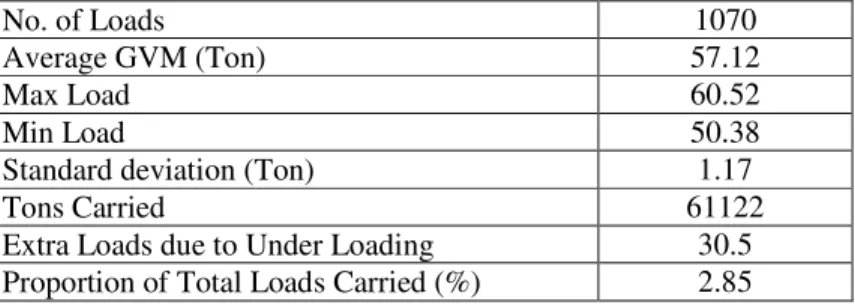
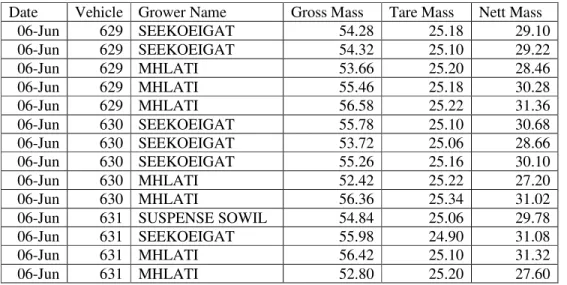
Figures 4.4, 4.5 and 4.6 are pictures of the LOADTECH onboard weighing system on the Unitrans trucks. Point1, GVM as shown by the onboard weighing system at the zone where the vehicle was loaded. The GVM (measured by the mill weighbridge) of all loads delivered by the Unitrans trucks without on-board weighing systems was also obtained for the duration of the study period.
The error is positively biased, which means that the weighing systems on board tend to overestimate by 0.4 tons. It is highly unlikely that perfect readings will be obtained between weighing and weighbridge. This was done to assess whether there was variation in the on-board weighing system during the trip from the zone to the mill.
This was considered high, as the standard error of the on-board weighing system was determined to be only 0.4 tonnes.
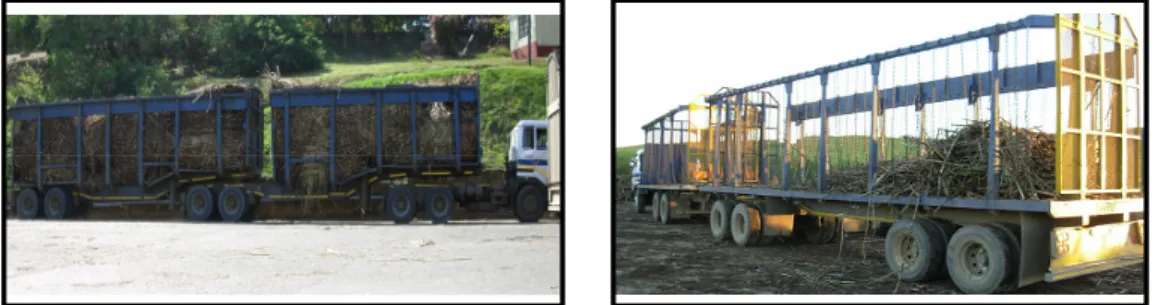
Field Evaluation of In-field Loading
- Operation description and configuration
- Data collection
- Data analysis
- Accuracy of the system
- Comparison of overloads
As in the zone-loaded field evaluation, the on-board weighing system tended to weigh by 0.3 tonnes. This chapter attempts to establish the payback period of the investment required for an on-board weighing system for different transport scenarios. Determine transportation cost savings due to the implementation of an on-board weighing system for different scenarios.
The optimum lead distance for the investment in an onboard weighing system is 60 km. This defeats the purposes of the onboard weighing system, as one of its main purposes is to prevent overloading. An evaluation of on-board weighing systems for articulated trucks in the South African sugarcane industry was carried out.
Various different factors related to the shipping operation were evaluated to assess whether they affected the effectiveness of the on-board weighing systems.
Disscusion and Conclusions
ECONOMIC EVALUATION
Introduction
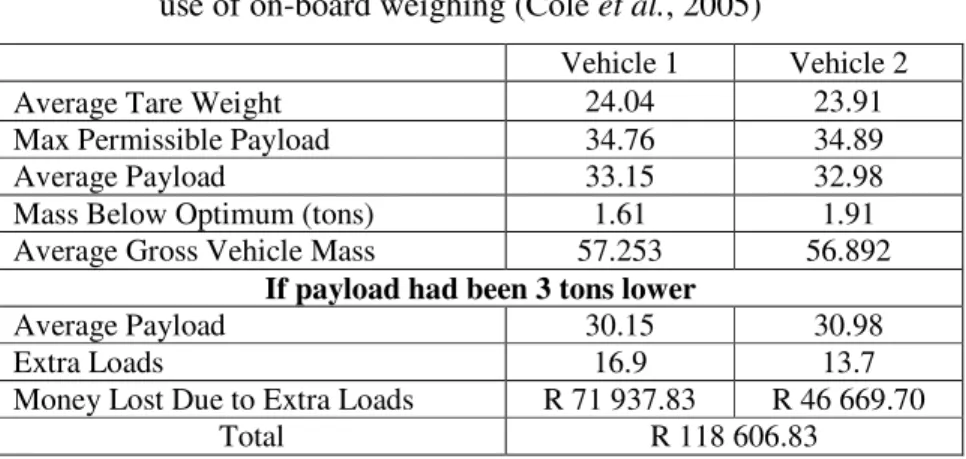
Transport in the South African sugarcane industry is done by one of two parties, either grower transporters or commercial transporters. Transporters cum growers are defined as cane growers who transport their own and potential other growers' cane but not for a profit, while commercial transporters transport cane as a profitable business (Giles, 2007). The system must then increase vehicle utilization and significantly reduce transportation costs to warrant the investment.
An increase in the use of vehicles can result in a reduction in the number of cargoes a carrier ships each year, while still shipping the same tons of sugarcane. The reduced number of loads required to be delivered in a season will result in a direct saving in transport costs.
Method
- Development of a capital budget
- Transport costs
- Transport cost saving
- Results
- Disscussion and conclusions
Table 5.3 shows the transportation cost (used in this study) for different lead distances as derived from Figure 5.2. Calculate the cost per load due to lead distance and the resulting total cost per season. A sample cost savings calculation for a scenario where the load increases by 3 tons and the lead distance is 60 km is shown in Table 5.4.
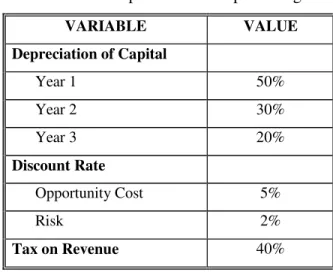
Tables 5.6, 5.7 and 5.8 contain the capital budgets for the scenarios where the line distance is 60 km and the payload increase was 2, 3 and 4 tonnes respectively. The shortest payout period was two years and occurred when the distance was 60 km in all three cases of increase in payload. It was assumed that this is due to the small number of loads delivered annually when the line distance is 100 km compared to the shorter line distances.
The scenario with the longest payback period was when the payload increase was two tons and the lead distance was 100 kilometers and the payback period was four years.
GUIDELINES FOR IMPLEMENTATION
- Introduction
- Loading Environments
- Loose cane loaded on transloading zones
- Chain bundled cane loaded on transloading zones
- Infield loading
- Managing the System
- Driver experience and acceptance
- Continuous monitoring of the system
- Routine Maintenance
- Cleaning
- Disscussion and Conclusions
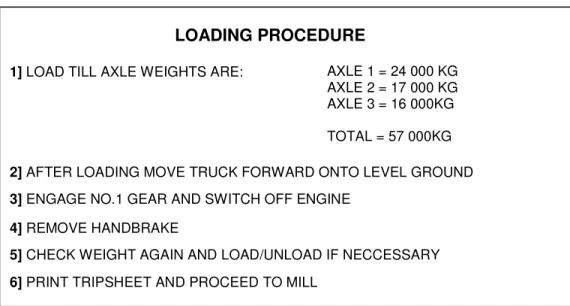
Load cell on-board weighing systems, such as the LOADTECH system, function optimally when the truck is on a level surface (Cole, 2007). When loading occurs, the truck driver observes the digital display of the on-board weighing system and indicates to the skid steer loader driver when to stop loading. Potholes and excessively large bumps in the field can also cause the on-board weighing reading to be inaccurate.
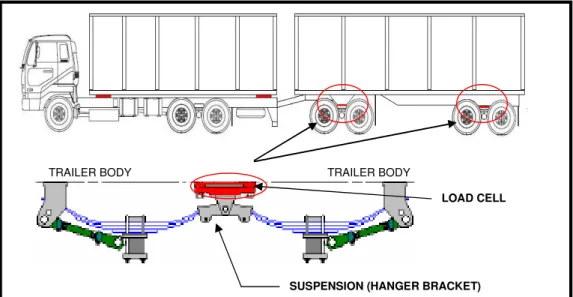
If the error between the onboard weighing system and the mill weighbridge is consistently greater than 0.4 tonnes, the system must be recalibrated. Recalibration is done by technicians from the suppliers of the on-board weighing system and the system is calibrated to which mill weighbridge delivers that particular truck. The onboard weighing system works via cables that connect the load cells located on the trailers of the truck to the tractor section of the truck.
The successful operation of an onboard weighing system depends on the loading environment, system management and system maintenance.
DISSCUSSION, CONCLUSIONS AND RECOMMENDATIONS
Discussion and Conclusions
Different types of on-board weighing systems are available for different truck and trailer configurations, as well as different suspension types. Initial studies conducted on the use of on-board weighing systems showed that vehicle utilization could be improved and that the negative aspects of the system were outweighed by the return on investment. In assessing whether vehicle utilization improved when on-board weighing systems were used, it was found that the average GVM of vehicles with and without the systems was very similar.
However, the variation in GVM of loads was less when on-board weighing systems were used, allowing more loads to be on the targeted GVM, and it was concluded that vehicle utilization was improved. It was concluded that the smaller private operation was managed better with closer monitoring of the on-board weighing system and thus the on-board weighing systems were used more efficiently. An economic evaluation using a capital budgeting system was performed to determine the feasibility of investing in an on-board weighing system for a grower with transport.
To achieve maximum effectiveness from the onboard weighing system, it must be closely managed and maintained through regular maintenance.
Recommendations for Further Research
To conclude, the implementation of an on-board weighing system on an articulated sugar cane truck is an economically viable investment that allows increasing the payload of a vehicle, while reducing the variation in GVM for loads and preventing trucks are overloaded.
Unpublished MScEng Dissertation, School of Bioresources Engineering and Environmental Hydrology, University of KwaZulu-Natal, Pietermaritzburg, RSA. Available from: http:/ www.mcli.co.za/mcli-web/events/../010-Impact-On-Maputo-Corridor.pdf. Unpublished MScEng thesis, School of Boiresources Engineering and Environmental Hydrology, University of KwaZulu-Natal, Peitermaritzburg, South Africa.
APPENDIX