FOLLOWING A CLEANER PRODUCTION APPROACH TO GUIDE THE PERMITTING PROCESS OF ODOUR PRODUCING INDUSTRIES:
AN ASSESSMENT OF CASE STUDIES
By
Bawinile Nzimande
A thesis presented in partial fulfilment of the requirements of Master of Science degree
In Water and Environmental Management in the School of Civil Engineering At University of KwaZulu-Natal, Durban, South Africa
SUPERVISOR: PROFESSOR CHRIS BUCKLEY
March 2011
ABSTRACT
The eThekwini Municipality is facing two major challenges in controlling odorous emissions by various industries in the South Durban Basin; firstly, getting industry to manage their onsite odorous emissions and, secondly regulating these odorous emissions. This study focused on the Jacobs’s Industrial Complex (JIC) which comprises various industries releasing air emissions which impact on the local air quality. The impact of these emissions is supported by the number of odour complaints reported to the eThekwini Environmental Health Department by the public.
Cleaner production (CP) is an integrated approach aimed at continuously reducing environmental impacts of processes, products and services through applying preventive approaches rather than controlling and managing pollution once it has been created. This dissertation has assessed the application of CP as a concept to prevent and reduce emissions of odours by industries in the JIC that are an impacting on the environment and neighbouring communities. Three CP case studies are analysed to demonstrate the applicability of the approach.
These are a CP project for drum reprocessing company based in the South Durban Basin and two waste minimisation clubs which operated from 1998 to 2000 in Durban.
The key findings, outcomes, experiences and lessons learnt from these case studies underpin the recommendation of an approach that can be applied by eThekwini Municipality to incorporate CP in the scheduled trade (ST) permitting of odour producing industries. This research has applied a multi-case study design implying both qualitative and quantitative approaches. A qualitative approach was used in the detailed analyses of case studies whilst the quantitative one was applied in the graphical analyses of the odour complaints statistics for the JIC.
The study concludes by drawing two major recommendations from the lessons leant. Recommendation 1: The general CP strategy that can be applied by eThekwini Municipality in regulating, promoting, enforcing, monitoring and evaluating application of CP practices among stakeholders. The recommended objectives for the general strategy include:
· Enforcement of uniform regulatory standards.
· Development of a policy or guidelines.
· Effective compliance monitoring and enforcement.
· Develop a local Cleaner Production Centre (LCPC).
· Ensure co-operative governance.
· Provide adequate financial resources.
· Monitoring and evaluation.
Recommendation 2: Strategy for incorporating CP in the ST permitting of odour producing industries. It is recommended that the ST permit holder for an odour producing industry comply with the following:
· Prioritisation of odour like the other priority pollutants.
· Industry to perform an audit to map odour emitting areas.
· Permit holder to development a CP based odour management plan.
· Investigate possible CP projects that can be undertaken to prevent and mitigate odour emissions.
· Incorporate an odour management plan into a 5 year environmental improvement plan.
· Develop and appropriately manage an odour complaints management system.
· Set odour management performance indicators and baselines for targets and reporting.
· The permit holder should include odour management performance including odour complaints management in the annual report.
ACKNOWLEDGEMENTS
A great sincere word of appreciated is extended to my employer eThekwini Municipality for allowing me an opportunity to undertake my Master of Science degree in Water and Environmental Management. The CP project undertaken for this study was possible due to DANIDA funding from the Pollution Control and Risk Management Section of the eThekwini Health Department.
A special appreciation is also extended to my family and friends who have contributed in the success of this study by encouraging me not to give up, the Deputy Head Pollution Control and Risk Management Mr Siva Chetty for his assistance in advising and funding the CP project and lastly Jenny Highley and Vusi Mhlongo for advising on theses writing skills.
Leonie Munro ( MarLeo’s Communication Services) is thanked for editing the text but the final proof reading was my responsibility.
I would also like to thank god who gave me the strength to complete my theses.
DECLARATION
I... Declare that:
(i) This thesis, except where indicated, is my original work.
(ii) This thesis has not been submitted for any degree or examination at any other university.
(iii) This thesis has acknowledged other persons’ data, pictures, graphs and other information sourced and this thesis has acknowledged other peoples’ writings and quotes.
Signed:
CONTENTS
ABSTRACT i
ACKNOWLEDGEMENTS iii
DECLARATION iv
APPENDICES ix
LIST OF ABBREVIATIONS x
LIST OF FIGURES xii
LIST OF TABLES xiii
CHAPTER 1: INTRODUCTION
1.1 Research context 1
1.2 Challenges of the South Durban Basin 2
1.3 Background to the study 3
1.4 Rationale for the study 4
1.5 Role of the investigator in the study 4
1.6 Aim of the study 4
1.7 Study objectives 5
1.8 Outline of the theses 5
CHAPTER 2: PROBLEM DESCRIPTION
2.1 Physical description of the South Durban Basin area 7 2.2 Meteorological conditions in the South Durban Basin 9 2.3 eThekwini Environmental Health Services Air Pollution monitoring 11 2.4 History of human settlements and industries in the South Durban Basin 14 2.5 Co-operative governance and special interest groups 16 2.6 Regulatory framework for air pollution and odours 17
2.6.1 Government roles and responsibilities 17
2.6.2 National roles 17
2.6.3 Provincial roles 18
2.6.4 Municipal roles 18
2.6.5 Industry 18
2.7 Jacobs Industrial Complex and odour producing industries 19
2.8 The Jacobs Industrial Complex odour emissions problems 21 2.8.1 Jacobs Complex odour complaints statistics and analyses using graphs 22 2.8.2 Odour producing industries in the Jacobs Industrial Complex 28
2.8.2.1 Linking odour complaints to industry 28
2.8.2.2 Odour complaints statistics analyses using Geographic Information Systems
Maps 28
2.9 Selection of case study company in the JIC 32
2.10 Summary 35
CHAPTER 3: LITERATURE REVIEW
3.1 Sustainable development 36
3.2 Cleaner production 38
3.2.1 Concept of cleaner production 39
3.2.2 Barriers and driver to implementing cleaner production 39
3.2.2.1 Barriers for cleaner production 39
3.2.2.2 Drivers for cleaner production 41
3.3 History of cleaner production in South Africa 43
3.4 Odours 44
3.4.1 Definition of odour 45
3.4.2 Odour control 46
3.4.3 Odour management 47
3.4.4 Application of cleaner production to odour control 48
3.4.5 Odour regulation by countries 49
3.5 Regulatory context 51
3.5.1 Cleaner production related legislation, policy and strategy in South Africa 51 3.6 EThekwini Municipality Scheduled Trades permitting process 53
3.6.1 The Scheduled Trade permit 54
3.6.2 The Scheduled Trade audit 55
3.7 Summary 55
CHAPTER 4: METHODOLOGY
4.1 Research objectives 56
4.2 Case study design 56
4.3 Data sources 57
4.3.1 Primary data sources 58
4.3.2 Secondary data sources 59
4.4 Sampling 59
4.4.1 Sampling: Company for the study 60
4.4.2 Sampling: Jacobs Industrial Complex odour complaints statistics 60
4.4.3 Selecting cleaner production consultants 60
4.5 Data analyses 60
4.5.1 Odour complaints analyses 60
4.5.2 Case studies: Data analyses 61
4.6 Data presentation and interpretation 61
4.7 Summary 61
CHAPTER 5: CASE STUDY DESCRIPTION
5.1 Case study 1: Cleaner Production project for drum reprocessing company 63
5.1.1 Background to the case study 64
5.1.2 Methodology 65
5.1.3 Outcomes 67
5.1.4 Lessons learnt 70
5.2 Case study 2: Waste Minimisation Clubs 73 5.2.1 Background to development of Waste Minimisation Clubs in Durban, South
Africa 73
5.2.2 Approach applied in the implementation of the two Waste Minimisation Clubs
in Durban 74
5.2.3 Lessons learnt 77
5.3 Summary of the lesson learnt: All case studies 79
CHAPTER 6: COMPARATIVE ANALYSES OF CASE STUDIES
6.1 Comparative analyses 81
6.2 Summary 86
CHAPTER 7: CONCLUSIONS AND RECOMMENDATIONS
7.1 Summary of the outcomes 88
7.1.1 Drum reprocessing company case study 89
7.1.2 Waste Minimisation Clubs 89
7.2 Summary of lessons learnt 89
7.2.1 Drum reprocessing case study 89
7.2.2 Waste Minimisation Clubs 89
7.3 Summary of case studies comparative analyses findings 89
7.4 Recommendations 91
7.4.1 Recommendation 1: General Cleaner Production strategy for eThekwini
Municipality 91
7.4.2 Recommendation 2: Strategy for applying Cleaner Production in the Scheduled
Trade permitting process 93
7.5 Realisation of objectives 95
7.6 Way forward 96
REFERENCES
APPENDICES
Appendix 1: The database of odour complaints received by Environmental Health Services for the period from 2005- 2007
Appendix 2: Database of industries operating in the Jacobs Industrial Complex
LIST OF ABBREVIATIONS
ABM Area Based Management AQA Air Quality Act
AQMP Air Quality Management Plan CBD Central Business District
CBO Community Based Organisations CEO Chief Executive Officer
CP Cleaner production
CSIR Council for Scientific and Industrial Research
DANIDA Danish International Development Assistance DEAT Department of Environmental Affairs and Tourism
DTI Department of Trade and Industry ECA Environmental Conservation Act EH EThekwini Health
EHP Environmental Health Practitioner EHS Environmental Health Services EIA Environmental Impact Assessment EMP Environmental Management Plan EPA Environmental Protection Agency EU European Union
EWS EThekwini Water and Sanitation GDP Gross Domestic Product
HCS Hazardous Chemical Substances IDP Integrated development Plan JIC Jacobs Industrial Complex MEC Member of the Executive Council MPP Multi Point Plan
MSDS Material Safety Data Sheet NE North Easterly
NEMA National Environmental Management Act NGO Non–governmental organisations
NRF National Research Foundation OHS Occupational Health and Safety
PM 10 Particulate Matter size 10 micrometre RSA Republic of South Africa
SDB South Durban Basin
SDCEA South Durban Community Environmental Alliance SE South Easterly
SHEQ Safety, Health, Environment and Quality
SME Small Medium Enterprise
SMME Small Medium and Micro Enterprises ST Scheduled Trades
UKZN University of KwaZulu-Natal
UNEP United Nations Environmental Programme US-EPA United States Environmental Protection Agency
W West
WCED World Commission on Environment and Development WMC Waste Minimisation Club
LIST OF FIGURES
Chapter two
Figure 2.1: South Durban Basin highlighting the position of Jacobs Industrial Complex Figure 2.2: Position of the South Durban Basin in relation to the residential community Figure 2.3: SO2 Pollution and wind rose at Southern Works and Settlers monitoring station Figure 2.4: SO2 Pollution and wind rose for Wentworth monitoring station
Figure 2.5: South Durban Basin residential-industrial collocation
Figure 2.6: Jacobs Industrial Complex in relation to neighbouring communities Figure 2.7: Distribution of complaints by wind speed and wind direction Figure 2.8: The quantity of complaints per wind direction
Figure 2.9: Wind roses illustrating prevailing wind vectors in 2005, 2006 and 2007 Figure 2.10: Distribution of complaints by origin
Figure 2.11: Distribution of complaints by odour types Figure 2.12: Distribution of complaints by time of the day
Figure 2.13: The fraction of complaints received during daytime and night time Figure 2.14: The JIC categories
Figure 2.15: The quantity of complaints recorded from 2005-2007
Figure 2.16: Arial map showing NE winds related odour complaints and possible sources Figure 2.17: Arial map showing NW winds related odour complaints and possible sources Figure 2.18: Arial map showing SE winds related odour complaints and possible sources Figure 2.19: Arial map showing SW winds related odour complaints and possible sources
Chapter 4
Figure 4.2: Illustration and summary of research methodology for the study
LIST OF TABLES
Chapter 3
Table 3.1: Examples of pollution strategies application by World Bank Group Table 3.2: Odour regulation standards by international countries
Chapter 4
Table 4.1: Schedule of meetings to obtain the primary data
Chapter 5
Table 5.1: Breakdown of plants processes and identified impacts in a drum reprocessing factory Table 5.2: Summary of analyses of the Waste Minimisation Clubs’ project implementation
Chapter 6
Table 6.1: Summary of case studies comparative analyses
Chapter 7
Table 7.1: General strategy recommended for eThekwini Municipality
CHAPTER 1 INTRODUCTION
This chapter introduces the research context and highlights challenges faced by the South Durban Basin that led to this study. It also provides the background and rationale for this study and states the primary aim and objectives to be achieved by this research. The chapter concludes by highlighting the position and the role of the investigator (researcher) as an employee in eThekwini Municipality. The chapters of the thesis are outlined.
1.1.RESEARCH CONTEXT
In the past, industry has been operating and introducing processes without considering their environmental impact. Nowadays the trend has changed. This change has been brought about by new sustainable development goals introduced to the world community during the United Nations Conference on Environment and Development conducted in Rio de Janeiro in 1992 (Earth Summit, 1992). Sustainable development is a term defined by the World Commission on Environment and Development report (1987) as “development that meets the needs of the present without compromising the ability of the future generations to meet their own needs”
(WCED, 1987: CH2:1). This approach, whilst recognising the need for economic growth for future generations, also balances the social and environmental benefits of the society. This sustainable development concept is globally accepted and acknowledged including South Africa (SA). The evidence is the policies and legislation developed in SA since 1994 (Thambiran, 2002). This includes provision in the SA constitution Bill of Rights, the right that “every person shall have the right to an environment that is not detrimental to his/her health”
(RSA Constitution, 1996). This right obligates all SA citizens to be protected and also to take reasonable care to protect their environment for the benefit of others.
The same Rio Summit not only developed goals for sustainability but also directed the implementation of the sustainable development concept in practice by establishing Agenda 21. This (Agenda 21) is a programme agreed upon by the world leaders during the Rio summit providing a list of activities to be followed to achieve the implementation of sustainable development. One of the Agenda 21 objectives is promoting Cleaner Production (CP) for industry and business (Agenda 21, 1992). The conference proposed that cities develop and implement local agenda 21 programmes. According to Thambiran (2002), South African cities including Johannesburg, Durban and Cape Town have begun the implementation of local Agenda 21 programmes and have confirmed that the city of Durban fully adopted the programme in 1994 aimed at developing an environmental management system directing the city’s goal towards environmental sustainable development.
Cleaner production (CP) is one of the Agenda 21 objectives and is defined by the United Nations Environmental Programme (UNEP) as the “Continuous application of an integrated preventative environmental strategy to processes, products and services to increase the overall efficiency and reduce risks to humans and environment” (UNEP, 1990). This approach has resulted in a shift from end-of-pipe treatment of impacts to preventing the impacts before they occur. Adoption of CP practices offers benefits such as:
· Financial savings through improved process efficiency and a reduced treatment of waste and pollution requirement.
· Pollution prevention and reducing resource consumption through reduction of water and energy use, and reducing the generation of waste at source.
· Ensuring compliance with environmental regulations by applying preventive CP options.
This study aims at assessing the application of a CP approach in regulating South Durban Basin (SDB) industries to prevent and reduce the environmental emissions of nuisance and toxic odours. The observation is that although the CP approach has been proven to bring benefits, industry still requires some form of enforcement to implement CP projects (Hanks and Janisch, 2003).
1.2 CHALLENGES OF THE SOUTH DURBAN BASIN
The eThekwini Municipality, as one of the large metropolitan cities in South Africa, has adopted an Integrated Development Plan (IDP) aimed at uplifting quality of life for all eThekwini citizens. Amongst the many priorities in the eThekwini Municipality IDP, air quality management is included as one of the programmes in the IDP strategy (eThekwini Municipality IDP, 2009). In February 2007, the eThekwini Municipality engaged the services of the University of KwaZulu-Natal (UKZN) Centre for Occupational and Environmental Health, as an initiative to meet the well known and documented air quality problems faced by the South Durban Basin (SDB) community. The UKZN undertook a health study and health risk assessment to assess the impact of air pollution to human health in the SDB.
The UKZN Health Study concluded that “industrial pollution has a negative impact on the respiratory health of South Durban Basin residents including children attending schools” (UKZN Health Study, 2007). It also raised concerns with regard to emissions of toxic substances which depending on the concentrations and potency can cause potentially significant cancer and non-cancer health risks. Amongst many recommendations of the UKZN Health Study was that ‘an aggressive schedule be implemented to reduce total reduced sulphur (TRS) and
hydrogen sulphide (H2S) emissions in the SDB as odours are perceived by community as exceeding concentration guidelines” (UKZN Health Study, 2007).
This background forms the basis for conducting this study in the SDB of eThekwini Municipality. It is aimed at developing an appropriate and sustainable approach in the application of CP options to mitigate environmental challenges especially nuisance and toxic odours emissions in the SDB.
1.3BACKGROUND TO THE STUDY
The promulgation of the new National Air Quality Management Act (2004) required that each municipality developed an Air Quality Management Plan (AQMP) aimed at resolving air quality concerns and issues (AQA Act, 2004). The eThekwini Municipality, faced with known environmental challenges in the SDB, responded to the AQA requirement and embarked on an AQMP development process to ensure that the ambient air does not impact on health and well being of eThekwini citizens. This process has engaged all stakeholders including industry, communities and authorities in order to agree on the priorities and themes to be incorporated into the AQMP. The thematic topics agreed upon by stakeholders were:
· emissions of
o sulphur dioxide (SO2), o particulate matter (PM10), o benzene, odours,
· odours in general,
· the impact of the Jacobs Industrial Complex (JIC) on air quality,
· flaring by the oil refineries and other industries
· and indoor air quality in informal settlements.
The justification for the prioritization was based on data emerging from the SDB air quality monitoring network, the health studies undertaken and record of public complaints (eThekwini Municipality AQMP, 2007).
The Jacobs Industrial Complex (JIC), targeted for this study, is one of six industrial complexes in the SDB of eThekwini Municipality. The study of the JIC was initiated by eThekwini Environmental Health Services (EHS) as one of thematic topics to be incorporated into development of eThekwini AQMP. The purpose was to understand the impact of such a complex on air quality and surrounding communities. Among many other air quality issues identified in the JIC, odorous emissions were found to be the main problem impacting on air quality and surrounding communities. The problem is supported by a number of odour complaints received by EHS from the JIC and surrounding communities. Complaints are a result of a mixture of industrial emissions by
various industries located within and outside the JIC. The challenge faced by EHS is controlling, managing and regulating these odorous emissions by industries in the SDB.
1.4. RATIONALE FOR THE STUDY
The SA constitution has laid the foundation by declaring everyone’s right to a clean and healthy environment for the current and generations to come (RSA Constitution, 1996). Sustainable development can be achieved by applying a number of environmental management tools. According to Van Berkel (2001) CP has proved in many practices to be another useful tool in the prevention and abatement of industrial wastes and emissions. A number of debates have supported the enforcement of regulatory instruments by
authorities to achieve pollution reduction by industries. Hanks and Janisch (2003) argue that public authorities should drive pollution reduction by setting standards, conducting inspections, monitoring operations and enforcing compliance to the standards to violators through legal sanctions. The Western Australian Sustainable Industry Group, formed in 1997, has also called for authorities to adopt CP principles and approach in implementation of policies, permitting procedures, conducting inspections and enforcement actions (Van Berkel, 2001). Buckley (2004) also agrees that regulatory approach as a tool for CP brings about a more co- operative approach between authorities and the industry in the setting and enforcement of standards. Hanks and Janisch (2003) suggest other regulatory instruments applicable in promoting CP to include setting of effluent discharge standards which limit the amount of effluent discharge to the environment; banning of certain substances, technology or a product use which may have severe environmental consequences; inclusion of CP implementation within bylaws; and requirements for CP audits to be undertaken as part of the permitting requirements. This study seeks to apply a regulatory approach and enforcement in the implementation of CP by industries and to develop an appropriate approach in incorporating CP in the regulation of odour producing industries in the SDB.
1. 5 ROLE OF THE INVESTIGATOR IN THE STUDY
The researcher is employed by eThekwini Municipality EHS section as a senior environmental practitioner based in the Pollution Control and Risk Management (PCRM) section. This is the section responsible for Air Quality Management in eThekwini Municipality as required by the RSA National Framework for air quality.
The researcher’s job responsibility involves co-ordination of EHS activities and some of the air quality projects.
The researcher has been responsible for co-ordinating the CP project for the drum reconditioning company in this study. The project responsibilities included facilitation, planning and coordinating the implementation activities of the project among all involved stakeholders.
1.6 AIM OF THE STUDY
The main aim of the study is to assess the application of CP in preventing and mitigating environmental emissions of odours by industry in the SDB. It is specifically aims at assessing the application of CP in guiding the permitting of odour producing industries in the JIC. The study assesses the implementation of a CP project in a drum reprocessing company and also makes reference to other previously conducted CP case studies in Durban, namely Waste Minimisation Clubs (WMCs) undertaken in textile and metal finishing industries. The lessons learnt from the case studies’ analyses are used for recommending an appropriate approach for incorporating CP in the permitting of odour producing industries in JIC.
1.7 STUDY OBJECTIVES
The study focused on the following specific objectives:
1. Prioritizing major odour producing industries in the JIC.
2. Case study assessment: Assessing the implementation of a drum reprocessing company CP project in the JIC and referring to two Waste Minimisation Clubs conducted in Durban.
3. Drawing lessons of CP approach by assessing the case studies, focussing on similarities, differences, successes, failures, barriers and drivers.
4. Recommending a strategy for incorporating CP in the scheduled trade permitting (STP) of odour producing industries in the JIC.
1.8 THESIS OUTLINE.
Chapter One introduces the research context, the eThekwini Municipality and SDB challenges that triggered the study, and provides the background and rationale for the study and concludes by providing the aim and the objectives of the project.
Chapter Two provides a detailed problem statement and SDB area description in terms of its physical location and meteorological conditions influencing the movement of pollutants, and also includes the political history of human settlements that resulted in environmental disagreements between the communities, authorities and industry. It provides information on the regulatory framework for air pollution and odours in terms of responsibilities for the three levels of South African government. It also provides details on the odour producing industries and odour emissions issues in the JIC and concludes by presenting the odour complaints graphical and Geographic Information System (GIS) maps’ analyses results. This is a system of hardware and software used for mapping and analysis of geographic data.
Chapter Three reviews literature relevant to this study and aims at highlighting the theoretical basis for gathered data analyses. This chapter focuses on reviewing literature on the cleaner production (CP) concept and techniques used, and includes a history of CP in SA. It further provides theory on odours, the application of CP in odour control and how odour is regulated by other countries. The regulatory context of CP in South Africa is reviewed and ways in which it can be promoted through regulation are discussed. The chapter concludes by providing information on the eThekwini Municipality Scheduled Trades industry permitting process.
Chapter Four details the research methodology applied in this study while Chapter Five presents the case studies’ description and analyses.
Chapter Six presents, in a tabular form, the comparative analyses of the case studies focussing on similarities, differences, successes, failures, barriers and drivers.
Chapter Seven presents a summary of the findings, draws conclusions and provides recommendations for a strategy to incorporate CP in the permitting of odour producing industries in the JIC, the realisation of objectives and way forward on the study.
CHAPTER TWO PROBLEM DESCRIPTION
The previous chapter introduced the study and provided the background information including the aim and objectives of the study. This chapter provides in details the problem description of the JIC, the targeted area for this study. It provides a physical description of the area, the Durban meteorology which influences the wind patterns in the South Durban Basin (SDB); the history of human settlements and the location of industries in the SDB. It also presents the odour complaints’ statistics analyses for the period 2005 to 2007 in the form of graphs. It concludes by identifying the major odour producing industries in the JIC.
2.1. PHYSICAL DESCRIPTION OF THE SOUTH DURBAN BASIN AREA
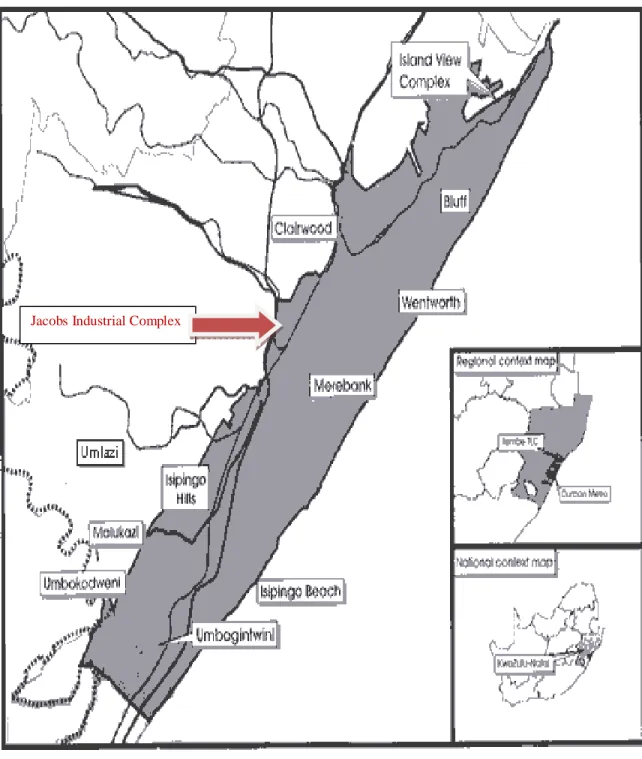
The SDB is an area approximately 4 kilometres wide and 24 kilometres long, extending from the Durban Central Business District (CBD) southward to Umbongintwini (See Figure 2.1) It is seated on the north east of the southern freeway, south west of the Bluff ridge (UKZN Health Study, 2007) and south east of the Durban harbour, which is the busiest port in Africa and also the main point of entry for containers into South Africa (Gaustella and Knudsen, 2007). Its boundary to the east is the Indian Ocean (SDCEA-DN, 2004). The SDB area is considered to be the industrial and economic hub of the province of KwaZulu-Natal (KZN). It contributes to approximately 8% of the country’s GDP (Chetty, 2005) and 90% of South Africa’s chemical requirements (SDCEA, 2008). The area is characterized by a mixed land use of industrial and residential areas in close proximity to each other. According to Gaustella and Knudsen (2007), SDB also serves as a focal point of major transport routes, including highways and the harbour and home to the huge Island View storage and loading facility owned by 17 private companies to store and loads various chemicals (SDCEA, 2008).
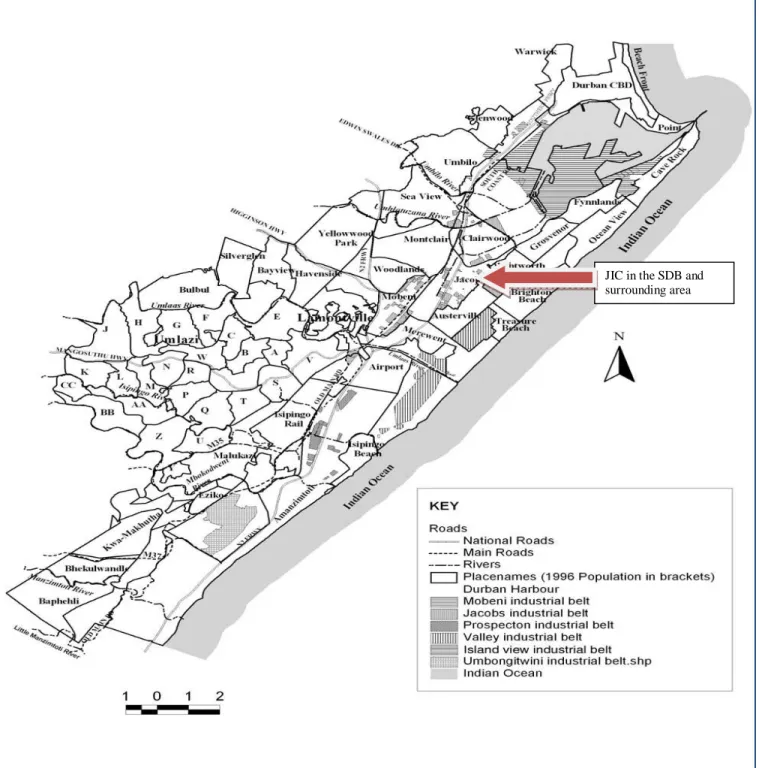
The SDB has six major industrial belts. These industrial belts include the Valley Industrial Belt (comprising of two major refineries and a large paper manufacturer, the JIC, the Mobeni, the Island View, the Prospecton and the Umbongintwini Industrial Belt. These industrial complexes, due to their operations, continuously emit various emissions into the atmosphere which impact on the air quality. Within these industrial areas are several residential areas including Clairwood, Bluff, Isipingo, Merebank, Montclair, Umlazi, and Wentworth, which for years have endured the environmental health and social costs of pollution from the adjacent industries (SDCEA-DN, 2004). The JIC targeted for this study, forms part of the SDB area (see Figures 2.1 and 2.2).
Figure 2.1: Map showing South Durban Basin areas and highlighting the position of the JIC (SDCEA-DN, 2004)
Jacobs Industrial Complex
Figure 2.2: Position of the JIC in relation to the residential community (SDCEA-DN, 2004) --9--9
2.2 METEOROLOGICAL CONDITIONS IN THE SDB
The SDB is described to have a basin-like topography configuration that promotes pollution build up. This means that if the accumulated pollution is not dispersed by wind conditions, communities will be exposed and suffer from the pollution impact. Mamopeli and Diab (2003) identified among other environmental emissions
JIC in the SDB and surrounding area
such as odours, sulphur dioxide to be the major pollutant in the SDB. The behaviour of pollutants in the city of Durban is influenced by meteorological factors such as temperature, solar radiation, precipitation, cloud cover, barometric pressure, water vapour, wind speed, wind direction, atmospheric stability, turbulence and mixing depth (UKZN Health Study, 2007). The level to which the community is exposed to pollution depends on the amount released, its duration in the atmosphere, and the atmospheric processes that affect the movement of air and air masses (SDCEA-DN, 2004). Communities in the SDB, due to the area’s topography, are highly exposed to various air pollutants from industries located in the area.
The respective Bluff and Berea ridges play a significant role in controlling wind flows in the SDB with valleys channelling wind in and out of the basin (SDCEA-DN, 2004). According to Preston-Whyte (1968) the Bluff ridge prevents movement of cold air from the mountains and obstructs transportation of pollutants into the Indian Ocean hence the high concentration of air pollutants in the SDB. North easterly (NE) and south westerly (SW) winds are regarded as the most common wind directions in the SDB. This means that, communities located downwind of these directions will be those most impacted by pollution. Winds blowing from a SW direction are commonly strong and bring rain (UKZN Health Study, 2007).
In summer the wind speeds are generally higher with frequent unstable conditions in Durban; these conditions are caused by heated air mass expanding and rising (SDCEA-DN, 2004). These wind movements often result in storms with strong updrafts and downward flows of cool air thus promoting dispersion of atmospheric pollutants (UKZN Health Study, 2007). This result in lower pollution levels in nearby communities and less pollution-related complaints to authorities. The Gaustella and Knudsen (2007) report also confirms that dispersion conditions are improved during the summer months due to less stable air conditions, higher wind speeds and increased rainfall, which effectively ventilate the area and mix the pollution to acceptable levels (Gaustella and Knudsen, 2007).
According to the SDCEA–DN (2004) report, the South African winter is characterized by high pressure cells that move northwards, producing light winds and unfavourable dispersive conditions. This type of condition is caused by limited upward movement and the air tends to move horizontally. This is due to winter cold air which tends to sink rather than rise. The boundary layer is created by cold air and inhibits diffusion of
pollutants between stable air above and polluted air underneath, trapping the pollutants and exposing
residents to high levels of pollution thus triggering complaints by the affected residents (SDCEA-DN, 2004). It is clear that high levels of pollutants are connected to low wind speed conditions especially at night and early morning in winter. The Gaustella and Knudsen (2007) report confirms that this condition is due to poor vertical
mixing and low horizontal transport of pollutants out of the source area. Holzeworth (1972) suggests that the speed should be at least 6 metres per second (6m/s) to transport pollutants out of the SDB area. Occasionally during some winter mornings, a cloud layer is observed over parts of the SDB as evidence of an inversion layer trapping pollution below (SDCEA-DN, 2004). Preston-Whyte (1980) has confirmed that the winter season registers the highest number of pollution episodes in the SDB.
During the day the pollution plume is moved by NE winds vector from the sea to the city (Preston-Whyte &
Tyson, 2000). At night, through land warming during the day, land breeze currents direct air towards the sea causing continuous re-circulation of pollutants in the area (Preston-Whyte, 1968). These movements are influenced by the variations of day and night temperatures in Durban and the wind speed. The UKZN Health Study (2007) confirms that wind shifts result in dramatic changes in pollutant levels when either clean air or polluted air is transported into the SDB. According to Preston-Whyte and Tyson (2000) wind speeds are slower between May and June and faster between September and October.
An article released by the eThekwini Municipality (1999) indicates that pollutants released may travel vast distances. This means that pollution generated in the SDB can also impact communities located far from source.
This highlights the importance of the knowledge of air pollution meteorology for air quality modelling, urban planning, zoning of residential areas, location of polluting industries and planning transport routes including location of air quality monitoring stations. Since the topography and meteorological conditions cannot be changed in the SDB, it is important pollution prevention measures be implemented to protect and reduce exposure of residents to pollutants.
2.3 ETHEKWINI ENVIRONMENTAL HEALTH SERVICES AIR POLLUTION MONITORING The eThekwini Municipality EHS Pollution Control and Risk Management (PCRM) Unit in partnership with the national government, SDB community, and the Norwegian Institute for Air Research, commissioned a Multi Point Plan (modern air quality network) in the SDB in 2003. The purpose of the network was to quantify air quality levels in the SDB area, quantify industry compliance with air quality standards and assist in providing means of verification for dispersion modelling system. The design of the monitoring network system was under the technical guidance of the Norwegian Institute for Air Research (eThekwini Air Quality Monitoring Network Annual Report, 2009).
PCRM currently has 13 monitoring stations located in the SDB area with five being meteorological stations and three background stations. These stations continuously quantify and measure a range of priority pollutants (such
as oxides of nitrogen, particulate matter, carbon monoxide, total reduced sulphur, ozone, benzene and lead) and meteorological parameters (such as wind direction, wind speed, relative humidity, barometer pressure, solar radiation and change in temperature) focusing on industry and traffic pollution. The network captures up to 87% of pollution data and above 90% of meteorological data operating under strict international quality control standards.
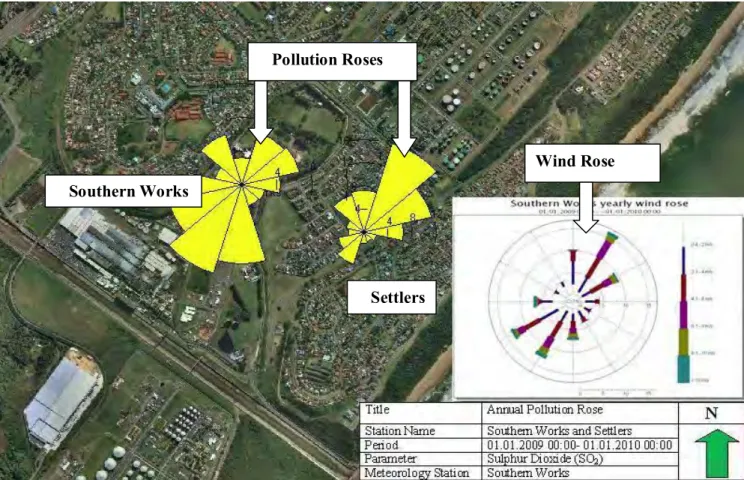
Data captured by eThekwini monitoring stations are accessed through an air resource manager programme known as ENVISTA. This programme allows for data to be reported on different time intervals. All data undergoes a manual quality check before reporting. The data are used by PCRM to generate reports, wind roses, pollution roses and modelling. Whilst wind rose groups and illustrates wind speed and wind direction over a period of time, pollution rose illustrate pollution concentration as a function of the wind direction. Measuring wind speed and direction assist in identifying the source of pollution (eThekwini Air Quality Monitoring Network annual report, 2008). Examples of wind rose and pollution roses are shown in Figures 2.3 and 2.4.
Figure 2.3: SO2 Pollution and wind rose at Southern Works and Settlers monitoring stations (eThekwini Air Quality Monitoring Network Annual Report, 2008)
Settlers
Wind Rose Pollution Roses
Southern Works
Figure 2.3 is an example of a map generated by PCRM with pollution and wind roses illustrating the source of SO2 recorded by the Southern Works and Settlers monitoring stations in 2009. The pollution rose in this map indicates that the highest concentration of SO2 was emitted in the NE wind vector at Settlers station, SW wind vector at Southern Works station. These SO2 emissions are linked to the two local refineries as indicated by the map. The wind roses illustrate the prevailing wind movements at a time of recording to be NE and SW wind vectors. These are tools used by PCRM pollution for planning intervention.
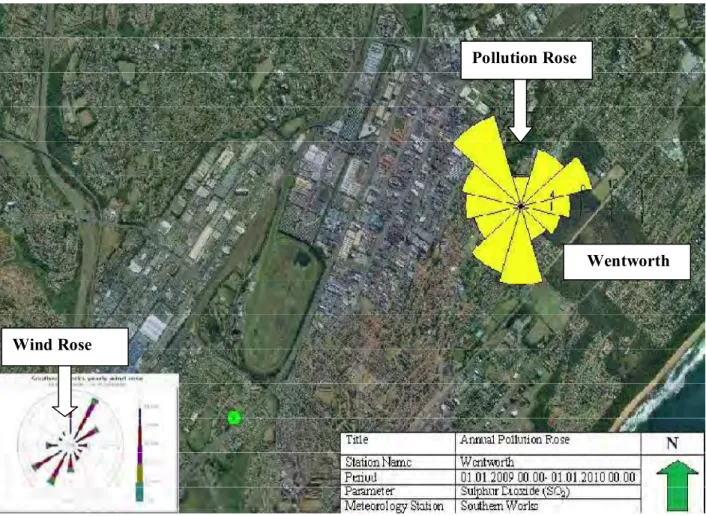
Figure 2.4: SO2 Pollution and wind rose for Wentworth monitoring station (eThekwini Air Quality Monitoring Network Annual Report, 2008)
Figure 2.4 is an example of a map illustrating SO2 pollution rose with concentrations recorded in the Wentworth monitoring station. This rose indicates the highest concentration of SO2 in the North, NW, Southerly and NE wind vectors. The possible highest SO2 emitter in the NW direction is a sugar manufacturing company; a
Wind Rose
Pollution Rose
Wentworth
possible source from the southerly direction pointed at the major paper manufacturing company and local refineries.
Both wind roses in Figures 2.3 and 2.4 confirm prevailing wind vectors to be NE and SW. Whilst these tools are used by PCRM to obtain the actual concentrations of a measured pollutant recorded by a monitoring station, atmospheric dispersion modeling is another tool used by PCRM to predict or estimate the possible concentrations in relation to the source in targeted areas where there are no monitoring stations. Modeling assists in understanding the impact of pollution at a targeted community area. A model is validated by the actual concentration measured by the monitoring station. Such information is generated by PCRM on a number of measured parameters. Odour is still investigated for possibility of inclusion into the existing monitoring network. This would assist in setting standards for enforcement to odour producers. This study used the PCRM meteorology (wind direction and wind speed) data in the complaints statistics analyzed in 2.7.1.
2.4. HISTORY OF HUMAN SETTLEMENTS AND INDUSTRIES IN THE SDB
There are different opinions and beliefs regarding the history of human settlements and industry location in the SDB which has created interest worldwide in terms of its serious community health and environmental challenges. It is commonly understood that the history of locating communities on the doorstep of industry is a result of the apartheid town planning era which neglected both the cumulative and synergistic effects of pollution to surrounding residential communities (Groundwork Series, 2002). The same report indicates that the priority at that time was to ensure location of the working class in close proximity to industry for provision of labour. The industrial zoning of the area attracted more industries thus communities also increasing. According to the UKZN Health Study (2007) this situation has been the cause of conflict and dilemma between all stakeholders regarding the environmental impacts caused by these industries affecting increasing surrounding communities.
The South Durban Community Environmental Alliance (SDCEA) activist Desai believes that the SDB area was intentionally zoned for industrial development with previously disadvantaged communities relocated to make provision for growth of industrial complexes. He continues to politicise the situation and believes that the black communities were against their will forced to reside downstream and downwind from industrial complexes impacted by pollution. The Groundwork Series (2002) agrees with Desai that this situation was created when the previous apartheid Durban Town planning division began implementing the plan of separating people based on the race to reduce labour costs for industry.
Figure 2.5 shows the view of the mix land use in the SDB, Wentworth and Bluff residential community location in relation to major refineries.
-14-
Figure 2.5: SDB residential-industrial collocation (Gaustella and Knudsen, 2007).
It is obvious that this situation is continuing to pose hazards to the health of these residents. Godish (1991), argues that air pollution problems and social concerns should be blamed on the lack of meteorological understanding of planners at that time and he believes that nowadays the situation is different. It is evident that
Refinery 1 Refinery 2
Wentworth residential area located next to refineries
Bluff residential area
communities in the SDB have suffered the implications of mix land use and exposure to industrial pollution for decades. The UKZN Health Study (2007) confirmed that the exposure of communities to industrial pollution is attributed to factors such as close proximity location of residential areas to industries, land contours, prevailing meteorological conditions, lack of emissions control and use of short emissions stacks by industries. The SDB ABM (2009) report identified lines of communication as another challenge in the SDB between the city, organized stakeholder groups, big businesses, community organisations and environmental groups.
The history of environmental activism started in 1996 when the South Durban Community Environmental Alliance (SDCEA) was established by concerned non-governmental organisations (NGOs) in the SDB (Groundwork Series, 2002). This alliance has since been very vocal and straight-forward with all stakeholders, including industry and authorities in addressing environmental concerns affecting SDB communities.
According to the Gaustella and Knudsen (2007) report, the joint effort of the SDCEA with persistent complaints to government regarding high pollution levels, unknown odour emissions, chemical leaks, flares, visible emissions and health complaints, ultimately triggered national response to meeting pollution challenges in the SDB (Gaustella and Knudsen, 2007).
2.5CO-OPERATIVE GOVERNANCE AND SPECIAL INTEREST GROUPS
The South African Constitution has made it a requirement that the national and provincial governments contribute to the responsibilities for managing environment in South Africa, whilst also mandating local government to deliver on the peoples’ right to a clean and healthy environment (RSA Constitution, 1996). On the other hand the NEMA Act (1998) established DEA as a leader in environmental management, with an approach of cooperative governance which ensures involvement of all levels of government including participation of interested and affected parties. This approach has brought significant success in dealing with environmental challenges faced by SDB communities.
This was evident when the national and provincial ministers in collaboration with the eThekwini Municipality mayor responded to the SDB environmental challenges by announcing the Multi-Point Plan (MPP) on the 27th of November 2000 (Gaustella and Knudsen, 2007). The plan ensured that joint actions were taken at national and local levels, which, according to the Groundwork Series (2002), gave concrete meaning to co-operative governance. The MPP activities were taken forward by various inter-governmental teams, multi-stakeholder forums, the Department of Labour, industry, and the three spheres of government. This was welcomed by SDCEA as a move towards participatory democracy and an answer to the long experienced challenges in contacting the key decision makers (Groundwork Series, 2002). The project director Siva Chetty (2007) viewed MPP as an overarching plan to:
· Address air pollution management in an industrialized area,
· Reduce exposure of pollutants to compliance levels, and
· Develop strategic institutional response to the problem.
The Gaustella and Knudsen (2007) report also agreed that the SDB MPP case study was a good example of showcasing a stakeholder involvement process between the local community, government and industry which made MPP realised its purpose of delivering quantifiable results. The success of co-operative governance in the SDB continued to be evident in the development of eThekwini Air Quality Management Plan and the new eThekwini Health and Water & Sanitation Services five year Scheduled Trades (ST) permitting process for major polluting industries. According to Chetty’s (2007) presentation at the Air Quality Governance Lekhotla, the new ST permitting approach has resulted in significant (77%) sulphur dioxide emissionreductions. The eThekwini Monitoring network annual (2008) report also indicated continuous improvement in general air quality in the SDB over the years for most of the priority pollutants. This is attributed to government commitment, multi-stakeholder engagement and an action oriented management model. Although these reports indicate successful reduction of priority pollutants, more focus needs to be placed on odorous emissions which are signalling an unknown level of exposure to unidentified emissions.
2.6REGULATORY FRAMEWORK FOR AIR POLLUTION AND ODOURS
Since 1965 the control of air quality has been guided and influenced by the Atmospheric Pollution Prevention Act (APPA) Act No. 45 of 1965. On the 11th of September 2009 the NEM: Air Quality Act of 2004 repealed the whole APPA ( Shabalala, 2009 ) due to a number of loopholes which did not set targets to ensure that the right to a clean and healthy environment set by SA constitution is fulfilled.
NEMA, as amended, was promulgated in 1998 and provided a legislative support for managing environment in the Republic of South Africa (NEMA, 1998). The same act also provided for collective environmental control by defining principles to govern environmental management decisions. It has formed the basis for successful initiatives in fighting pollution in the SDB. In 2004 the air quality legislation, namely AQA (Air Quality Act) came into effect thus representing a move from source-based to an integrated effects based air quality control (AQA, 2004). It also details standards to control ambient air quality levels whilst also setting emission standards to reduce the level of air pollution to the environment (AQA, 2004).
2.6.1 Government roles and responsibilities
The National Framework (2007) was established by the South African government to manage air quality and address the air pollution struggle by promoting cooperative governance as well as ensuring that every role- player takes responsibility in progressively ensuring unpolluted ambient air for SA citizens. It is also clear about which level (sphere) of government needs to drive air quality management in SA (National Framework, 2007). The roles and responsibilities, played by different levels of government including other parties in the fight against pollution, are described.
2.6.1.1NATIONAL government role
The Department of Environmental Affairs (DEA) has been given the national leading responsibility for environmental and air quality management. The responsibilities mandated include providing national norms and standards for ensuring a coordinated and integrated air quality management in South Africa (National Framework, 2007). This responsibility means providing guidance to all provincial, local and other sectors on environmental management.
2.6.1.2Provincial role
The National Framework (2007) mandates provincial environmental departments to lead provincial environmental and air quality management. Every province is required to develop, where necessary, provincial norms and standards to achieve a coordinated and integrated air quality control. Provincial MECs are mandated, where necessary, to prescribe measures for managing dust, noise and offensive odours in the respective provinces (National Framework, 2007).
2.6.1.3Municipal role
According to the National Framework (2007) municipalities (local government) have been given a number of roles pertaining to air quality management including:
· Designating an AQO (Air Quality Officer) in its structure.
· Developing an Air Quality Management Plan which should be incorporated into the Integrated Development Plan (IDP) as stipulated in Chapter 5 of the Municipal Systems Act, and
· Reporting on an annual basis on the AQMP implementation progress and compliance.
The Framework is clear that air pollution is one of the matters over which a local government has authority and are entitled to use their powers in performing air quality functions without national or provincial government impeding its right including bylaw development. The eThekwini Municipality therefore has a responsibility and a right to develop any strategy that will contribute to improving air quality of eThekwini citizens. Although
some battles have been won on the reduction of certain priority pollutants, more work needs to be undertaken to reduce odorous emissions especially in the SDB area.
2.6.1.4 Industry
The Framework (2007) also gives industry a responsibility, as emitters of emissions, to comply and protect the right to clean air that is not detrimental to the well-being of citizens as stipulated in Section 28 of the NEMA.
Industry is therefore required to implement appropriate measures to prevent, minimise and correct
Any form of environmental pollution or degradation. The AQA also makes provision for certain industries to control their operations in order to avoid odour emissions (AQA, 2004). The SDB’s challenges of odour emissions can be met by each industry taking responsibility to identify, manage and control odour emissions in its premises.
2.7 JACOBS INDUSTRIAL COMPLEX AND ODOUR PRODUCING INDUSTRIES
The Jacobs Industrial Complex (JIC) has been targeted since it is part of the broad SDB. It is characterised by a mix of small to medium, legal, and illegal, industries emitting various chemicals to the atmosphere. Adjacent the JIC are residential and industrial areas, namely, Mobeni, Clairwood, Merebank, Austerville, Wentworth and Montclair, which are impacted by JIC industrial operations emissions (see Figure 2.4). A growing trend in mixed land use development has been observed in many world countries. Jabbra and Dwivedi (1998) indicated that challenges with mixed land use are often caused by lack of pollution abatement plants by industries and emissions released resulting in respiratory illnesses. Physiological effects such as nausea, headaches, watery eyes, chest pains and many more have been reported by SDB communities. The UKZN Health Study (2007), as discussed in Section 2.3, has confirmed respiratory problems experienced by SDB residents. This calls for regulators to use their regulatory responsibilities and enforce good environmental practices and sustainable development principles to industry. A database of the JIC industries available from eThekwini Health Department has shown a wide range of industries types operating in the area. These industry categories include, among other:
· Chemical processing
· Furniture manufacturing
· Drum reprocessing
· Oil processing
· Petrochemicals
· Scrap yards / waste facilities
· Plastic manufacturing
· Engineering works
· Food manufacturing
· Panel beating and spray painting
· Rubber manufacturing
· Metal processing
· Cement manufacturing
· Paper processing
· Glass fibre and sand mining.
The range of substances handled by these industries include toxic and odorous substances, such as acrylates, ethyl glycol, superglue, volatile organic compounds, vegetable oils, sulphur compounds, acids, paints and many more. Besides the industrial activities impacting the area, there are other activities, such as illegal solid waste burning, tyre burning and cooking fire activities taking place in the area which impact on air quality. This calls for a holistic approach when dealing with air quality issues in the JIC. Barret (2002) confirms that certain operations are sure to create odour impacts and it is necessary that such impacts be assessed against ground level concentrations. Some of these operations to be included are:
· Agricultural industry
· Bitumen handling industry
· Breweries and distilleries
· Chemical industry
· Chemical storage facilities
· Composting facilities
· Drum reconditioning works
· Electricity generation works
· Livestock processing industries
· Mineral processing works
· Paper and pulp industry
· Petroleum refineries
· Sewage treatment works
· Waste facilities
· Wood processing and preservation works.
Some of these odour producing industry categories are present in the JIC and could be the source of the odour problems in the area. These industries fall in the categories of listed activities in the Schedule A of the Scheduled Trades and Occupations bylaws which requires them to be granted a Scheduled Trades (ST) permit to operate in the area. This study seeks to develop a sustainable CP approach in ST permitting of these odour producing industries in the JIC.
Figure 2.6. Jacobs Industrial Complex in relation to neighbouring communitiesdownloaded from eThekwini GIS
2. 8 THE JACOBS INDUSTRIAL COMPLEX ODOUR EMISSIONS PROBLEMS
The JIC has been identified by the eThekwini Environmental Health Services (EHS), South Durban Community Environmental Alliance (SDCEA) and surrounding communities, as creating an odour impact affecting surrounding communities. The odour impact is supported by data obtained from the eThekwini Health Department, SDB community structures and JIC industries information. This information has been useful in
Mixed land use impacting on JIC on NE wind vector
Residential area impacted by JIC on NW windsand on NE winds
Industrial complex in the SDB
Residential area impacted by JIC industries on SW windvector
understanding the extent of the problem, its impact and the source of the odour problems. Appendix 1 contains odour complaints data which have been analysed to show relevance to the quantification and qualification of the odour problems in the JIC.
2.8.1. JIC odour complaints statistics and analyses using graphs
Of the complaints received from 2005 to 2007 by the eThekwini Environmental Health Services (EHS) 70% are odour related complaints originating from the SDB and surrounding communities. It is the responsibility of EHS to respond to and investigate all environmental health related complaints including air pollution within eThekwini boundaries. The standard operating procedure for complaints administration by the emergency services requires that complaints are received via the eThekwini Emergency Services Unit call centre. This unit is responsible for directing and managing emergency responsibilities such as fire, emergency communication, and loss control and disaster management services. Complaints received by the emergency call centre administrators from the public are registered in a database for record purposes. All air pollution related complaints are directed to the EHS for investigation purposes. The environmental health practitioner (EHP) on standby responds by investigating the details of the complaint and provides feedback to the complainant and emergency call centre to close the complaint. It is the duty of the EHS to fulfil the legislative mandate in the National Framework (2007). It is through this administration system that the odour complaints statistics for JIC have been captured.
The JIC air pollution complaints data for the period 2005-2007 have been used for the purposes of this study.
This is the period when the air pollution response system was still active with proper record keeping. Odour complaints management response declined after 2007 due to decentralisation of services by the municipality which resulted in the movement of staff to new operating areas. The purpose of analysing the captured statistics is to understand the trends, dynamics around the odour problems and locate the odour producing industries (see Appendix 1: JIC 2005-2007 odour complaints).
During this period the total number of recorded complaints originating from the JIC and surrounding areas was 140. These complaints have been grouped and categorised according to distribution by wind speed and direction, quantity per wind direction, distribution by origin of complaint, distribution by odour types, distribution by time of the day, industry categories existing in the JIC, and the number of complaints recorded per year. The data are presented in a graphical format and described from Figures 2.7 to 2.14.
Figure 2.7 shows the distribution of JIC odour complaints relating to the wind prevailing in the area at the time of complaint. A high concentration of complaints is observed between 0 to 6 m/s wind speed. Preston-Whyte (1980) suggests that atmospheric conditions, during which more pollutants accumulate, lie below the vertically averaged wind speed of 6m/s. This is when the residential areas in the SDB are greatly affected by pollution and more complaints are received. He further explains that these atmospheric conditions take place in winter, late at night and early mornings due to low wind speeds. This means that communities, especially during winter nights, are exposed to high pollution levels. Figures 2.7 and 2.8 both confirm complaints distribution to be concentrated between 0-900 (NE)and 180-2700 (SW). This confirms the prevalent wind directions in the JIC which also triggers complaints from the community. The low wind speeds allow pollutants to be dispersed slowly out of the area thereby exposing the residents hence the high recorded exposure of SDB residents to pollution.
Figure 2.7: Distribution of complaints by wind speed and wind direction
Figure 2.8: The quantity of complaints per wind direction 0
10 20 30 40 50 60 70
SW NW NE SE E W
No of complaints
Wind direction
No of complaints
sSSWSEESSW
0 2 4 6 8 10 0 12 2 14
0 30 60 90 120 150 180 210 240 270 300 330 360
Wind direction (deg) Wind speed (m/s)
SW prevailing winds complaints: 180-2700
NE prevailing winds complaints: 0-900
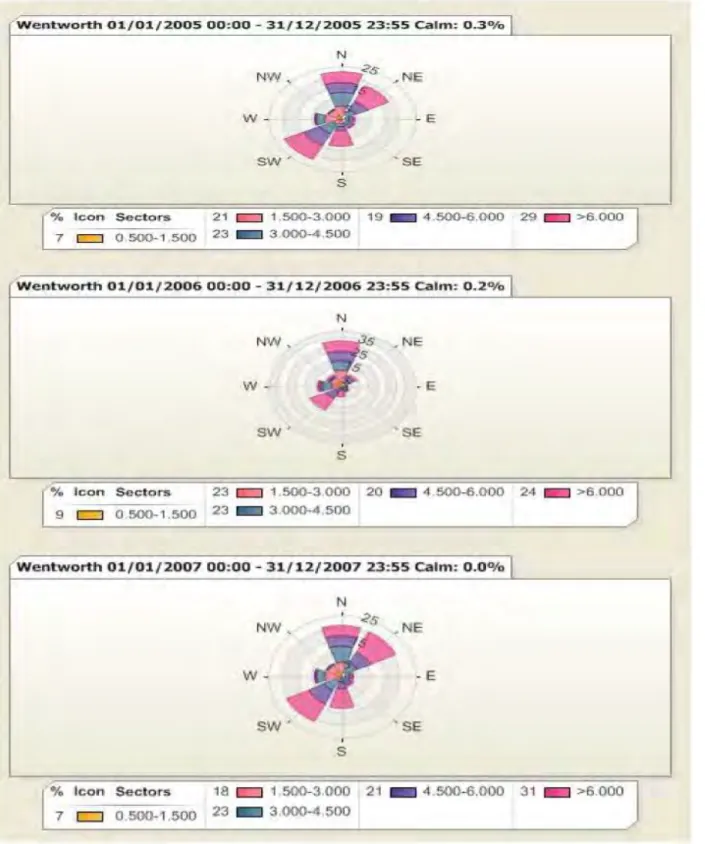
Figure 2.9 depicts wind roses illustrating prevailing wind vectors measured at the Wentworth meteorological data monitoring station in the period from 2005, 2006 and 2007 during which the complaints statistics were recorded. The roses illustrate the location or positions of these wind vectors to one another. These roses also indicate common wind vectors to range from North, North East, South and South West.
Wentworth 01/01/2005 00:00-31/12/2005 23:55 calm: 0.30/o N
-E
'SE
s
'Yo Icon Se-ctors 21 c:::J 1.500-3.000 19 - 4.500-6.000 29 ~ >6.000 7 c:::J 0.500-1.~00 23 ~ 3.00().4 ~00
Wentworth 01/01/2006 00:00-31/ 12/2006 23:55 calm: 0.2°/o
I
N
NW. . ~s ,NE
~~ s
w . ~ ;;
-ESW'
.
'SEs
Icon Sectors 23 c:::J 1.500-3.000 20 - 4.500-6.000 24 ~ >6.000 c:::J 0.500-1.500 23 . - J 3 OCI0-4 500
Wentworth 01/01/2007 00:00-31/ 12/2007 23:55 calm: O.OO/o N
w .
-Es
'Yo Icon Sec:to~s 18 c::::::J 1.500-3.000 21 - 4.500-6.000 31 111!:1 >6.000
7 c::::::J 0.500-1.500 23 ..:1 3 OCl0-4 500
Figure 2.9: Wind roses illustrating prevailing wind vectors in 2005, 2006 and 2007
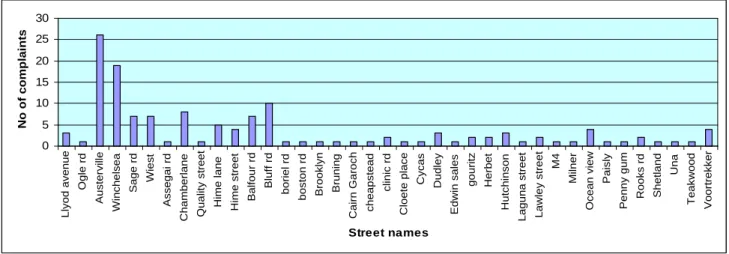
Figure 2.10 indicates most complaints originated from Austerville Drive (>25), Winchelsea (>15), Bluff Road (10), Chamberlane Road (> 5), Hime Lane (5) and Balfour Road (> 5). These are the streets locations inside the JIC and neighbouring areas. SDCEA offices are located in Austerville Drive and this NGO is
Active in reporting pollution complaints to the municipality. The increased number of complaints from Austerville therefore does not necessarily indicate the most impacted area but indicates the office from which most complaints are received by the municipality for investigation (Refer to Figure 2.6 for the Austerville area location in relation to JIC).
Figure 2.10: Distribution of complaints by origin.
The graph in Figure 2.11 indicates a high number of odour type’s complaints as being un-categorised thus cannot be described. The chemical type odours are also shown to be reported more often by complainants. This indicates a lack of knowledge in odour recognition and description by the complainants hence most odour types are reported as chemical odours. This indicates a need for communities to be trained on odour recognition in order to report proper information required for source investigations. Proper odour description can assist in linking the odour to the correct source for actions to be taken.
0 5 10 15 20 25 30
Llyod avenue Ogle rd Austerville Winchelsea Sage rd Wiest Assegai rd Chamberlane Quality street Hime lane Hime street Balfour rd Bluff rd boriel rd boston rd Brooklyn Bruning Cairn Garoch cheapstead clinic rd Cloete place Cycas Dudley Edwin sales gouritz Herbet Hutchinson Laguna street Lawley street M4 Milner Ocean view Paisly Penny gum Rooks rd Shetland Una Teakwood Voortrekker
Street names
No of complaints