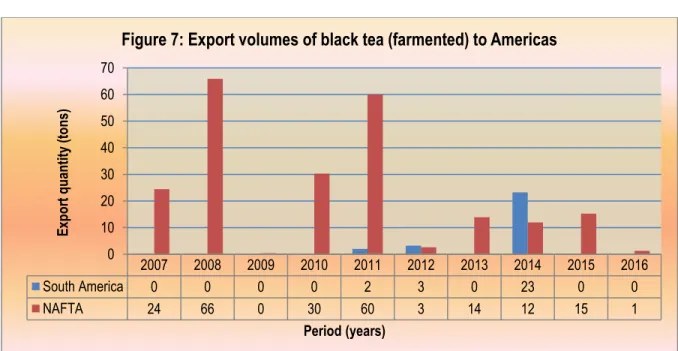
It is clear from the figure that in 2016, export volumes of black tea from South Africa to the. South America has had very intermittent export volumes of black tea from South Africa over the past decade. The export of black tea from Lejweleputswa District Municipality to the world also peaked in 2016 at an export value of approximately R312 805.
Black tea exports from iLembe District Municipality to the world also peaked at about R584 098 in 2009. Black tea exports from Bojanala District Municipality to the world peaked in 2010 with an export value of . Black tea exports from Siyanda Municipality to the world also peaked in 2014 with an export value of about R5 400.
Share Analysis
The graph further shows that the leading players of black tea (fermented) exports from the Northern Cape Province to the world was Namakwa District Municipality, followed by very low / discontinued exports from Siyanda District Municipality over the last decade. It is evident from the chart that exports of black tea from Namakwa and Siyanda District municipalities to the world were off a low base during the first half of the ten year period under review, falling by 100%. During the second half of the period under review, exports of black tea from the Namakwa District Municipality to the world were from a high base reaching a peak in 2015 at approximately R10 840.
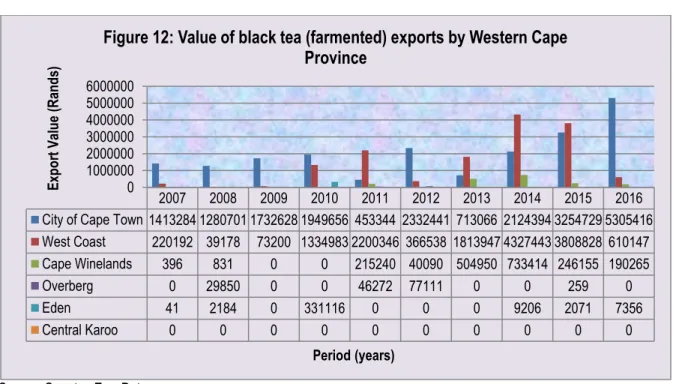
The figure further shows that in 2016, the value of black tea exports from Namakwa District Municipality to the world decreased dramatically to approximately 99.1% compared to the 2015 marketing season. The table further depicts that between 2007 and 2016, the City of Cape Town Metro municipality and the West Coast commanded the majority of black tea exported from South Africa to the world throughout the period under review. The table further shows that between 2007 and 2016, Cacadu District commanded the majority of black tea exported from South Africa to the world.
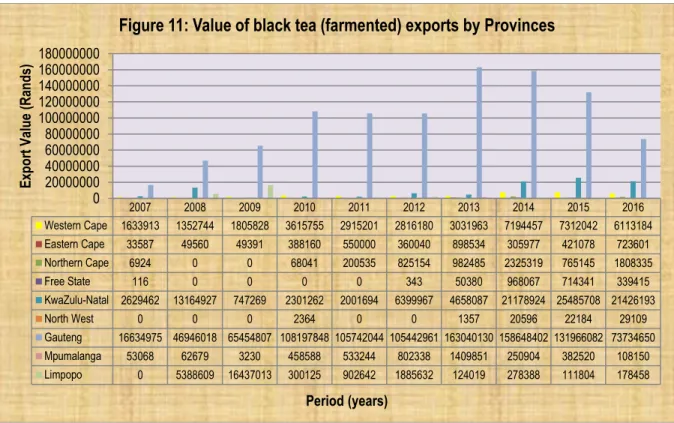
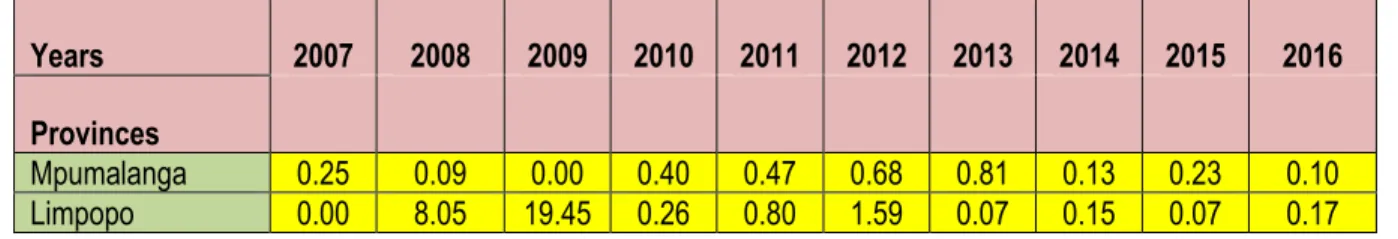
The table further shows that between 2007 and 2016, the Metropolitan Municipality of the City of Johannesburg had the largest share of black tea exported by South Africa to the world during the period under review. The table further shows that between 2007 and 2016, Vhembe and Capricorn municipalities had the largest share of black tea.
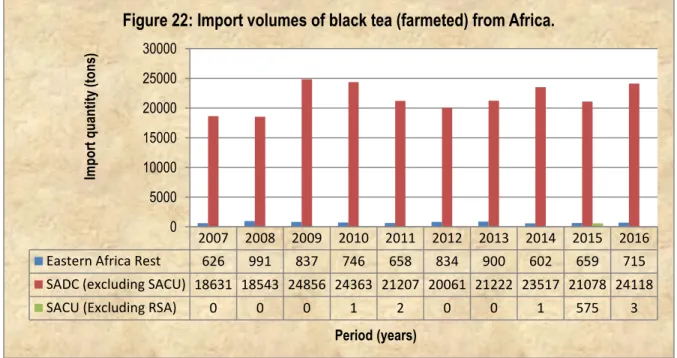
IMPORTS OF BLACK TEA
From the figure it is clear that SADC black tea imports to South Africa increased by 14.4%. The chart also shows that black tea imports from South America to South Africa were from a low base during the first half of the ten-year period to a peak of 325 tonnes in 2010. The chart further shows that during the decade of last, imports of black tea from NAFTA in South Africa was very low and no more than 3 tons per year.
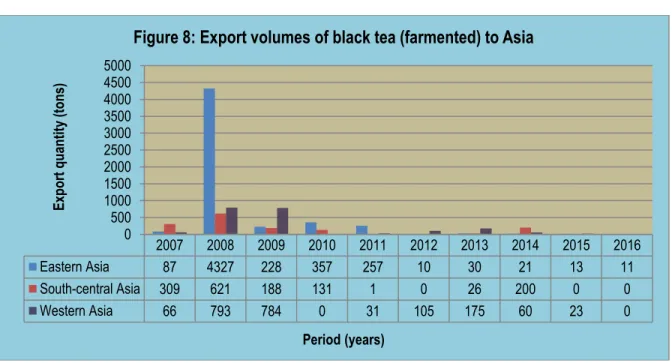
Figure 25 below shows the volumes of black tea (fermented) imports from Asia to South Africa over the past decade. Imports of black tea from Southeast Asia to South Africa peaked in 2008 at about 371 tonnes over the same period. The figure also shows that in 2015, black tea imports from South Central Asia to South Africa saw a slight increase of 197 tonnes compared to the 2014 marketing year.
The figure also indicates that black tea imports from the EU to South Africa were from a low base in the first half of the ten-year period studied and reached a maximum of about 26 tons in 2011. In the second half of the ten-year period, black tea imports from The EU to South Africa reached a peak in 2011 of approx. 33 tons. Imports of black tea from the EU to South Africa saw significant declines in 2009 and 2016 to lower levels of around 9 and 10 tonnes respectively.
During 2015, black tea imports from the European Union to South Africa experienced a significant increase of about 21 tons compared to the previous year. The figure further shows that in 2016, black tea imports from the European Union to South Africa fell by 23 tonnes and this represents a 69.7% decrease compared to the 2015 marketing season.
MARKET VALUE CHAIN
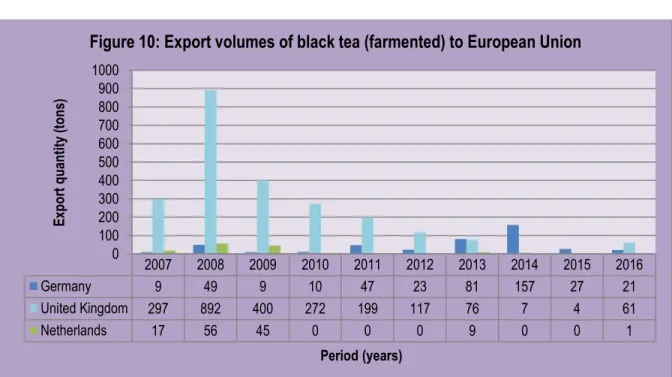
The figure further shows that the main supplier of black (fermented) tea imports from Europe to South Africa was the European Union, with no competition from other European regions. It is clear that Western Europe started importing black tea to South Africa in 2015 and reached a peak of 44 tonnes.
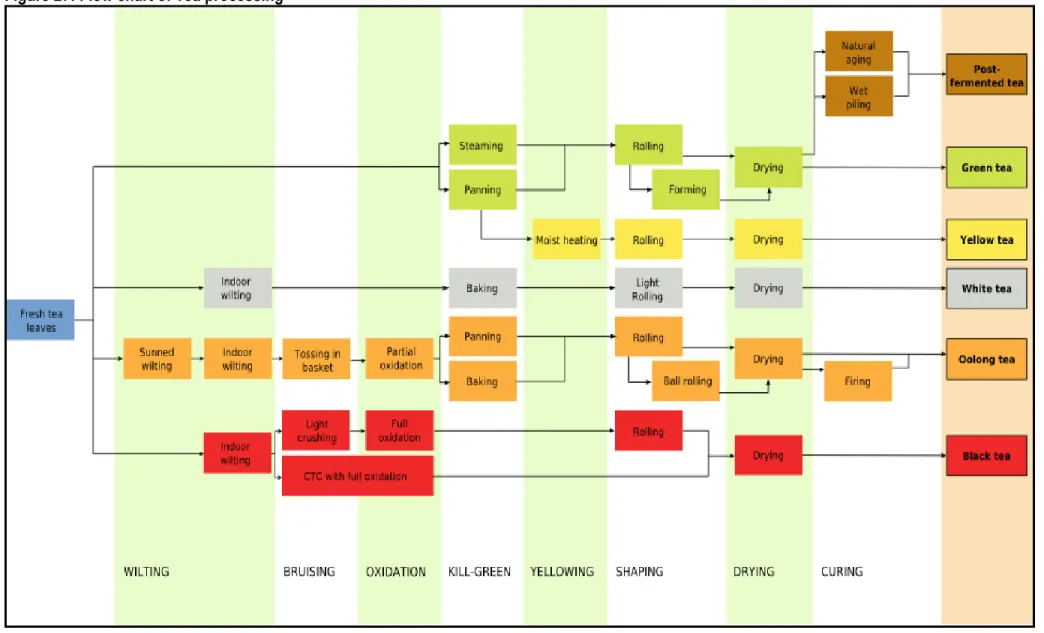
PROCESSING
Tea Picking and Harvesting
- At the Factory
- Fermenting
- Drying
The loose leaves then enter a process known as "rolling," which tears the leaf cells to release enzymes, and the leaves then curl or curl. Next, the leaves are exposed to hot air to stop fermentation by dropping the leaves through a chamber of perforated moving trays in a process called "burning." The following process is known as "CTC" because the tea leaf is crushed, torn and rolled.
In the production of CTC, after rolling, the tea leaves are passed through a machine called the CTC machine, where the leaves are cut or crushed to a greatly reduced size and most of their cells are ruptured. The crushed leaves are placed on trays or in troughs in a cool, humid atmosphere for up to two hours to ferment, or rather, oxidize. The trays are gently rotated many times throughout the period until all the leaves turn a golden brown color and fermentation is complete.
This is done by passing the broken fermented leaves slowly through hot air chambers, where all the moisture evaporates and the leaves turn dark brown or black. It is at this stage that the aroma changes from a sharp herbal to the familiar earthy tea perfume. It is then sorted into grades or leaf particle sizes by being passed through a series of wire mesh screens of varying sizes into containers.
The larger curly leaves are used for loose leaf tea bags, while the finer particles are used for tea bags. After each preparation, the tea factory is washed from top to bottom to ensure that the character of the completed preparation does not transfer to the next tea preparation.
MARKET INTELLIGENCE
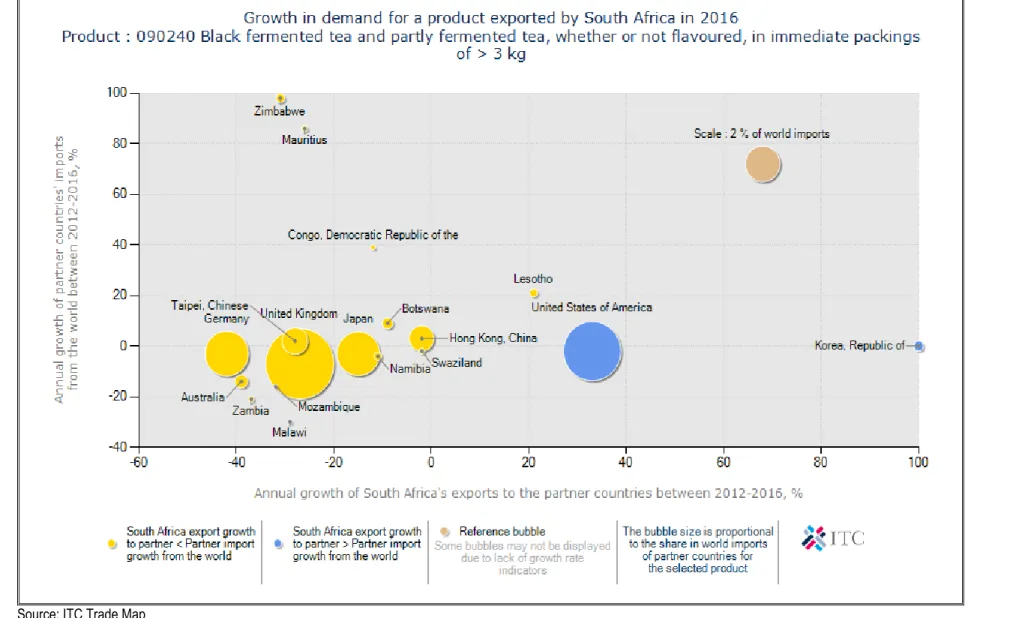
The table further shows that during the period under review, Namibia, Lesotho and Botswana were the largest import markets for black tea from South Africa. The table further shows that on a global scale, South African black tea exports to Namibia also declined in both value and volume by 11% and 28% respectively between 2012 and 2016. However, black tea exports from South Africa to Botswana declined negatively. value and quantity by 9% and 15% respectively.
It is also clear that exports of black tea from South Africa to Lesotho increased in value by 21% and decreased in quantity by 14% during the same period under review. The table further shows that the annual growth of black tea exports from South Africa to the Republic of Korea increased by 118% in a dynamic market. Namibia, Lesotho and Botswana have increased their share of South Africa's black tea exports during 2016 to approximately 19.5% respectively.
Other opportunities, but small markets for South Africa's black tea exports, exist in Congo, Malawi and Korea during the same period (2016) under investigation. Other small markets for black tea imports from the world into South Africa during 2016 were Kenya, China, Poland and Taipei, Chinese. It is important to note that imports of black tea originating in Switzerland into South Africa have increased in both value and volume by 315% and 0% respectively between 2012 and 2016.
Black tea imports from the United Republic of Tanzania to South Africa experienced a negative decline in value and quantity at 16% and 10% between 2012 and 2016. The bubble chart further shows that Kenya, Malawi, Tanzania and the United States of America were the largest markets for black tea imported by South Africa during the period under review. The import of black tea from China (one of the largest suppliers of black tea) to South Africa decreased in value and volume by 5% and 8% respectively between 2012 and 2016.
The bubble chart further indicates that Kenya, China and the United States of America were the largest suppliers of black tea from the world to South Africa in 2016.
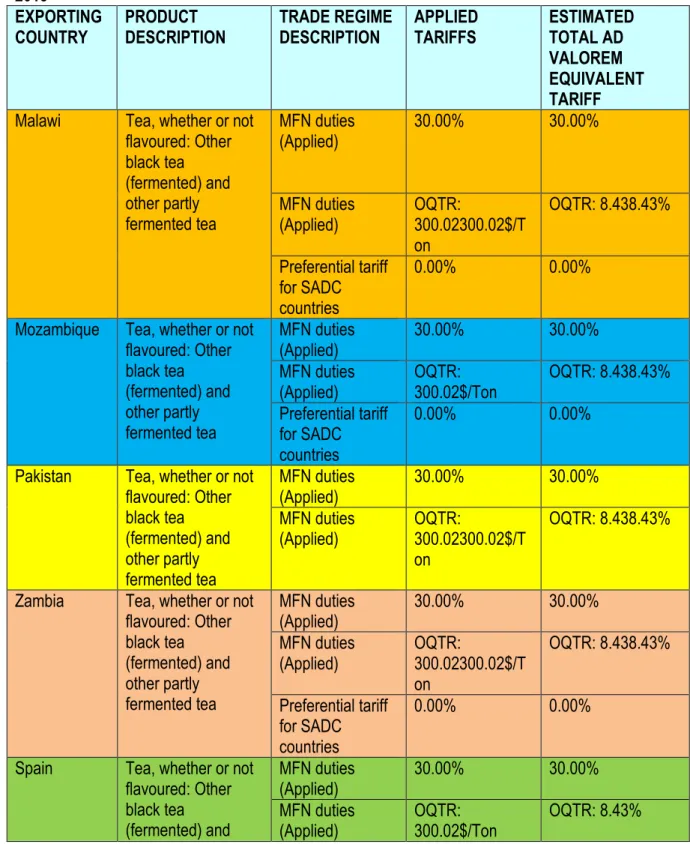
MARKET ACCESS
Netherlands Tea, whether or not flavored: Other black tea (fermented) and other partially fermented tea. China tea, whether or not flavored: Other black tea (fermented) and other partially fermented tea. Germany Tea, whether or not flavored: Other black tea (fermented) and other partially fermented tea.
Angola tea, whether or not flavored: Other black tea (fermented) and other partially fermented tea. Brazil Tea, whether or not flavored: Other black tea (fermented) and other partially fermented tea. Mozambique Tea, whether or not flavored: Other black tea (fermented) and other partially fermented tea.
Pakistan Tea, whether or not flavored: Other black tea (fermented) and other partially fermented tea. Kingdom Tea, whether or not flavored: Other black tea (fermented) and other partially fermented tea. India Tea, whether or not flavored: Other black tea (fermented) and other partially fermented tea.
USA Tea, whether or not flavored: Other black tea (fermented) and other partially fermented tea. Zimbabwe tea, whether or not flavored: Other black tea (fermented) and other partially fermented tea.
GOVERNMENT INTERVENTION IN THE BLACK TEA INDUSTRY
In 2003, the increase in the minimum wage also hurt the industry; because tea picking is a labor-intensive operation requiring about four units of labor per hectare, bringing production costs to about R16/kg. Production costs in tea producing countries such as Malawi, Kenya and Sri Lanka have low production costs between R8/kg and R10/kg and their labor costs are also lower. During the 2014 marketing season to date, most Tea Estates have closed shop for the reasons mentioned above, although in the Eastern Cape Province, there are initiatives to revitalize the two tea estates (Magwa and Majola) through the Rural Development Agency of Eastern Cape.
There are some existing tea estates in Limpopo and KwaZulu-Natal provinces (Tshivhase and Ntingwe) supported by the Limpopo Economic Development Agency (LEDA) and the KwaZulu-Natal Economic Development Agency.
ROLE PLAYERS IN THE BLACK TEA INDUSTRY AFRO INDIA TRADING cc LC PACKAGING
ACKNOWLEDGEMENTS