1
i
TABLE OF CONTENTS
SECTION A – INTRODUCTION ... 1
1. INTRODUCTION ... 1
1.1 INTRODUCTIONTONELSONMANDELABAY ... 2
1.1.1 THE REGIONAL CONTEXT ... 4
1.1.2 STRATEGIC DEVELOPMENT REVIEW (SDR) ... 6
1.1.3 SITUATIONAL ANALYSIS OF THE NMBMBUILT ENVIRONMENT,2019 .... 7
1.1.4 CLIMATE CHANGE CITY PROFILE AND RISKS ... 7
1.2 INSTITUTIONALISINGTHEBUILTENVIRONMENTPERFORMANCE PLANINTHEMUNICIPALPLANNINGSYSTEM ... 11
1.2.1 PURPOSE OF THE BEPP ... 12
1.2.2 ADOPTION OF THE BEPP BY COUNCIL. ... 13
1.2.3 PLANNING ALIGNMENT EXTERNAL AND INTERNAL:SDG’S,IUDF, BEPP,IDP,SDF AND BUDGET ... 13
1.2.4 ALIGNMENT OF BEPP,IDP AND MSDF ... 15
1.2.5 FOSTERING ALIGNMENT AND TRANSVERSAL ARRANGEMENTS FOR BEPP PREPARATION AND MAINTENANCE ... 17
1.3 CRITICALANALYSISOFTHEEFFECTIVENESSOFTRANSVERSAL INSTITUTIONALARRANGEMENTS ... 25
SECTION B – SPATIAL PLANNING AND TARGETING ... 27
2. SPATIALTARGETINGANDPLANNINGFORPRIORITYSPATIAL TARGETINGAREAS ... 27
2.1 SPATIAL DEVELOPMENT STRATEGY ... 27
2.2 SPATIAL TARGETING AND CLIMATE RISK AND RESILIENCE ... 101
2.3 INSTITUTIONAL ARRANGEMENTS FOR SPATIAL PLANNING AND TARGETING... 104
2.4 INSTITUTIONAL ARRANGEMENTS AND DISASTER RISK MANAGEMENT FOR CLIMATE RESPONSIVENESS AND RESILIENCE ... 106
SECTION C – CATALYTIC URBAN DEVELOPMENT PROGRAMME AND PREPARATION ... 110
3. CATALYTICURBANDEVELOPMENTPROGRAMME ... 110
3.1 PROGRAMMEPREPARATION ... 144
3.2 INTERGOVERNMENTALPROJECTPIPELINE ... 146
3.3 INSTITUTIONALARRANGEMENTS ... 153
3.3.1 LEADERSHIP AND GOOD GOVERNANCE ... 153
3.3.2 INTER-SECTORAL MUNICIPAL PROVINCIAL,SOC,NATIONAL CONSULTATION ... 158
3.3.3 RISK MITIGATION ... 168
ii
SECTION D – CATALYTIC URBAN DEVELOPMENT RESOURCING ... 168
4. INVESTMENTSTRATEGIES,RESOURCINGPLANAND INSTITUTIONALARRANGEMENTS ... 168
4.1 LONG-TERM FINANCIAL SUSTAINABILITY STRATEGY ... 168
4.2 RESOURCING THE PROJECT PIPELINE/SPATIAL BUDGET MIX .. 171
4.3 INVESTMENT STRATEGY ... 183
4.3.1 APPLICATION OF GRANT ALLOCATIONS... 183
4.3.2 PROPOSED URBAN SETTLEMENTS DEVELOPMENT GRANT PLAN ... 185
4.4 VALUE OF PROGRAMMES AND PROJECTS BY SECTOR ... 187
4.5 INSTITUTIONAL ARRANGEMENTS ... 188
SECTION E – CATALYTIC URBAN DEVELOPMENT PROGRAMME RESOURCING/IMPLEMENTATION ... 191
5. LANDRELEASE,PROCUREMENTANDREGULATORYREFORM .. 191
5.1 LAND ASSEMBLY AND RELEASE STRATEGY ... 191
5.2 PROCUREMENT APPROACH FOR CATALYTIC URBAN DEVELOPMENT PROGRAMMES ... 193
5.3 REGULATORY REFORM PROGRAMME ... 193
5.4 INSTITUTIONALARRANGEMENTS ... 195
5.4.1 CAPITAL PROGRAMME ... 195
5.4.2 CAPACITY SUPPORT IMPLEMENTATION PLAN (CSIP) ... 197
SECTION F – URBAN MANAGEMENT ... 201
6. URBANMANAGEMENTANDINSTITUTIONALARRANGEMENTS ... 201
6.1 URBAN MANAGEMENT INTERVENTIONS ... 201
6.2 INSTITUTIONALARRANGEMENTSANDOPERATINGBUDGET ... 210
6.3 CONSOLIDATEDOPERATINGBUDGET ... 223
SECTION G – REPORTING AND EVALUATION ... 225
7. BUILTENVIRONMENTOUTCOMEINDICATORSANDTARGETSAND THEORYOFCHANGE ... 225
7.1 BUILT ENVIRONMENT OUTCOME INDICATORS AND TARGETS .. 225
7.2 THEORY OF CHANGE ... 225
8. BIBLIOGRAPHY ... 227
iii LIST OF ANNEXURES
ANNEXURE “A” Guidance Note : Framework for the formulation of Built Environment Plans (BEPP); Supplementary Guidance Note for the Built Environment Performance Plans (BEPP) 2018/19-2020/21 (National Treasury, Cities Support Programme); Supplementary Guidance Note for the Built Environment Performance Plan (BEPP) 2019/20-2020/22:
Integrating Climate response Priorities into the BEPP;
Supplementary Guidance Note : Rationale for Transitioning out of Planning Reforms and BEPPs to Sharpen the Planning Tools.
ANNEXURE “B” Strategic Development Review, 2014
ANNEXURE “C” BEPP Situational Analysis of Nelson Mandela Bay, 2020 ANNEXURE “D” 2019/20-22/23 Multi Year Strategic Planning Time
Schedule
ANNEXURE “E” Development Areas Map
ANNEXURE “F” Informal Settlement Upgrading Project Matrix
ANNEXURE “G” Informal Settlement Upgrading and Relocation Projects Map
ANNEXURE “H” Typical example of a template for one of the Catalytic programmes
ANNEXURE “I” Catalytic Programmes Matrix
ANNEXURE “J” Inter-governmental Project Pipeline Matrix ANNEXURE “K” Spatial Budget Mix Template
ANNEXURE “L” Built Environment Outcome Indicators and Targets ANNEXURE “M” 2020/21 Urban Settlements Development Grant Plan ANNEXURE “N” Sub National Doing Business Reform Action plan ANNEXURE “O” BEPP Evaluation Framework - Self Assessment
iv LIST OF ACRONYMS
AEL Air Emissions Licence
APDP Automotive Production and Development Programme ATTP Assistance to the Poor
BEP Bucket Eradication Programme BEPP
BMSTT
Built Environment Performance Plan BEPP Multi Sectoral Task Team
BPAMS Building Plan Application Management System BRT Bus Rapid Transport
CBD Central Business District
CDC Coega Development Corporation CETT Corporate Environmental Task Team CGDS
CLDP CSEZ
CC & GEAP
City Growth and Development Strategy Catalytic Land Development Programme Coega Special Economic Zone
Climate Change and Green Economy Action Plan CITP Comprehensive Integrated Transport Plan
CoGTA Department of Cooperative Governance and Traditional Affairs
COO Chief Operating Officer
CORPGIS Corporate Geographic Information Systems CSEZ
CSIP
Coega Special Economic Zone
Capacity Support Implementation Plan CSP City Support Programme
CWWTW Coega Waste Water Treatment Works DAFF Department of Fisheries and Forestry DBSA Development Bank of Southern Africa DDM
DEDEAT
District Development Model
Department of Economic Development, Environmental Affairs and Tourism
DME Department of Minerals and Energy DORA
DPW
Division of Revenue Act Department of Public Works DTI Department of Trade and Industry DWA Department of Water Affairs
v
DWS Department of Water and Sanitation
EC Eastern Cape
ECSECC Eastern Cape Socio-economic Consultative Council EDRS Economic Development & Recreational Services EIA Environmental Impact Assessment
EMF Environmental Management Framework ETC Eastern Cape Training Centre
EPRU Eastern Province Rugby Union
FWFWWTW Fish Water Flats Waste Water Treatment Works GGP Gross Geographic Product
GHGI Greenhouse Gas Inventory GIS Geographic Information Systems
GRAP 17 Generally Recognised Accounting Practices (Property, Plant and Equipment)
GVA Gross Value Added
HAD Housing Development Agency
HDMS Housing Delivery Management System
HIV/AIDS Human Immunodeficiency Virus causing the Acquired Immunodeficiency Syndrome
HSDG Human Settlements Development Grant HURP Helenvale Urban Renewal Programme ICC International Convention Centre
ICDG Integrated City Development Grant
ICLEI International Council for Local Environmental Initiatives IDP Integrated Development Plan
SEZ Special Economic Zone
IHHSG Integrated Housing and Human Settlements Grant ILIS Integrated Land Information System
INEP IPC
Integrated National Electrification Programme Intermodal Planning Committee
IPTS Integrated Public Transport System IT Information Technology
ITP Integrated Transport Plan
LAMS Land Asset Management System LED Local Economic Development
LPMAS Land Planning Application Management System LSDF Local Spatial Development Framework
LTGDP Long Term Growth and Development Plan
vi LTFS Long Term Financial Strategy LUMS Land Use Management System MBDA Mandela Bay Development Agency MDM
MDTTT
Metro Development Model
Multi-Disciplinary Technical Task Team MIDP Motor Industry Development Programme
Multi OEM Multi Original Equipment Manufacturers Complex MOSS Metropolitan Open Space System
MPT Municipal Planning Tribunal MRF Materials Recovery Facility
MSDF Metropolitan Spatial Development Framework MSW Municipal Solid Waste
MURP Motherwell Urban Renewal Programme NDP National Development Plan
NDP Neighbourhood Development Partnership NDPG Neighbourhood Development Partnership Grant NEMA National Environmental Management Act
NFSD National Framework for Sustainable Development NLLS Nooitgedacht Low Level Scheme
NMBBC Nelson Mandela Bay Business Chamber NMBM Nelson Mandela Bay Municipality
NMBM IDP Nelson Mandela Bay Municipality’s Integrated Development Plan
NMBMM Nelson Mandela Bay Metropolitan Municipality NMMOSS Nelson Mandela Metropolitan Open Space System NMMU
NMU
Nelson Mandela Metropolitan University (pre 2017) Nelson Mandela University
NSSD National Strategy for Sustainable Development
PE Port Elizabeth
NT National Treasury
PDoHS PHDA
Provincial Department of Human Settlements Priority Housing Development Area
PICC Presidential Infrastructure Coordinating Commission PPC Pretoria Portland Cement Company
PPF Project Preparation Facility PRASA
PSDF
Public Rail Authority of South Africa
Provincial Spatial Development Framework PTIG Public Transport Infrastructure Grant
vii
PTIS Public Transport Infrastructure and Systems PTISG Public Transport Infrastructure and Systems Grant PTNO Public Transport Network Operator
PTOG Public Transport Operating Grant PTP Public Transport Plan
RDP Reconstruction and Development Programme RE Scheme Return Effluent Scheme
ROD Record of Decision
SALGA South African Local Government Association SANRAL South African National Roads Agency Limited SAPS South African Police Services
SCU Sustainable Community Unit SCUs Sustainable Community Units
SDBIP Service Delivery and Budget Implementation Plan SDC Service Delivery Cluster
SDR Strategic Development Review SEZ Special Economic Zone
SIPs Strategic Infrastructure Projects SMP Sanitation Master Plan
SOE State Owned Enterprise
SPLUMA Spatial Planning and Land Use Management Act
SPUU Safety and Peace through Urban Upgrading Programme SRA Special Rating Area
StatsSA Statistics South Africa
TNPA Transnet National Ports Authority UNS Urban Network Strategy
USDG Urban Settlements Development Grant W&S Water and Sanitation
WMP Water Master Plan
WtE Waste-to-Energy
WUL Water Use Licence
WWTW Waste Water Treatment Works
1
SECTION A – INTRODUCTION
1. INTRODUCTION
This Built Environment Performance Plan is finalised during the lockdown period of the COVID-19 Pandemic which has caused massive global, national, regional and local disruptions across every aspect of life and the entire spectrum of municipal activity.
This BEPP has been prepared in accordance with the guidelines issued by National Treasury which require, inter alia, an elaboration of processes and procedures that applied to a pre-COVID-19 world.
Inevitably, whilst South Africa and municipalities are preparing to primarily save human life and the National Government is charged with balancing health, fiscal, economic, physical and social priorities there will be changes to what is articulated in this BEPP. The transformation of processes and procedures, priorities and challenges is evolving daily.
The inability to hold Council meetings in traditional ways and the necessity to rely upon digital and technological substitutes for administrative and public procedures is just one area of adaptation that is necessary.
Priorities must involve the need for readiness and extraordinary municipal agility to respond to COVID-19 challenges. This BEPP is finalised for submission in terms of the National Treasury Guidelines and in conjunction with the COVID-19 related regulations which allow for submission by June 2020 of all major statutory documents including the BEPP.
2
It is within the above uncertain context that this document needs to be read and interpreted. Cognisance also needs to be taken of the fact that many of the statistics, social and economic data and processes expressed in this BEPP, applied to the pre-COVID-19 impact period. Changes to the information and data are occurring on a daily basis and the interpretation thereof for municipalities like Nelson Mandela Bay continues to unfold into the 2020/21 financial year period.
1.1 INTRODUCTION TO NELSON MANDELA BAY
Nelson Mandela Bay Municipality (NMBM) is the largest of two Category A Metropolitan Municipalities located on the Southern coast of the Eastern Cape Province.
Nelson Mandela Bay
3
With a population of 1 271 776, the NMBM has approximately 17% of the population of the Eastern Cape Province and is a major economic role player in the Province with two ports – the Port of Port Elizabeth and the Port of Ngqura located in the Coega Special Economic Zone (CSEZ).
The city has a growth rate of 1.36%, (lower than that of other metropolitan areas, such as Ekurhuleni (2.47%) and Tshwane (3.1%)), and is characterised by a young population, with the age group of 5 to 14 years dominating.
Nelson Mandela Bay has the lowest proportion of informal households among South African Metropolitan Municipalities, having significantly reduced the numbers since 2001 (SACN, 2016). In addition, the average number of people per household declined from 4,25 in 1996 to 3,55 in 2011.
Between 2001 and 2011, the total number of people living below the poverty line decreased from 46% to 29% (SACN, 2016). Altogether 30% of formal households in Nelson Mandela Bay are dependent on the municipal indigent subsidy.
Nelson Mandela Bay is the driver of the Eastern Cape economy, contributing 41,81% of the provincial Gross Geographic Product (GGP) (Global Insight, 2013). The unemployment rate dropped from 46,4% in 2001 to 36,6% in 2011. The Eastern Cape Province’s average unemployment rate was 37.4%
in 2011 (SACN, 2016).
The largest economic sectors in Nelson Mandela Bay Metro are manufacturing, finance, community services and transport. Community services, trade and manufacturing sectors are the sectors that create the most employment in the Metro. The city offers a wealth of tourism and recreation opportunity due to its biodiversity, beaches and open spaces.
4
In a spatial sense, the city is relatively low density with an average density of 20 residential units per hectare of developed land. The spatial pattern of the city is one of segregation with lower incomes and higher densities characterising the northern parts of the city and higher incomes and lower densities to the south and west.
1.1.1 The Regional Context
The regional context and the linkages between Nelson Mandela Bay and the hinterland are important. NMBM is the largest city in the Eastern Cape Province and thus plays a large role in the economy of the Eastern Cape.
Similarly, the surrounding towns play a role in the growth and development of
5
the city. Taking cognisance of the locational context of the city is important in considering growth and development aspects.
NMBM is at the eastern end of the well-known Garden Route with Storms River, Natures Valley, George, Knysna, Plettenberg Bay and the Tsitsikamma Forest conservation areas to the West.
Jeffreys Bay, Oyster Bay, St Francis Bay and Cape St Francis to the immediate West are part of the Kouga Municipality. Kouga is the energy hub of the region with more than 280 wind turbines on several wind farms in the area. These destinations are popular for local and international tourists.
Jeffreys Bay is internationally renowned for its surfing opportunities and regular international surfing events are hosted at its world famous beaches.
Willowmore, Steytlerville and the Baviaanskloof to the North West are popular local and international eco-tourism destinations. Patensie, the Gamtoos River valley and Hankey form part of the important agricultural hinterland. Kirkwood and the Sundays River valley to the north are important dairy, citrus and vegetable agriculture areas.
Game parks near Grahamstown as well as towns such as Graaff Reinett, Nieu Bethesda, Cradock and the Mountain Zebra National Park to the North - together with the Addo Elephant Park - attract many tourists.
Alexandra, Kenton-on-Sea and Port Alfred are along the route connecting Nelson Mandela Bay with East London to the East and form part of the popular Sunshine Coast route attractions.
Grahamstown to the North East with its Rhodes University is an academic centre of the region and focal point for tourism in the region.
The City has an airport, with international status within five minutes of the City centre. It is well serviced by rail linkages to Gauteng and is connected by good quality roads to the rest of the country.
6
The location of NMBM in its regional context presents many advantages and possibilities for NMBM to capitalise on the tourism trade. The city and its two ports further enhance its attraction for trade and industry. Agricultural produce from the hinterland is distributed from the city.
1.1.2 Strategic Development Review (SDR)
During 2014 it was acknowledged that a number of indicators show that the NMBM had entered a low growth trap which weakens long term prospects for economic growth, poverty reduction, and fiscal sustainability of the municipality. The major indicators have not changed positively from 2014 to 2020 and if anything are more negative.
Economic performance of the metro is weak with low investor confidence, joblessness and widespread economic exclusion. Although the metro has made impressive strides in expanding access to housing and basic services, this success itself threatens the fiscal viability of the metro over the long term as low payment levels and rising operating costs erode its capacity to fund the significant investments required in infrastructure extension, maintenance and replacement.
The City Support Programme enabled a Strategic Development Review (SDR) through engagement with the political and administrative leadership.
This review assessed the development challenges and opportunities facing the city and initiated a strategic planning process that involved the development of a number of possible scenarios linked to important development choices to be made.
A copy of the approved Strategic Development Review is attached as Annexure “B”.
7
It is intended to update the Strategic Development Review as part of the Capacity Support Implementation Plan with National Treasury during the 2020/21 Financial Year. A number of Metro’s are in the process of conducting Strategic Development Reviews. NMBM was the first to undertake a review in 2014.
1.1.3 Situational Analysis of the NMBM Built Environment, 2019
A Situational analysis of the NMBM Built Environment is attached as Annexure “C”. It gives a comprehensive overview of the built environment circumstances of Nelson Mandela Bay according to information available in 2020. The Situational Analysis contains important contextual information for this BEPP and has been annually updated.
Within this context, the BEPP is developed as a planning tool to align, consolidate and focus the existing strategic planning instruments into a spatially targeted investment and implementation plan. This is intended to assist the city to achieve more equitable, inclusive and sustainable growth.
This growth must happen in a spatially transformed city that overcomes imbalances of the past and accommodates growth and redevelopment.
1.1.4 Climate Change City Profile and Risks
As a city with approximately 102 km of coastline, Nelson Mandela Bay is exposed to weather and physical influences that result from exposure to ocean currents, coastal pressure systems and topographic features.
Generally, the meteorological conditions in Nelson Mandela Bay are mild but also unpredictable on a daily basis. The climatic conditions are classified as
“Oceanic” on the Köppen system.
Currently, the city remains in the grip of one of the longest drought periods it has ever experienced. This is characterised by sustained below- average
8
rainfall to catchment areas. The water restrictions in force and the implications these have on water supply will continue to influence economic activity and investment decision-making for the Metro.
The NMBM is a signatory to the Durban Adaptation Charter, signed along with other local government bodies at the 17th United Nations Climate Change Conference held in Durban in 2011. In addition, NMBM is a member of ICLEI (Local Governments for Sustainability) and participated in the Global Compact of Mayors campaign.
Much groundwork has been covered for climate risks since 2009, including the identification of opportunities and focal areas. Some successes, from multi-disciplinary teams working on a long-term project to build institutional capacity with partner city Gothenburg in Sweden; to being placed in the top three positions in successive Greenest Municipality Competitions, have shown some impact in mainstreaming climate change concerns and an understanding of the multi-layered responsibilities of the Municipality.
Conscious institutional collaborations have resulted in the linking of previously disparate municipal service departments. (Such as better linkages between Climate Change and Disaster Risk Management departments).
Another success has been the inclusion of the NMBM Climate Change and Green Economy Action Plan (CC&GEAP) into the city’s Integrated Development Plan (IDP) since 2017. As a strategic plan, the CC&GEAP (2015) is to be considered an official document that guides the strategic vision for the city. It includes the identification of climate risks, vulnerabilities of the city to these risks, and proposes interventions to build adaptive capacity to cope with these risks. Thus, the CC&GEAP intends to shape climate responsiveness and resilience (CR&R) in municipal services.
9
In a spatial sense, the city has a relatively low average density of 20 residential units per hectare of developed land. The spatial pattern of the city is one of segregation with lower incomes and higher densities characterising the northern parts of the city and higher incomes and lower densities to the south and west. This spatial disparity has made the development and operation of sustainable public transport systems ineffective. In order for the metro’s integrated public transport system (IPTS), named Libongolethu, to be efficient, higher city densities must be developed. In a 2014 greenhouse gas emissions study, the city sector found to have the highest emission of greenhouse gases was transport (NMBM GHGI 2014). The transport (mobility) sector is where the most potential for climate resilience can be realised, through the densification of development, reduction in the need for vehicle-based transport and linkages of integration zones. The infrastructure and economy of scale for renewable fuel sources and electric vehicles is still not economically viable for the present energy mix. Densification occurs in certain housing areas through the provision of different housing typologies, most notably in Social Housing developments.
In terms of the city, the ecological systems and vegetation cover provide a multitude of ecosystem services. Due to diverse and convergent biomes, the potential for the metro areas to act as natural carbon ‘sinks’ and perform optimally as water purification systems and runoff retention is great.
Open spaces are important to prevent the ‘heat island’ effect within urban areas. The active dune systems along part of the coastline provide important habitats but are also mined for sand. However, the delineation and gazetting of coastal development lines as per the NMBM’s Coastal Management Programme as well as the land use guidelines of the NMBM Bioregional Plan are tools to be used to legally manage development in ecologically valuable and sensitive areas.
10
The official climate change response document for the Nelson Mandela Bay Municipality is the Climate Change and Green Economy Action Plan (CC&GEAP). Climate projections with a 95% probability were created by the South African Weather Services (SAWS), using downscaled models for the city. These climate predictions were then subjected to a collaborative vulnerability assessment with municipal officials.
For the period 2016 to 2095, the identified climatic threats for the city include the following:
Changes in temperature patterns (higher average temperatures for hotter seasons)
Change in rainfall patterns (a decrease in average rainfall and number of rainfall events (rains), however also an increase in the intensity of rainfall)
Change in drought patterns (an increase in the frequency of droughts)
Change in flood patterns (an increase in the intensity of floods)
Change in fire patterns (more frequent fires)
Sea level rise (a 58cm – 75cm increase in sea level)
Change in storm surge patterns (higher probability of extreme storm surges)
Change in wind patterns (strengthening of easterly winds and a weakening of westerly winds).
In the BEPP, climate risks are identified within the sphere of Disaster Management (the Disaster Management Risk Assessment, 2010) and in the CC&GEAP (2015). Both contain vulnerability assessments, but the Disaster Risk Assessment ranks the highest-rated risks (across various sectors) to the Municipality’s provision of services, whilst the CC&GEAP only focuses on the risks associated with climate change for the foreseeable future.
11
However, there are commonalities in the two risk assessments, whereby synergy occurs in (some of) the most important climate change risks as follows:
TABLE 1: Risk Assessment priorities in Disaster Risk Assessment and Climate Change and Green Economy Action Plan
Disaster Risk Assessment 2010 Climate Change & Green Economy Action Plan 2015
Highest rated risk: Hydro-meteorological hazards (floods)
Change in flood patterns (an increase in the intensity of floods)
Fourth-highest rated risk: Hydro-
meteorological hazards (severe storms) Change in storm surge patterns (higher probability of extreme storm surges)
Sixth-highest rated risk: Hydro-
meteorological (drought) Change in drought patterns (an increase in the frequency of droughts)
Source: NMBM 2019
There are other commonalities in the two risk assessments, which are contained in the individual documents themselves. The Disaster Risk Sub- Directorate also developed a GIS-based layer to display flood-risk areas in the Metro. This is available to all municipal officials.
1.2 INSTITUTIONALISING THE BUILT ENVIRONMENT PERFORMANCE PLAN IN THE MUNICIPAL PLANNING SYSTEM
This Built Environment Performance Plan (BEPP) is prepared to comply with the BEPP content and format provided by National Treasury. These are provided in the following:
Guidance Note: Framework for the formulation of Built Environment Plans (BEPP);
Supplementary Guidance Note for the Built Environment Performance Plans (BEPP) 2018/19-2020/21
12
Supplementary Guidance Note for the Built Environment Performance Plan (BEPP) 2019/20-2020/22: Integrating Climate response Priorities into the BEPP.
Supplementary Guidance Note : Rationale for Transitioning out of Planning Reforms and BEPPs to Sharpen the Planning Tools - 2020.
This BEPP should be read in conjunction with the prior annual BEPP submissions for additional background information.
A copy of the Guidance Notes is attached as Annexure “A” for reference purposes.
1.2.1 Purpose of the BEPP
The BEPP is an outcomes led plan aiming to achieve a more productive, sustainable, inclusive and well governed City with a complementary urban form to reduce poverty, inequality and enhance more inclusive urban growth.
The ultimate impact of the BEPP initiatives and processes should be inclusive, sustainable economic growth and more equitable spatial pattern.
The BEPP is a requirement of the Division of Revenue Act (DoRA) in respect of the various infrastructure grants related to the built environment of metropolitan municipalities and it permits access to the following conditional grants:
Integrated City Development Grant (ICDG)
Urban Settlements Development Grant (USDG) incorporating the former Integrated National Electrification Grant (INEP)
Human Settlements Development Grant (HSDG)
Public Transport Infrastructure Grant (PTIG)
Neighbourhood Partnership Development Grant (NDPG)
13
The BEPP aims to demonstrate the use of these grants for the purpose of spatial transformation through targeting capital expenditure in areas that will maximise the positive impact on citizens, leverage private sector investment, and support growth and development towards a transformed spatial form and a more compact city.
This Built Environment Performance Plan builds on the foundation, refinement and consolidation of the prior BEPP’s.
1.2.2 Adoption of the BEPP by Council
The Draft 2020/21 BEPP was submitted to National Treasury by 31 March 2020 in compliance with DoRA. The Nelson Mandela Bay Council approved the Draft BEPP at its meeting held on Monday, 15 June 2020 and this approved BEPP is submitted to National Treasury in terms of DoRA read together with subsequent COVID-19 related regulations by 30 June 2020.
1.2.3 Planning Alignment External and Internal: SDG’S, IUDF, BEPP, IDP, SDF and Budget
The BEPP is to be read together with, and is complementary to, the Municipality’s key strategic documents, including the Long Term Growth and Development Plan, the Integrated Development Plan (IDP), the Budget, the Spatial Development Framework (SDF) and the Comprehensive Integrated Transport Plan (CITP).
The BEPP can be seen to represent the investment strategy of the Municipality in fulfilling its objectives of equitable city development, transformed spatial form and more compact city development.
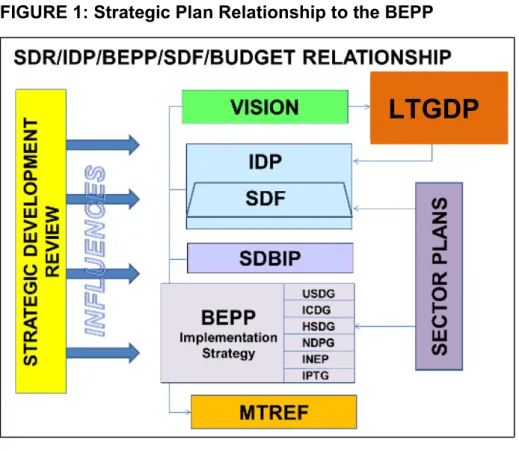
The following diagram can be seen to reflect the interrelationship between the BEPP, Spatial Development Framework and key strategic programmes/plans of the City:
14
FIGURE 1: Strategic Plan Relationship to the BEPP
Source: NMBM, 2020
Apart from internal strategic alignment, it is also important to consider external strategic alignment of plans.
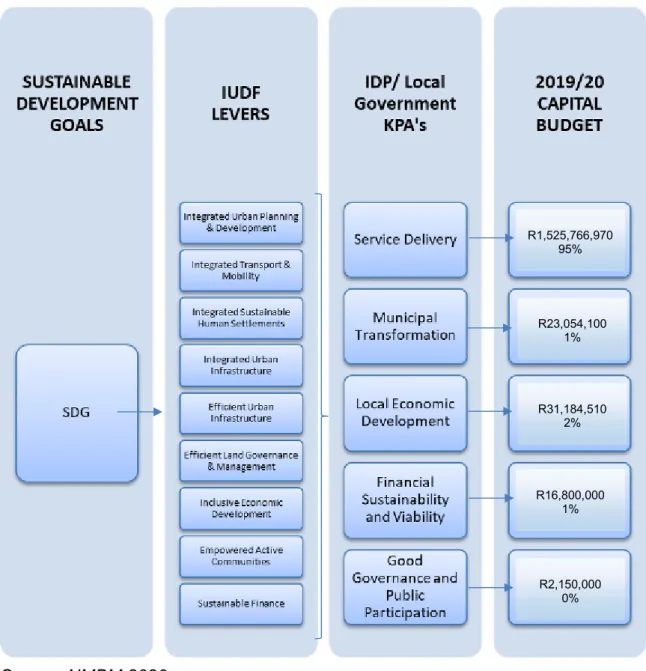
The following diagrams further indicate the relationship between the strategic plans, and the plans and Capital Budget for the NMBM.
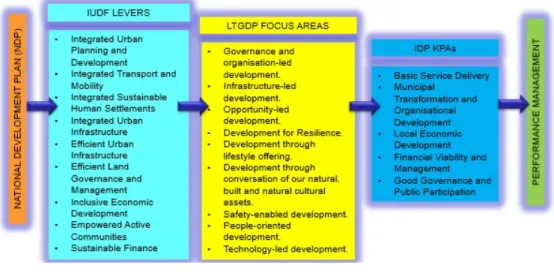
FIGURE 2: Strategic Plan Relationship – NDP, IUDF, LTGDP, IDP
LTGDP
Source: NMBM, 2019
15
FIGURE 3: Diagram Reflecting Alignment between External and Internal Strategic Plans, BEPP and Budget
Source: NMBM 2020
1.2.4 Alignment of BEPP, IDP and MSDF
The spatial strategy for transformation and integration of the City is contained in the BEPP and its Urban Network Strategy, the Spatial Development Framework and the Sustainable Community Planning Methodology. The spatial strategy is expanded upon in section 2.1.1 of this report.
R1,525,766,970 95%
R23,054,100 1%
R31,184,510 2%
R16,800,000 1%
R2,150,000 0%
16
An alignment process between the BEPP and a revised metropolitan SDF is underway to ensure consistency in terminology and detail. This precedes the drafting of a new MSDF and Bioregional Plan which is intended to be completed prior to the next IDP review period.
The IDP contains a section that deals with the spatial strategy of the NMBM.
Integral to this section is the BEPP method and results.
The following table shows the key areas of alignment between the BEPP, SDF and IDP.
TABLE 2: Key areas of alignment between BEPP, SDF and IDP
Area of Alignment BEPP SDF IDP BUDGET
BEPP method Explained Identified Covered in Spatial Strategy
N/A UNS element:
Catalytic Programmes
Identified Alignment in process
Identified Budgeted partially UNS Element
Informal Settlements upgrading
Identified Identified Identified Budgeted
UNS elements:
Integration zones, Economic Nodes, Marginalised Residential Areas and informal Settlements
Identified Identified Identified Budgeted
BEPP indicators Identified and populated
Relevant cadastral identification completed and aligned.
Performance Management system includes responsibility for relevant BEPP indicators- SDBIP and Performance Agreements.
Capital Budget areas identified and populated
Source: NMBM 2020
17
1.2.5 Fostering alignment and transversal arrangements for BEPP preparation and maintenance
A number of institutional arrangements have been put in place by the City to increase alignment and transversal arrangements for the preparation of the BEPP and BEPP processes. These include the following:
Vision/Brand Promise and the development of a Long-Term Growth and Development Plan
An exercise, assisted by the City Support Programme, was undertaken in 2017 to formulate a Long Term Growth and Development Plan (LTGDP).
A key feature of the alignment of processes has been the intensive consultation process undertaken for the preparation of the Long Term Growth and Development Plan and IDP, which impacts upon all strategic planning including the BEPP.
Focus and strategic sessions with economic actors took place after a series of questionnaires were circulated.
The consultation process ran parallel to the IDP Ward Committee meetings that are held and included questionnaires and focus group workshops.
The Strategic Planning Processes aim to deliver on the Long Term Growth and Development Plan (LTGDP) and the IDP. Both of these are extrapolated from the LTGDP. Council approved the Plan in early 2018. A process to review the LTGDP will be undertaken in time for the next five year IDP period to be passed in June 2022, covering the 2022/23 to 2026/27 financial years.
This will also be reliant on information received from the new Strategic Development Review that is to be undertaken for finalization in the 2020/21 Financial year with National Treasury City Support Programme.
18 Vision
“To be a globally competitive and preferred Metropole that works collectively with the people to improve lives, boost the economy, advocating zero corruption, and to have a transformed administration aimed at enhancing service delivery.”
Brand Promise
“Collectively we can achieve more”
Core Values
Good Governance
Integrity
Proactive
Caring
Growth Oriented
Diversity Strategic Objectives
The strategic objectives of the Municipality’s IDP are as follows:
Transform the institutional systems, processes and organisational structure to one of high performance to effectively deliver basic services
Ensure that the municipality is staffed with a motivated, committed and capable workforce.
Ensure financial prudence and transparent governance.
Grow and diversify the local economy through the attraction of new investment, skills development and facilitation of an enabling environment for small business growth and job creation.
Facilitate and promote infrastructure led growth, development and tourism.
19
Execution of existing design and implementation of new projects that competitively differentiate Nelson Mandela Bay as a destination city for business, tourism and investment – including through strategic partnerships.
Develop an effective and integrated public transport system that promotes access to opportunity through mobility.
Deliver well-resourced and capacitated Metro policing and emergency services to ensure the safety of communities and visitors.
Ensure institutional accessibility, effective communication channels for participatory and responsive governance.
Spatial and built developments that promote integrated neighbourhoods, inclusive communities and a well-connected Nelson Mandela Bay.
Deliver on transformation objectives, promote redress and foster social cohesion
Provide for the social needs of communities and empowerment of vulnerable people through provision of access to social services, social development and indigent support.
Promote the health and well-being of all communities through the spatially equitable provision of social infrastructure.
Provide effective general environmental and public health services.
Provide dignified housing, sanitation and accelerate access to improved services to indigent households in order to create safe and decent living conditions for all residents.
These Strategic Objectives support the LTGDP.
The IDP is also hinged upon the six Key Performance Areas of Local Government which are as follows:
Key Performance Areas (KPAs) Of Local Government
Basic Service Delivery and Infrastructure Development.
Local Economic Development.
Municipal Transformation and Organisational Development.
Good Governance and Public Participation.
Financial Sustainability and Viability.
20
The Metro’s political and administrative leadership, communities and economic sector groups consulted throughout the development of the Long Term Growth and Development Plan have ambitions for a bright future for Nelson Mandela Bay. It is well-established that progress cannot proceed across all fronts simultaneously and at equal pace – the essence of strategy is the optimal prioritisation and making of choices regarding which elements of an envisioned future are most practically pursued in each phase of its realisation. In this way, each set of milestones can be achieved by advancing from the solid foundation of delivery preceding it.
The plan sets out broad phasing for the implementation of strategy and adopts a fifteen-year perspective. It therefore covers the period of three Integrated Development Plans:
IDP 1, passed in June 2017, covering the 2017/18 to 2021/22 financial years;
IDP 2, to be passed in June 2022, covering the 2022/23 to 2026/27 financial years; and
IDP 3, to be passed in June 2027, covering the 2027/28 to 2031/32 financial years.
Each new IDP builds systematically on the achievements of its predecessors, through essential progress in each of the following development focus areas:
Governance and organization-led development
Infrastructure-led development
Opportunity-led development
Development for Resilience
Development through lifestyle offering
Development through conservation of our natural, built and cultural assets
Safety-enabled development
People-oriented development
Technology-led development
21
Establishment of a Strategic Planning Steering Committee
The Municipality previously had an IDP and Budget Steering Committee to manage the annual processes related to IDP and Budget preparation and adoption. In recognition of the need for greater strategic alignment and the role of the BEPP, a Strategic Planning Steering Committee was established in October 2016 to replace the former IDP and Budget Steering Committee. This Committee is politically led by the Deputy Executive Mayor and includes the Mayor’s Office, City Manager, Chief Financial Officer, Chief Operating Officer, members of the Mayoral Committee, all Executive Directors and other relevant officials responsible for the City Manager’s Office and Strategic Planning.
The Terms of Reference of this Committee include oversight over:
Development and promotion of the Municipality’s mission and vision.
Development and promotion of a Long-term Growth and Development Plan
Development and review of the five-year IDP.
Development of a medium-term budget that supports the Built Environment Performance Plan (BEPP) and IDP, is demonstrably funded, and demonstrably sustainable, as shown by the long term financial model. Furthermore, its capital projects should be supported by thorough business cases and feasibility studies.
Ensuring alignment of the Long-term Growth and Development Plan, Long-term Financial Plan, BEPP, IDP and Budget.
Ensuring stakeholder support for strategic planning processes.
The Committee is scheduled to meet monthly and meetings are preceded by a technical team meeting where aspects relevant to the preparation, and specifically, the alignment of the strategic plans and the budget are discussed.
22
Strategic Planning Time Schedule and Alignment Workshops
With the replacement of the IDP and Budget Steering Committee by the Strategic Planning Steering Committee, the former IDP and Budget time schedule of activities was replaced by a Strategic Planning Time Schedule.
This Time Schedule includes key dates in the programming and alignment of the Long Term Growth and Development Plan, BEPP, IDP and Budget and is submitted to Council structures for approval (in accordance with the legislation applicable to the IDP and Budget processes). This Time Schedule includes the dates of the Strategic Planning Steering Committee meetings and makes further provision for Strategic Planning Workshops at critical times in the annual planning and budgeting cycle where important strategic decisions are taken
From 1 July 2018, in preparation for the 2019/20- 22 MTREF, the Time Schedule was expanded upon to include a schedule of activities in relation to the strategic planning for the entire MTREF period and not just one year.
A copy of the 2019/20-22 Multi Year Strategic Planning Time Schedule is attached as Annexure “D”.
BEPP Multi-Sectoral Task Team (BMSTT) – Transversal Arrangements
The BEPP is prepared in the office of the Chief Operating Officer by the Integrated City Development Office – Strategic Planning and Coordination.
A BEPP Multi-Sectoral Task Team is chaired by the Senior Director: Strategic Planning and Coordination in the Office of the Chief Operating Officer. This Task Team has been formally established for five years and is comprised of senior members from all Directorates in the Municipality, who are designated by their Executive Directors to form part of the Team and to facilitate BEPP work, transversal implementation and the preparation of the documents.
23
The team meets monthly and more regularly should it be required. The team is comprised of representatives with the following responsibilities:
Strategic Planning
Performance Management
Monitoring and Evaluation
Corporate GIS
International and Intergovernmental Relations
Public Health including Parks, Waste Management and Environmental Management, Climate Change
Sports Recreation Arts and Culture
Safety and Security including Disaster Management
Economic Development
Budget and Treasury
Economic Development
Town Planning
Transportation
Development Support
Housing Delivery
Informal Settlements
Electricity and Energy
Infrastructure and Engineering – Roads and Storm water, Water and Sanitation
The Mandela Bay Development Agency
The BMSTT meetings focus, inter alia, on driving the suite of catalytic programmes, Integration Zone development, major municipal projects and all BEPP related matters. In particular, the transversal responsibility for the programmes and development is emphasised and meetings are deliberately constructed to foster this culture of transversal responsibility and urban management.
24
Some of the Task Team meetings are devoted to specific focus areas and sessions have been dedicated, inter alia, to the following:
IPTS – The Comprehensive Integrated Transport Plan
Public Works – planning for the rationalisation of Public Works Facilities in line with the NMBM UNS
Catalytic Programming
Housing Policy change and NUSP
Provincial Spatial Development Framework
CSP 2 introduction
CSP Economic Development Offerings
South African Cities Network and National Treasury CSP Built Environment Task Team work.
Performance Management with a BEPP focus
The catalytic programme suite and the implementation of spatial targeting through the Urban Network Strategy are included in the performance management of the city at various levels – either the IDP or the SDBIP.
All of the city transformation outcome indicators are included in the performance management system of the municipality.
Capital Prioritisation Model
The City, for the first time, developed a draft Capital Prioritisation Model in 2017/18. The model was deliberately simple and was tested in the budgeting process for the 2018/19 Financial Year to a limited extent. Some criteria, included in the model, related directly to the BEPP, Urban Network Strategy and the responsibility for catalytic programmes. These projects/programmes are intended to have a higher priority rating for funding.
25
The model was intended to be refined, developed and used more fully in the 2019/20 Budget preparation process however political changes in September 2018 and the need to start processes afresh made this not possible to achieve for the 2019/20 financial year.
The political Leadership resolved at a Strategic Planning Steering Committee workshop held in November 2019 to acquire a Capital Prioritisation Model.
This will be pursued for the next budget cycle.
More focussed Engagement with Government Departments and SOC’s regarding the Urban Network Strategy and Catalytic Programmes
Engagement with some areas of government has become more focussed around the municipalities Urban Network Strategy and Catalytic Programme.
The specific areas of focus are detailed elsewhere in this report but include Public Works Department, Human Settlements Department, PRASA, ACSA, SANRAL, Transnet, National Department of Transport, Provincial and National Treasury and Provincial CoGTA.
1.3 CRITICAL ANALYSIS OF THE EFFECTIVENESS OF TRANSVERSAL INSTITUTIONAL ARRANGEMENTS
The NMBM has made great strides in setting up deliberate institutional arrangements for managing transversal priorities. Strategic Planning coordination functions are currently performed through the Strategic Planning Steering Committee – at a political level, and by the Office of the Chief Operating Officer (Strategic Planning and Coordination) at an administrative level.
A challenge has been the absence of a formal organisational structure to support the work of the coordinating unit, which, although established, is not yet adopted on an approved organogram. This is however being addressed through the preparation for adoption of a new macro structure for the City
26
which recognises and prioritises the functions and upon adoption will allow additional staff to be appropriately deployed.
A major positive difference has been made by the better integration of performance management aspects in the strategic planning cycle. By incorporating aspects into performance management, the administration will have to take their responsibilities in this regard more seriously.
Changing the institutional thinking around transversal responsibility for development programmes is a process which is ongoing. The transversal arrangements for institutionalising the Sub National Doing Business Programme was launched in March 2020 and will demonstrate good practice in this regard. In addition, the processes and content of key meetings such as the City Budget Fora, Mid- Year Reviews and Budget and Benchmarking sessions are useful to reinforce the message.
27
SECTION B – SPATIAL PLANNING AND TARGETING
2. SPATIAL TARGETING AND PLANNING FOR PRIORITY SPATIAL TARGETING AREAS
2.1 SPATIAL DEVELOPMENT STRATEGY
The NMBM Spatial Development Strategy is articulated in a number of documents. These are identified and elaborated upon below.
2.1.1 Metropolitan Spatial Development Framework (MSDF)
To ensure sustainable growth and development in Nelson Mandela Bay, it is important that all strategic planning processes are aligned and fully integrated, so that development does not take place in an ad hoc or fragmented manner.
Key to this is the Long Term Growth and Development Plan discussed above.
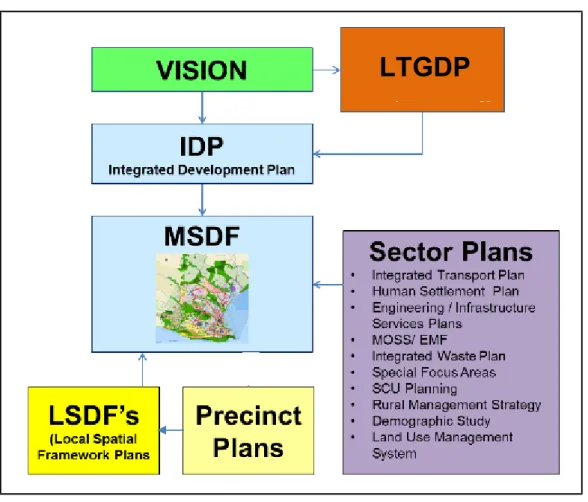
The Long Term Growth and Development Plan informs future integrated development planning, which in turn informs the Spatial Development Framework of the Municipality. The Metropolitan Spatial Development Framework (MSDF), contains a number of key sector plans that are necessary for development.
The Metropolitan Spatial Development Framework in turn informs the Local Spatial Development Frameworks (LSDFs), which are more specific and location bound. Within the Local Spatial Development Plans there are more detailed plans for specific precincts.
These frameworks are supported by an Integrated Land Use Management System (LUMS) which is currently under preparation. The diagram below reflects these linkages:
28
FIGURE 4: Relationship between Strategic Documents of the NMBM
Source: NMBM, 2018
The Metropolitan Spatial Development Framework outlines the desired spatial form of the metropolitan area. Statutorily, it is a decision making tool, however it also highlights priority investment and development areas. The MSDF is an integral component of the IDP as a spatial representation of the IDP.
LTGDP
29
FIGURE 5: Horizontal Alignment of Spatial Planning
Source: NMBM, 2015
The current MSDF is presently under review and a terms of reference has been published for the review of the MSDF along with a new Bioregional Plan.
The MSDF is to be aligned with the strategic plans of the municipality including the Long Term Growth and Development Plan and the work of the BEPP (including the Urban Network Strategy). This is particularly important as we transition out of the requirement for stand-alone BEPP documents and for the BEPP work to be integrated into, inter alia, the MSDF. In addition, the MSDF shall not conflict with other development strategies, locally, nationally, provincially and regionally.
It is intended to have the new MSDF in place at the start of the new Council term after local government elections in June 2022.
Presently, three focal points in the Metropolitan Spatial Development Framework are regarded as key in achieving restructuring, integration and sustainability.
30 These are:
The Sustainable Community Planning Methodology
Corridors and access
Economic Development and growth
The MSDF is continually being refined through on-going information gathering and studies, policy formulation and plan adjustments from time to time as well as the preparation of new and reviewed Local Spatial Development Plans and precinct plans.
Drawing from the MSDF, the BEPP identifies the Urban Network Strategy as the primary spatial targeting instrument to prioritise investment (and thereby development), in a coherent and systematic manner, incorporating all role players in areas where economic development is most needed and where inclusive growth and development can result.
MSDF sector plans
The Metropolitan Municipalities are legally required to prepare a number of sector plans. These, and others not statutorily required, in turn are incorporated into the MSDF and have major spatial implications for the MSDF.
In NMBM these are as follows:
(a) Coastal Management Plan
(b) Climate Change and Green Economy Action Plan (c) Coastal Development Line (Hazard Line) Study (d) Bioregional Plan
(e) Disaster Management Plan (f) Environmental Policy
(g) Infrastructure Development Plan
(h) Comprehensive Integrated Transport Plan
31 (i) Integrated Waste Management Plan (j) Local Economic Development Strategy (k) Metropolitan Open Space System (l) Integrated Public Transport Plan (m) Tourism Master Plan
(n) Integrated HIV and AIDS Plan (o) Water Master Plan
(p) Sewerage Master Plan
(q) Human Settlements Sector Plan
In addition, the Land Use Management System is being reviewed to ensure compatibility with SPLUMA and to enhance the development procedures and practices within NMBM. The Sub National Doing Business processes are a key consideration. Emphasis is placed upon shortening time frames and increasing the efficiency of the Land Use Control processes.
It is the intention of BEPP processes to ensure increasingly greater alignment between the sector plans and the spatially targeted areas in the Urban Network Strategy in order to achieve the same development outcomes as will be measured by the indicators discussed later in this report. These development outcomes relate to increasingly inclusive urban growth that systematically reduces inequality and poverty.
Specifically, the Comprehensive Integrated Transport Plan (CITP), Integrated Public Transport Plan (IPTP) and Human Settlements Sector Plans require greater strategic alignment. There is now a functioning Intermodal Planning Committee (IPC) that will assist in alignment.
The NMBM is presently in the midst of preparing a revised CITP, IPTP and Human Settlements Sector Plan. These will achieve further alignment. These are discussed later in this report.
The Metropolitan Spatial Development Framework of the Municipality is reflected in the plan below. The plan inter alia, shows the following aspects, which are dealt with in more detail in the Metropolitan Spatial Development Framework Report:
32
Legislative and Policy Context for Spatial Framework planning
A Spatial Development Analysis (including but not limited to Biophysical;
Socio-Economic and Built Environment Analysis)
Spatial Planning Directives (i.e. Structuring Elements; Growth Management; Densification; Sector Plans)
Spatial Proposals (including a Spatial Vision; Spatial Principles; Spatial Development Concept)
Other aspects highlighted in the MSDF include:
Urban growth areas, phased over time
Urban edge, beyond which development is limited
Major development nodes
Major transport routes, including corridors for investment and development
Environmentally protected areas
The housing programme
33 FIGURE 6: Metropolitan Spatial Development Framework, 2009
Source: NMBM, 2009
34
2.1.2 Urban Network Strategy and Prioritisation of Integration Zones
2.1.2.1 Identification of Urban Network Elements
The Urban Network Strategy (UNS) framework was approved by the Council as part of the 2018/19 BEPP submission. This framework was developed over time in conjunction with the NDP-Unit at National Treasury and in accordance with the prescribed methodology.
The Urban Network Strategy framework was endorsed at a workshop of the Strategic Planning Steering Committee comprised of the Mayoral Committee and Executive Committee. This workshop was held in November 2019.
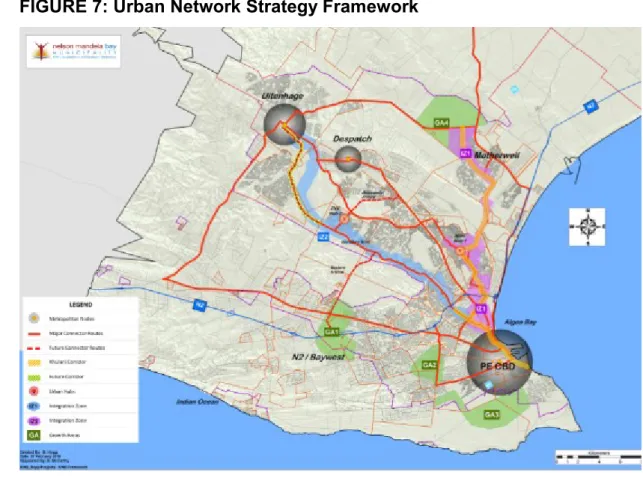
The key elements of the Urban Network Strategy are illustrated and explained in more detail below.
FIGURE 7: Urban Network Strategy Framework
Source: NMBM, 2018
35 2.1.2.1.1 Township Clusters
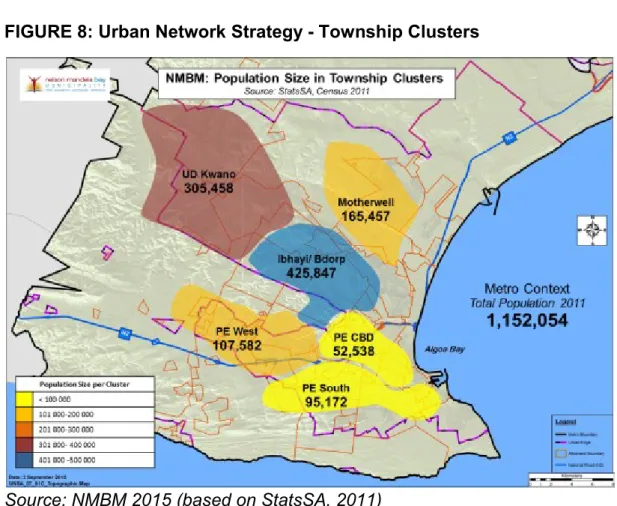
For the purposes of analysis, the townships of Nelson Mandela Bay have been clustered into six township clusters. These are as follows:
Uitenhage, Despatch, KwaNobuhle and Bloemendal Cluster:
This Cluster is comprised of wards 41; 42; 43; 44; 46; 47; 48; 49; 50; 51 and 52; as well as the two peri-urban wards, i.e.: 45 and 53. The key demographic features of the cluster are as follows:
Total population of 305 458 persons (StatsSA, 2011) representing 84 995 households;
Average population density: 34,7 persons and or 8.9 households per hectare
83,2% of households are living in formal dwellings; 10.4% (± 8839 households) in informal dwellings; and 6.4% (±5440 households) in backyard accommodation (formal and informal);
The employment rate estimated to be 31% and approximately 66% of the population earn less than R3183 per month;
Motherwell-Wells Estate Cluster:
This cluster is comprised of wards 54: 55: 57; 59; 59; 60 and ward 56 which is a peri-urban ward. It includes Motherwell, Swartkops, Amsterdamhoek and Bluewater Bay and has the following key demographic features:
Total population of 165 457 representing 46522 households (StatsSA, 2011);
Average population density: 52.89 persons and or 14.57 households per hectare;
36
Approximately 93,9% of households are living in formal dwellings; 2.9%
±1349 hh) in informal dwellings; and 3.2% (±1489 hh) in backyard accommodation (formal and informal);
The employment rate is 30% and approximately 71% of the population earn less than R3183 per month.
Ibhayi-Bethelsdorp Cluster:
The cluster is comprised of the areas of Ibhayi, KwaDwesi, KwaMagxaki, Joe Slovo, Govan Mbeki, New Brighton, Soweto-on-Sea, Veeplaas, Zwide, Helenvale and Algoa Park represented by wards: 10; 13; 14; 15; 16; 17; 18;
19; 20; 21; 22; 24; 25; 26; 27; 28; 29; 30; 31; 32; 33; 34; 35; 36; 37 and 38;
and with the following key demographic features:
Total population: 425 847 representing 107 177 households (StatsSA, 2011);
Average population density: 78.70 persons and 20.16 households per hectare;
81.9% of households are living in formal dwellings; 12.8% (±13719 hh) in informal dwellings; and 5.3% (±5680 hh) in backyard accommodation (formal and informal);
The employment rate is 30% and approximately 68% of the population earn less than R3183 per month;
CBD Cluster:
This cluster is comprised of the inner-city areas of Central, North End, Korsten, Newton Park and Mill Park represented by wards 5; 7 and 11. The key demographic features of this cluster area, are as follows:
37
Total population: 52 538 representing 16 251 households (StatsSA, 2011);
Average population density: 18.78 persons and 5.71 households per hectare;
94.7% of households are living in formal dwellings; 0.7% (±114 hh) in informal dwellings; and 4.6% (±747 hh) in backyard accommodation (formal and informal);
The employment rate is 50% and approximately 38% of the population earn less than R3183 per month.
Southern Areas Cluster:
This cluster is comprised of Summerstrand, South End, Humerail, Walmer, Fairview, Theescombe and Schoenmakerskop, including wards 1; 2; 3; 4 and 6. The key demographic features of this cluster are as follows:
Total population: 95 172 representing 33 438 households (StatsSA, 2011);
Average population density: 10.93 persons and 3.91 households per hectare;
86.2% of households live in formal dwellings; 7.9% (±2642 hh) in informal dwellings; and 5.9% (±1973 hh) in backyard accommodation (formal and informal);
The employment rate is 54% and approximately 37% of the population earn less than R3183 per month.
38 N2 – Western Areas Cluster:
This cluster is comprised of the areas of Fernglen, Sunridge, Westering, Malabar, Parsonsvlei, Kabega, Framesby and Kuyga. It includes wards 8; 9;
12; 39 and the peri-urban ward 40. The key demographic features of this cluster are as follows:
Total population: 107 582 representing 32 185 households (StatsSA, 2011);
Average population density: 11.15 persons and 2.99 households per hectare;
9.16% of households live in formal dwellings; 4.9% (±1577 hh) in informal dwellings; and 3.5% (±1126 hh) in backyard accommodation (formal and informal);
The employment rate is 61% and approximately 28% of the population earn less than R3183 per month.
The identification of the clusters assisted the analysis necessary for the development of the Urban Network Strategy. These are shown below.
39
FIGURE 8: Urban Network Strategy - Township Clusters
Source: NMBM 2015 (based on StatsSA, 2011)
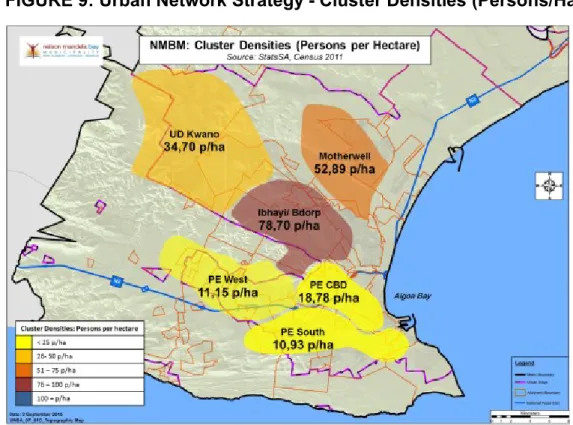
The density and income characteristics of these clusters are further illustrated in the figures below, which highlight the higher densities and lower income levels of the Northern Townships (clusters) with Ibhayi having the highest density per hectare. Motherwell has the highest percentage of the population earning less than R3 183 per month. The population numbers and densities in the Southern Clusters are noticeably smaller and lower than those of the Northern Clusters.
40
FIGURE 9: Urban Network Strategy - Cluster Densities (Persons/Ha)
Source: NMBM, 2015 (Based on StatsSA, 2011)
FIGURE 10: Urban Network Strategy - Income Levels per Cluster
Source: NMBM, 2015 (Based on StatsSA, 2011)
41
2.1.2.1.2 Central Business Districts (CBD’s)
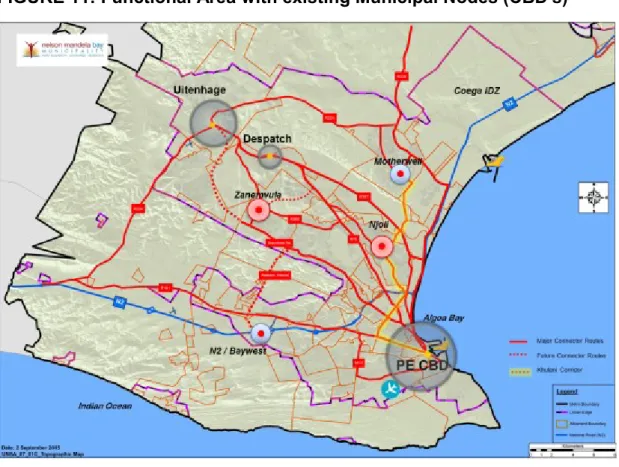
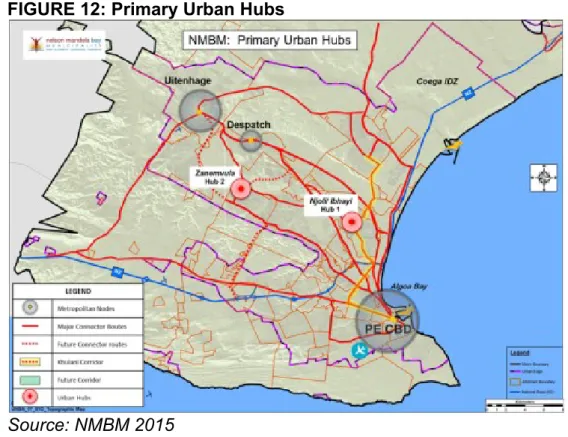
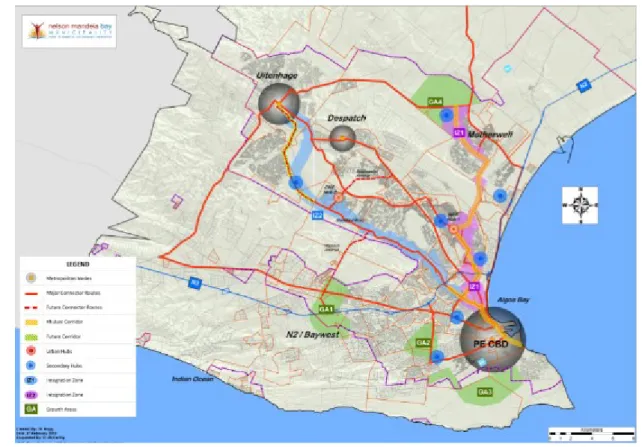
The Urban Network Framework identifies the CBD’s of Port Elizabeth, Uitenhage and Despatch as important nodes. The Port Elizabeth CBD is identified as the primary CBD for Nelson Mandela Bay Metropolitan Area.
FIGURE 11: Functional Area with existing Municipal Nodes (CBD's)
Source: NMBM, 2015
2.1.2.1.3 Primary Network/Transport Links
MAJOR ARTERIES
The primary transport network includes three of the five major transport arteries, being:
42 Harrower/Stanford Road
This road runs in a north-westerly direction, linking the PE CBD with Gelvandale, Helenvale, Bethelsdorp and Bloemendal (Chatty). The long-term integrated road network planning provides for the extension of Standford Road from its current point of termination in the Chatty/ Zanemvula development area, to the Uitenhage CBD area. This extension is reflected in the current planning of the Jachtvlakte / Kwanobuhle Estate residential developments.
Provincial Route R75
The R75 runs in a north-westerly direction and links Port Elizabeth, Despatch and Uitenhage, as well as the townships of Ibhayi, Algoa Park, Missionvale, Govan Mbeki, KwaDwesi and KwaMagxaki.
Khulani Corridor
The Khulani Corridor refers to the north-south linkage between PE CBD, Ibhayi, Njoli and Motherwell along SheyaKulati, Daku and Dibanisa Roads.
Other primary arteries are:
Old Cape Road (R101)
Provincial Route R101, Old Cape road is a westerly linkage between the PE CBD and the Western Townships of Westering, Kabega, Rowallan Park and Bridgemeade.
Heugh/Buffelsfontein Road
This southern route links the PE CBD to the Western Coastal area of Seaview.
William Moffet Expressway
This road is a north-south linkage between Heugh Road / Buffelsfontein Road and Old Cape Road.
43 The N2
The N2 runs from West to North through the urban area, serving as a further primary linkage between the urban areas of Nelson Mandela Bay.
These arteries/transport links form the structure of the Integrated Public Transport System in Nelson Mandela Bay which is comprised of road and rail network links.
ROAD NETWORK
Public transport serves the metropolitan area along the following existing and planned routes:
North-South linkage between the PE CBD and Motherwell via Ibhayi along the Khulani Corridor (Sheya Khulati, Njoli, Daku and Dibanisa Roads).
North-West linkage between the PE CBD and Bloemendal/Bethelsdorp along Stanford Road, currently terminating near the Cleary Park Shopping Centre, but with planned future extension to Uitenhage via the Chatty, Jachtvlakte and KwaNobuhle Estate areas.
South-West linkage between the PE CBD and the Western Suburbs via Old Cape Road, currently terminating in the vicinity of Rowallan Park, but with a planned future extension towards the Redhouse Chelsea intersection, with a possible linkage to the Bay West Mall development.
RAIL NETWORK
There is an existing passenger rail link between the PE CBD and Uitenhage via New Brighton, Sydenham, Swartkops, Redhouse and Despatch. This is part of the Port Elizabeth – Graaff-Reinet Line.
There is an existing passenger rail link between PE CBD and Motherwell/Markman. This is part of the Port Elizabeth – Johannesburg Line.