Service Quality, Student Satisfaction and Brand Equity: A Case Study of Select South African Universities
by
Sanjay Shantilal Soni Student Number: 842847277
A thesis submitted in partial fulfilment of the requirements for the degree of Doctor of Philosophy (Marketing)
School of Management, IT and Governance College of Law and Management Studies
Supervisor: Professor Krishna Govender
2015
i Declaration
I, Sanjay Shantilal Soni declare that:
i. The research reported in this dissertation/thesis, except where otherwise indicated is my original research
ii. This thesis has not been submitted for any degree or examination at any other university.
iii. This thesis does not contain other persons‟ data, pictures, graphs or other information, unless specifically acknowledged as being sourced from other persons.
iv. This thesis does not contain other persons‟ writing, unless specifically acknowledged as being sources from other researchers. Where other written sources have been quoted, then;
a. Their words have been re-written but the general information attributed to them has been referenced;
b. Where their exact words have been used, their writing has been placed inside quotation marks, and referenced.
v. This thesis does not contain text, graphics or tables copied and pasted from the Internet unless specifically acknowledged, and the source being detailed in the dissertation/thesis and in the References sections.
Signed: _________________
Sanjay Shantilal Soni
Student Number: 842847277 Date: 3 November 2015
ii Acknowledgements
I would like to express my sincere gratitude to all those people who have supported me on this long journey towards completing this thesis.
I am thankful for having an understanding and supporting family who encouraged me to complete this work. My wife Pravina who has been a pillar of strength and encouragement to me over the 23 years. My sons, Vishay and Vimal for their encouragement and understanding that I was not able to give them as much of my time during the completion of this thesis. I am sure, in the future;
I will be able make up this lost time to you.
To my parents, Shantilal and Parvathie Soni, I am honoured and blessed to have you still in my life and living side-by-side with me gives me encouragement and confidence.
To my supervisor, Professor Krishna Govender, to whom I shall forever be thankful for all the positive pressure, advice, support, and encouragement that he has provided to me.
I thank Gill Hendry for the statistical support and advice provided, Carol Ahern for being extremely helpful with typesetting and formatting support, and Professor Micheline Naude for her encouragement and support.
To all those students that participated in this study, I really appreciate your input, without which this thesis would not have been possible.
To those lecturers who allowed me to use their class time to conduct the study, I thank you very much for your hospitality and support.
iii Abstract
Service quality, student satisfaction, and brand equity are key principles in marketing that are known to play an important role in marketing success. Changes to the South African higher education landscape and the subsequent challenges accompanying these changes such as, inter alia, greater competition, declining government subsidies, and more discerning students, has necessitated managing higher education institutions like businesses, and the application of business and marketing principles to attain success has become imperative.
Whilst the areas of Service Quality, Student Satisfaction and Brand Equity within a higher education context have been studied over time, there remains a dearth of literature in a South African higher education context. In fact, the association between service quality and brand equity, including their sub-categories, in a higher education context, is not only an under-researched area in South African higher education, but also in higher education internationally. Hence, the study’s contribution can be considered unique particularly in this context.
The main problem that the study tries to seek answers to is what is the perception amongst students of Service Quality, Student Satisfaction, and Brand Equity, and the associations between these constructs for the selected sample of higher education students in South Africa?
A purposive judgmental sample of 400 students from two select higher educational institution campuses were selected in equal proportions (i.e. 200 students from each institution). The data was collected using a semi-structured questionnaire and subjected to different kinds of statistical analyses. Descriptive tests for each construct were conducted based on frequency tables and graphs (including cross-tabulations with select demographic variables e.g. gender), cluster analyses, and factor and Confirmatory Factor Analyses. Inferential statistical analyses, to show the associations and predictive abilities of the independent variables within each construct was conducted using correlations, multiple linear regression analyses AND Structural Equation Modelling. A conceptual model was tested based on the aforementioned analyses. The study’s findings are:
The key service quality factors rated from highest to lowest were Responsiveness, Assurance, Reliability, Tangibles, and Empathy.
iv
OVERALL SERVICE QUALITY (OSQ), OVERALL STUDENT SATISFACTION (OSS) and OVERALL BRAND EQUITY (OBE) were rated as above average.
No differences were found in OVERALL SERVICE QUALITY (OSQ), OVERALL STUDENT SATISFACTION (OSS) and OVERALL BRAND EQUITY (OBE) across demographic categories, except for race.
The key service quality dimensions based on its importance to the student, in descending order were Responsiveness, Reliability, Assurance, Empathy and Tangibles.
Statistically significant negative gaps were found for all the service quality dimensions, suggesting improvements are needed in all areas in order to close the gaps. The largest negative gaps were found for Reliability and Empathy.
Important service quality explanatory factors were Empathy, Tangibles. Reliability, Responsiveness and Helpfulness.
Important brand equity explanatory factors were Key Associations and Differentiation, Loyalty and Awareness.
Empathy, Responsiveness, Reliability and Assurance were significant and positive predictors of OVERALL SERVICE QUALITY (OSQ).
Empathy, Responsiveness, and Tangibles were positive and significant predictors of OVERALL STUDENT SATISFACTION (OSS).
Significant and positive relationships were found to exist between Empathy and Tangibles with OVERALL BRAND EQUITY (OBE).
Significant and positive relationships were also found to exist between Key Associations and Differentiation and Loyalty with OVERALL BRAND EQUITY (OBE).
The relationship between the dimensions of brand equity and OVERALL BRAND EQUITY (OBE) differ for male and female students.
Empathy and Tangibles significantly predict Loyalty.
Empathy, Assurance, Reliability and Tangibles significantly predict Key Associations and Differentiation.
OVERALL STUDENT SATISFACTION (OSS) and OVERALL SERVICE QUALITY (OSQ) are significant predictors of OVERALL BRAND EQUITY (OBE).
v
Service Quality (SQ), Brand Equity (BE) and OVERALL STUDENT SATISFACTION (OSS) are significantly and positively associated.
In the light of the various findings, it is recommended that greater emphasis be placed by higher educational institutions on measuring and managing Service Quality, Student Satisfaction, and Brand Equity. Furthermore, the associations between the aforementioned constructs, and their measurement dimensions which emerged as being significant also needs to be carefully considered if Higher Education leaders are to attract and retain students in the highly competitive environment.
vi Table of Contents
Declaration ... i
Acknowledgements ... ii
Abstract ... iii
Table of Figures ... xiii
List of Tables ... xiv
CHAPTER ONE ... 1
INTRODUCTION, BACKGROUND AND SCOPE OF STUDY... 1
1.1. Introduction and Background ... 1
1.2. Statement of the Problem ... 5
1.3. Research Objectives ... 6
1.4. Significance of the Study ... 6
1.5. Research Methodology ... 7
1.6. Delimitations of the Study ... 9
1.6.1. The Research Problem, Questions and Objectives ... 9
1.6.2. The Constructs under Study ... 9
1.6.3. The Population ... 10
1.6.4. Research Philosophy, Approach and Strategy ... 10
1.7. Outline of the Study ... 11
1.8. Conclusion ... 12
CHAPTER TWO ... 13
SERVICES, SERVICE QUALITY, CUSTOMER SATISFACTION AND BRAND EQUITY 13 2. 1. Introduction... 13
2.2. Characteristics of Services ... 13
2.1.1. Intangibility ... 14
2.1.2. Heterogeneity ... 14
2.1.3. Simultaneous Creation and Consumption ... 14
2.1.4. Perishability ... 14
2.3. Service Quality and Service Quality Models ... 15
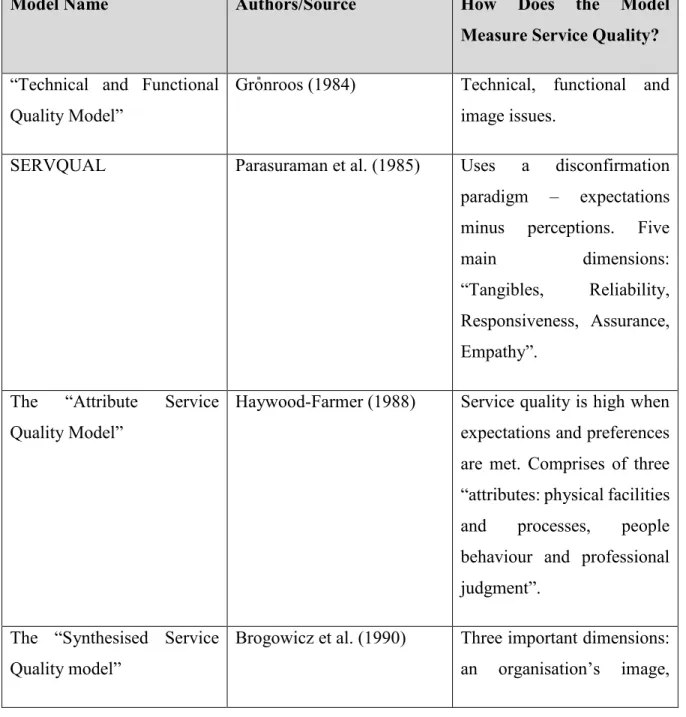
2.3.1. “Technical and Functional Quality Model” of Gro̎nroos... 16
vii
2.3.2. The “Gaps Model” (SERVQUAL) of Parasuraman, Zeithaml and Berry ... 16
2.3.3. The “Attribute Service Quality Model” Of Haywood-Farmer ... 22
2.3.4. The “Synthesised Service Quality Model” of Brogowicz, Delene and Lyth ... 22
2.3.5. The Performance Only Model of Service Quality of Cronin and Taylor ... 23
2.3.6. The “Ideal Value Model of Service Quality” of Mattsson ... 23
2.3.7. The “Evaluated Performance and Normed-Quality Model” of Service Quality of Teas ... 23
2.3.8. The “IT Alignment Model” of Berkley and Gupta ... 23
2.3.9. The “Attribute and Overall Affect Model” of Service Quality of Dabholkar ... 24
2.3.10. “Perceived Service Quality and Satisfaction” Model of Spreng and Mackoy ... 24
2.3.11. The “PCP Attribute Model” of Philip and Hazlett ... 24
2.3.12. The “Retail Service Quality and Perceived Value Model” of Sweeney, Soutar and Johnson ... 25
2.2.13. The “Service Quality, Customer Value and Customer Satisfaction Model” of Oh ... 25
2.2.14. The “Antecedents and Mediator Model” of Service Quality of Dabholkar, Shepherd and Thorpe” ... 26
2.2.15. The “Internal Service Quality Model” of Frost and Kumar ... 26
2.2.16. The “Internal Service Quality DEA Model”of Soteriou and Stavrinides ... 26
2.2.17. The “Internet Banking Model” of Broderick and Vachirapornpuk ... 27
2.2.18. The “IT-based Model” of Zhu, Wymer and Chen ... 27
2.3.19. The “E-service Quality Model” of Santos ... 27
2.4. Customer Satisfaction ... 33
2.5. Branding and Brand Equity ... 37
2.5.1. Branding ... 37
2.5.2. Brand Equity ... 38
2.5.3. Different Perspectives of Brand Equity ... 40
2.5.4. Measuring “Customer-Based Brand Equity” ... 41
2.6. Conclusion ... 52
CHAPTER THREE ... 53
SERVICE QUALITY IN HIGHER EDUCATION ... 53
3.1. Introduction... 53
viii
3.2. Service Quality and its Importance in Higher Education ... 54
3.3. Conceptualising Higher Education Service Quality ... 57
3.4. Measuring Service Quality in Higher Education ... 59
3.4.1. The SERVQUAL Model ... 59
3.4.2. The SERVPERF Model ... 60
3.4.3. The HEdPERF Model ... 65
3.4.4. OVERALL SERVICE QUALITY (OSQ) ... 67
3.5. Empirical Studies involving Service Quality in Higher Education ... 68
3.6. The Importance of Student Satisfaction ... 74
3.7. Meaning of Student Satisfaction ... 76
3.8. Measuring Student Satisfaction ... 77
3.9. OVERALL STUDENT SATISFACTION (OSS) ... 80
3.10. The Relationship between Service Quality and Customer/Student Satisfaction ... 81
3.11. Branding and Brand Equity in Higher Education ... 89
3.12. Measuring Brand Equity in Higher Education ... 92
3.12.1. Brand Loyalty ... 92
3.12.2. Key Associations and Differentiation ... 93
3.12.3. Brand Awareness ... 93
3.12.4. Perceived Quality ... 94
3.12.5. OVERALL BRAND EQUITY (OBE) ... 94
3.13. Empirical Studies on Brand Equity in Higher Education ... 94
3.14. Relationship between Student Satisfaction and Brand Equity ... 96
3.15. Relationship between Service Quality and Brand Equity in a Higher Education Context . 97 3.16. Conclusion ... 102
CHAPTER FOUR ... 104
RESEARCH METHODOLOGY... 104
4.1. Introduction... 104
4.2. Research Design ... 104
4.3. Data Collection ... 105
4.4. Research Population and Sampling Frame ... 106
4.5. Sampling ... 107
4.5.1. Sample Size ... 107
ix
4.5.2. Sampling Method ... 107
4.6. Data Collection Instrument ... 109
4.7. Section A -Service Quality Rating ... 111
4.8. Section B -Service Quality Importance ... 112
4.9. Section C-Brand Equity ... 112
4.10. Section D -Overall Measures ... 112
4.11. Section E- Demographic Information ... 113
4.12. Operationalising of the Research Constructs ... 113
4.13. Pre-Testing and Pilot Testing of the Questionnaire ... 116
4.14. Validity ... 116
4.14.1. Face Validity ... 117
4.14.2. Content Validity ... 117
4.14.3. Construct Validity ... 118
4.15. Reliability ... 118
4.16. Data Analysis ... 119
4.16.1. Frequency Distribitions ... 119
4.16.2. Cluster Analysis ... 119
4.16.3. Correlational Analysis ... 120
4.16.4. Factor Analysis ... 120
4.16.5. Confirmatory Factor Analysis (CFA) ... 121
4.16.6. Structural Equation Modelling (SEM) ... 124
4.16.7. The Mann-Whitney U Test ... 124
4.16.8. The Kruskal Wallis Test ... 124
4.16.9. Paired Sample T-Test ... 124
4.16.10. Multiple Regression Analysis ... 125
4.17. Analysis of Each Research Objective ... 126
4.18. The Hypothesis Testing Process ... 129
4.18.1. Techniques used to test the Hypotheses ... 131
4.19. Conclusion ... 133
CHAPTER FIVE ... 135
RESEARCH FINDINGS ... 135
x
5.1. Introduction... 135
5.2. Demographic Profile of Respondents ... 135
5.3. Descriptive Analysis ... 138
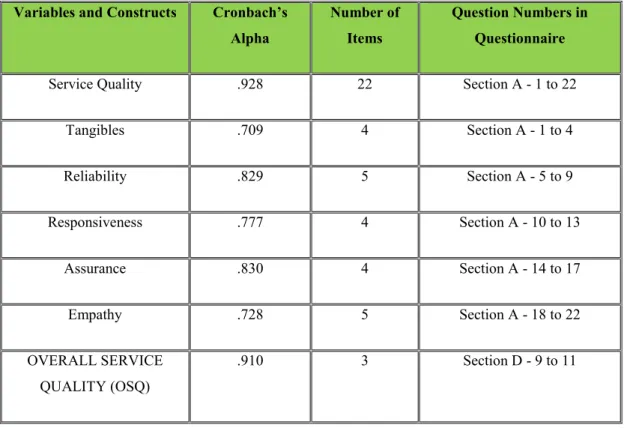
5.4. Reliability ... 138
5.5. Descriptive Statistics for Service Quality ... 140
5.6. Descriptive Statistics for Importance of Service Quality Dimensions ... 143
5.7. Descriptive Statistics for OVERALL SERVICE QUALITY (OSQ) ... 156
5.8. Descriptive Statistics for OVERALL STUDENT SATISFACTION (OSS) ... 158
5.9. Descriptive Statistics for OVERALL BRAND EQUITY (OBE) ... 160
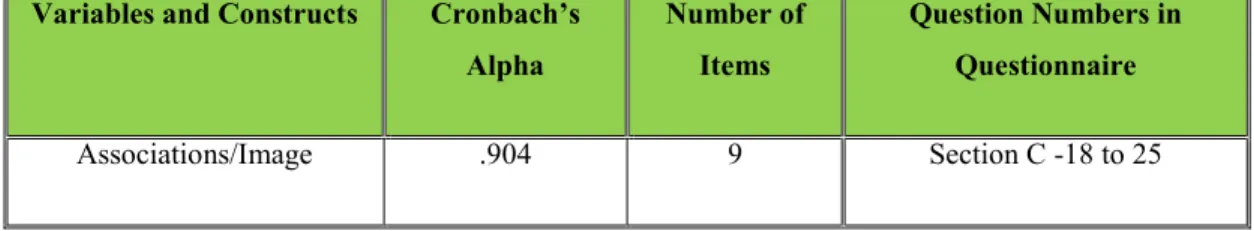
5.10. Descriptive Statistics for Brand Equity Dimensions ... 162
5.11. Factor Analysis and Confirmatory Factor Analysis for Service Quality ... 163
5.12. Factor Analysis and Confirmatory Factor Analysis for Brand Equity ... 172
5.13. SERVPERF Predictors of OVERALL SERVICE QUALITY (OSQ) ... 180
5.14. Service Quality Predictors of OVERALL STUDENT SATISFACTION (OSS) ... 183
5.15. Dimensions of Service Quality as Predictors of the One Overall Measure of OVERALL STUDENT SATISFACTION (OSS) ... 187
5.16. Service Quality Dimensions as Predictors of OVERALL BRAND EQUITY (OBE) ... 189
5.17. Brand Equity Dimensions as Predictors of OVERALL BRAND EQUITY (OBE) ... 193
5.18. Service Quality Dimensions as Predictors of Loyalty ... 196
5.19. Service Quality Dimensions as Predictors of Key Associations and Differentiation ... 199
5.20. Relationship between Overall Satisfaction and OVERALL BRAND EQUITY (OBE) ... 202
5.21. Relationship between OVERALL SERVICE QUALITY (OSQ) and OVERALL BRAND EQUITY (OBE) ... 204
5.22. Relationship between Overall Satisfaction and OVERALL SERVICE QUALITY (OSQ) with OVERALL BRAND EQUITY (OBE) ... 206
5.23. Relationship between Overall Satisfaction and OVERALL SERVICE QUALITY (OSQ) (One Overall Measure) with OVERALL BRAND EQUITY (OBE) ... 208
5.24. The Relationships between Service Quality (SERVPERF), OVERALL STUDENT SATISFACTION (OSS) and BRAND EQUITY Aaker’s (1996) Model Depicted by a Structural Model. ... 211
5.25. Summary ... 219
CHAPTER SIX ... 221
DISCUSSION OF FINDINGS ... 221
xi
6.1. Introduction... 221
6.2. Service Quality, Student Satisfaction and Brand Equity Ratings ... 221
6.2.1. Service Quality Dimension Ratings ... 221
6.2.2. OVERALL SERVICE QUALITY (OSQ) Rating ... 223
6.2.3. OVERALL STUDENT SATISFACTION (OSS) Ratings ... 224
6.2.4. Brand Equity Ratings ... 224
6.3. Importance of Service Quality Factors ... 225
6.4. Underlying Factors Relating to Service Quality and Brand Equity ... 228
6.4.1. Underlying Factors/Dimensions for Service Quality ... 229
6.4.2. Underlying Factors/Dimensions for Brand Equity ... 230
6.5. Relationships between the Constructs and their Dimensions ... 231
6.5.1. Service Quality Dimensions as Predictors of OVERALL SERVICE QUALITY (OSQ) ... 231
6.5.2. Service Quality Dimension Influence on OVERALL STUDENT SATISFACTION (OSS) ... 233
6.5.3. Predictors of OVERALL BRAND EQUITY (OBE) Based On Brand Equity Dimensions ... 235
6.5.4. Service Quality Dimensions as Predictors of OVERALL BRAND EQUITY (OBE) ... 236
6.5.5. Service Quality Dimensions as Predictors of the Predictors of OVERALL BRAND EQUITY (OBE) ... 237
6.5.6. RELATIONSHIP BETWEEN OVERALL SERVICE QUALITY (OSQ), OVERALL STUDENT SATISFACTION (OSS) AND OVERALL BRAND EQUITY (OBE) ... 238
6.6. Decision on the Research Hypotheses ... 242
6.7. Summary ... 250
CHAPTER SEVEN ... 253
CONCLUSIONS AND RECOMMENDATIONS ... 253
7.1. Introduction... 253
7.2. Key Findings ... 253
7.3. Recommendations ... 256
7.3.1. Closing the Service Quality Gaps ... 256
7.3.2. Recommendations for Importance Ratings of Service Quality Dimensions ... 259
xii 7.3.3. Recommendations Regarding the Explanatory Factors of Service Quality and
Brand Equity ... 260
7.3.4. Recommendations for the Predictive Relationship between the Service Quality Dimensions and OVERALL SERVICE QUALITY (OSQ)... 261
7.3.5 Recommendations for Predictive Relationship between Service Quality Dimensions and OVERALL STUDENT SATISFACTION (OSS) ... 261
7.3.6. Recommendations on Key Associations and Differentiation ... 262
7.3.7. Recommendations on Loyalty ... 263
7.3.8. Recommendations Regarding the OVERALL SERVICE QUALITY (OSQ), OVERALL STUDENT SATISFACTION (OSS) and OVERALL BRAND EQUITY (OBE) ... 263
7.3.9. Recommendations for Service Quality (revised SERVPERF model), OVERALL STUDENT SATISFACTION (OSS) and Brand Equity (revised Aaker, 1996 model) ... 264
7.4. Limitations of the Study ... 264
7.4.1. Sample ... 264
7.4.2. Construct Measurements ... 264
7.4.3. Time and Cost Constraints ... 265
7.5. Directions for Future Research ... 265
References ... 266
APPENDIX A: QUESTIONNAIRE... 307
APPENDIX B: ETHICAL CLEARANCE APPROVAL ... 314
xiii Table of Figures
Figure 2.1: The “Gaps Model” of Service Quality ... 17
Figure 2.2: Factors Comprising Brand Knowledge ... 49
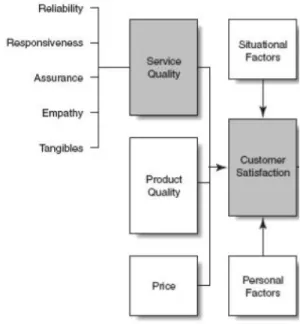
Figure 3.1: Service Quality and Customer Satisfaction ... 82
Figure 3.2: Conceptual Model ... 102
Figure 5.1: Means for Each Service Quality Dimension Rating ... 140
Figure 5.2: Importance Placed on Service Quality Dimensions ... 144
Figure 5.3: Mean Importance Ratings for Each Service Quality Variable ... 145
Figure 5.4: Comparing Service Quality Importance Ratings with Actual Ratings for Each Service Quality Dimension ... 147
Figure 5.5: Cluster Analysis of Dimensions of Service Quality Importance Ratings ... 154
Figure 5.6: Cluster Analysis for Overall Satisfaction based on Student Demography ... 159
Figure 5.7: Measurement Model for Service Quality ... 167
Figure 5.8: Measurement Model for Brand Equity ... 176
Figure 5.9: Structural Model Depicting the Relationships between Service Quality (SQ) OVERALL STUDENT SATISFACTION (OSS) and Brand Equity (BE) ... 212
Figure 5.10: Structural Model Depicting the Relationships between Service Quality (SQ), (OSS) and Brand Equity (BE) ... 216
Figure 6.1: Revised Model of the Relationship between Service Quality Dimensions, OVERALL STUDENT SATISFACTION (OSS), Brand Equity Dimensions and OVERALL BRAND EQUITY (OBE). ... 249
Figure 6.2: Revised Model on the Relationship between Service Quality, OVERALL STUDENT SATISFACTION and Brand Equity ... 250
xiv List of Tables
Table 2.1: Summary of Service Quality Models ... 28
Table 2.2: Popular and Widely used Models of Service Quality ... 33
Table 2.3: Different Perspectives into Customer Satisfaction ... 35
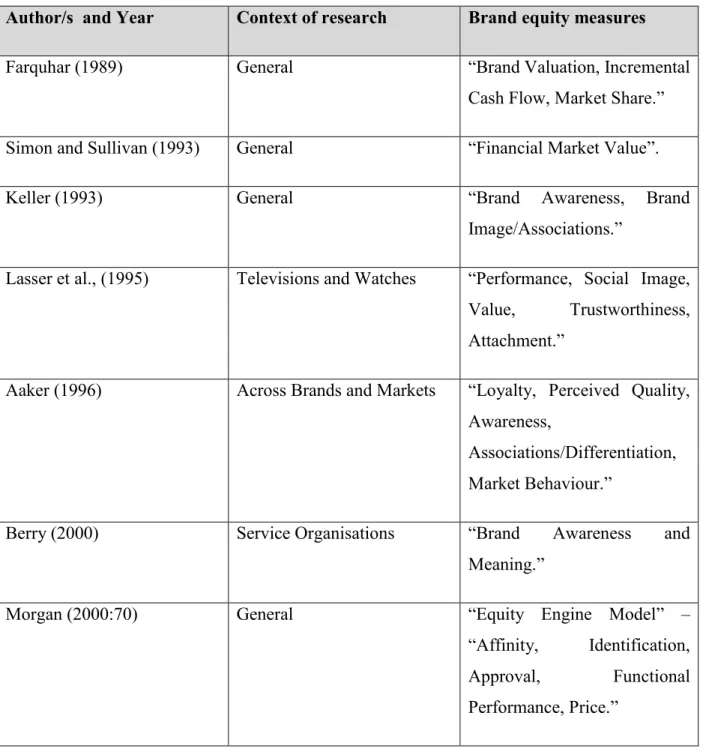
Table 2.4: Studies on Brand Equity Measures ... 42
Table 3.1: Select International Studies Specific to Higher Education Service Quality ... 70
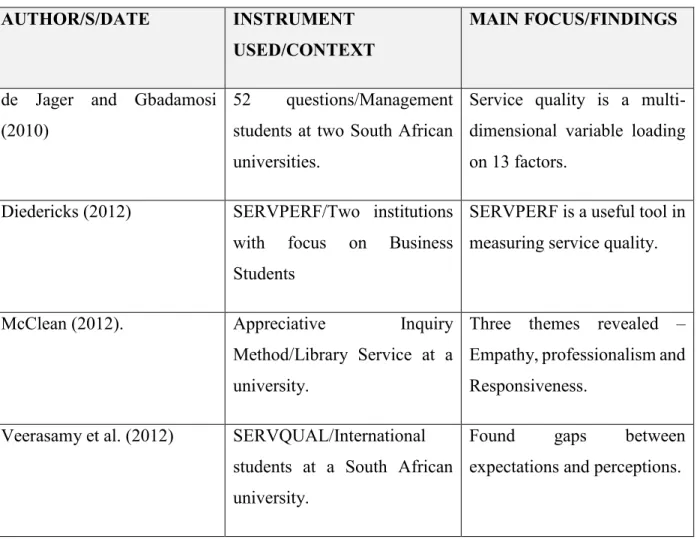
Table 3.2: South African Studies Specifically Pertaining to Higher Education Service Quality ... 72
Table 3.3: Differences between Service Quality and Customer Satisfaction ... 83
Table 3.4: South African Studies on Service Quality and Student Satisfaction ... 84
Table 3.5: International Studies on Service Quality and Student Satisfaction ... 86
Table 3.6: Relationship between Service Quality and Brand Equity in Higher Education ... 98
Table 4.1: Operationalising the Research Constructs ... 113
Table 4.2: Model Fit Index Thresholds ... 123
Table 4.3: Data Analysis Pertaining to Each Hypothesis ... 132
Table 5.1: Age of Respondents ... 135
Table 5.2: Gender Distribution of Respondents ... 136
Table 5.3: Academic Fields of Study ... 137
Table 5.4: Racial Profile ... 137
Table 5.5 Reliability Scores of the Constructs ... 138
Table 5.6: Correlation between the Rating of Service Quality Dimensions and their Related Variables ... 141
Table 5.7: Cluster Analysis Based on Service Quality Dimensions and Demographic Factors ... 142
Table 5.8: Positive Correlations between the Importance Rating of Service Quality Dimensions and their Related Variables ... 146
Table 5.9: Paired Samples T-Test between Actual Rating and Importance Rating for Each Service Quality Dimension ... 148
Table 5.10: Paired Samples T-Test for Variables within the Tangible’s Dimension ... 149
Table 5.11: Paired Samples T-Test for Variables within the Reliability Dimension ... 150
Table 5.12: Paired Samples T-Test for Variables within the Responsiveness Dimension ... 151
Table 5.13: Paired Samples T-Test for Variables within the Assurance Dimension ... 152
Table 5.14: Paired Samples T-Test for Variables within the Empathy Dimension ... 153
Table 5.15: Mean Rating of OVERALL SERVICE QUALITY (OSQ) ... 156
Table 5.16: Mean Ratings of OVERALL SERVICE QUALITY (OSQ) based on Select Demographic Factors ... 157
Table 5.17: Mean Rating of OVERALL STUDENT SATISFACTION (OSS) ... 158
Table 5.18: Mean Rating of OVERALL BRAND EQUITY (OBE) ... 160
Table 5.19: OVERALL BRAND EQUITY (OBE) Based on Demographic Factors ... 161
Table 5.20: Brand Equity Dimensions ... 162
Table 5.21: KMO and Bartlett’s Test for Service Quality Factors ... 163
xv
Table 5.22: Total Variance Explained for Service Quality ... 165
Table 5.23: Rotated Factor Matrix Service Quality ... 165
Table 5.24: Reliability Scores for SERVPERF Construct Dimensions Confirmed by CFA .. 168
Table 5.25: Model Fit Indices for SERVPERF Dimensions (Service Quality Construct) ... 168
Table 5.26: Convergent and Discriminant Validity Indices ... 170
Table 5.27: Assessment of Normality ... 170
Table 5.28: KMO Bartlett’s Test for Brand Equity ... 172
Table 5.29: Total Variance Explained for Brand Equity ... 173
Table 5.30: Rotated Factor Matrix Service Quality ... 174
Table 5.31: Reliability Scores for Brand Equity Construct Dimensions Confirmed by CFA . 177 Table 5.32: Model Fit Indices for Aaker’s (1996) Brand Equity Model (Brand Equity Construct) ... 177
Table 5.33: Convergent and Discriminant Validity Indices ... 178
Table 5.34: Assessment of Normality ... 179
Table 5.35: Model Summary for SERVPERF Predictors of OVERALL SERVICE QUALITY (OSQ) ... 180
Table 5.36: Anova for SERVPERF Predictors of OVERALL SERVICE QUALITY (OSQ) ... 181
Table 5.37: Coefficients for SERVPERF Predictors of OVERALL SERVICE QUALITY (OSQ) ... 182
Table 5.38: Model Summary for Service Quality Predictors of OVERALL STUDENT SATISFACTION (OSS) ... 184
Table 5.39: Anova Results for Service Quality Predictors of OVERALL STUDENT SATISFACTION (OSS) ... 185
Table 5.40: Coefficients Table for Service Quality Predictors of OVERALL STUDENT SATISFACTION (OSS) ... 186
Table 5.41: Model Summary for Service Quality Predictors of Overall Student Satisfaction 187 Table 5.42: Anova results for the Service Quality Predictors of Overall Student Satisfaction188 Table 5.43: Model Summary for Service Quality Predictors of Overall Student Satisfaction 188 Table 5.44: Model Summary for Service Quality Predictors of Overall Brand Equity ... 190
Table 5.45: Anova Results for Service Quality Predictors of Overall Brand Equity ... 190
Table 5.46: Coefficients for Service Quality Predictors of Overall Brand Equity ... 192
Table 5.47: Model Summary for Brand Equity Predictors of OVERALL BRAND EQUITY (OBE) ... 193
Table 5.48: Anova for Brand Equity Predictors of OVERALL BRAND EQUITY (OBE).... 194
Table 5.49: Coefficients for Brand Equity Predictors of OVERALL BRAND EQUITY (OBE) ... 195
Table 5.50: Model Summary for Service Quality Predictors of Loyalty ... 196
Table 5.51: Anova Results for Service Quality Predictors of Loyalty ... 197
Table 5.52: Coefficients Table for Service Quality Predictors of Loyalty ... 198
Table 5.53: Model Summary for Service Quality Predictors of Key Associations and Differentiation ... 199
xvi Table 5.54: Anova Results for Service Quality Predictors of Key Associations and
Differentiation ... 200
Table 5.55: Coefficients Table for Service Quality Predictors of Key Associations and Differentiation ... 201
Table 5.56: Model Summary for Relationship between OVERALL STUDENT SATISFACTION (OSS) and OVERALL BRAND EQUITY (OBE) ... 202
Table 5.57: Anova for Relationship between OVERALL STUDENT SATISFACTION (OSS) and OVERALL BRAND EQUITY (OBE) ... 203
Table 5.58: Coefficients for Relationship between OVERALL STUDENT SATISFACTION (OSS) and OVERALL BRAND EQUITY (OBE) ... 204
Table 5.59: Model Summary for Relationship between OVERALL SERVICE QUALITY (OSQ) and OVERALL BRAND EQUITY (OBE) ... 205
Table 5.60: Anova for Relationship between OVERALL SERVICE QUALITY (OSQ) and OVERALL BRAND EQUITY (OBE) ... 205
Table 5.61: Coefficients for Relationship between OVERALL SERVICE QUALITY (OSQ) and OVERALL BRAND EQUITY (OBE) ... 206
Table 5.62: Model Summary for Relationship between OVERALL STUDENT SATISFACTION (OSS), Service Quality and OVERALL BRAND EQUITY (OBE) ... 207
Table 5.63: Anova for Relationship between OVERALL STUDENT SATISFACTION (OSS), Service Quality and OVERALL BRAND EQUITY (OBE) ... 207
Table 5.64: Coefficients for Relationship between OVERALL STUDENT SATISFACTION (OSS), Service Quality and OVERALL BRAND EQUITY (OBE) ... 208
Table 5.65: Model Summary for Relationship between OVERALL STUDENT SATISFACTIONS (OSS), Service Quality and OVERALL BRAND EQUITY (OBE) ... 209
Table 5.66: Anova for Relationship between OVERALL STUDENT SATISFACTION (OSS) One Overall Measure (D7), Service Quality and OVERALL BRAND EQUITY (OBE) ... 210
Table 5.67: Coefficients for Relationship between OVERALL STUDENT SATISFACTION (OSS) One Overall Measure (D7), Service Quality and OVERALL BRAND EQUITY (OBE) ... 211
Table 5.68: Reliability for OVERALL STUDENT SATISFACTION (OSS) ... 213
Table 5.69: Model Fit Indices for the Structural Model ... 213
Table 5.70: Regression Weights ... 214
Table 5.71: Regression Weights: (Male Students) ... 215
Table 5.72: Regression Weights: (Female Students) ... 215
Table 5.73: Model Fit Indices for the Structural Model ... 217
Table 5.74: Regression Weights: (Default model) ... 218
Table 5.75: Regression Weights: (Female Students) ... 219
Table 5.76: Regression Weights: (Male Students) ... 219
Table 6.1: Summary of Key Findings Pertaining to each Research Objective ... 239
xvii Table 6.2: The Effect of Tangibles, Reliability, Responsiveness, Assurance and Empathy on
the overall higher education service quality ... 243 Table 6.3: The Effect of Service quality and its dimensions on OVERALL STUDENT
SATISFACTION (OSS) ... 244 Table 6.4: The Effect of the brand equity dimensions on the OVERALL BRAND
EQUITY (OBE). ... 244 Table 6.5: The effect of Service quality dimensions on the OVERALL BRAND EQUITY
(OBE) ... 245 Table 6.6: The Effect of Service quality dimensions on OVERALL BRAND EQUITY
(OBE) (Key Associations and Differentiation) ... 246 Table 6.7: The effect of Service quality dimensions on the dimensions of OVERALL
BRAND EQUITY (OBE) (Loyalty) ... 246 Table 6.8: OVERALL SERVICE QUALITY (OSQ) as a predictor of OVERALL
BRAND EQUITY (OBE) ... 247 Table 6.9: OVERALL STUDENT SATISFACTION (OSS) as a predictor of OVERALL
BRAND EQUITY (OBE) ... 247 Table 6.10: The association between Service Quality (SERVPERF model) and OVERALL
STUDENT SATISFACTION (OSS) ... 248
1 CHAPTER ONE
INTRODUCTION, BACKGROUND AND SCOPE OF STUDY 1.1. Introduction and Background
Marketing thinking is being transferred from a business context to higher education institutions due to the challenges posed by, inter alia, the global economy having an intense effect on education and changes in tertiary education are putting pressure on addressing the expectations of clients and stakeholders (Eggins, & Society for Research into Higher Education, 2003:121).
Although there are contrary views (Samervel, 2012 & Webber, 2011), viewing the student as a customer has become a very important focus of debate within the realms of higher education. A positive argument for viewing the student as a customer is that by putting the student at the centre of higher-education decision-making is useful in democratising the learning experience, introducing greater accountability, and helping to enhance the quality pertaining to the entire experience (Tripathi & Mukerji, 2013).
In the context of viewing the student as a customer, important customer oriented factors are service quality (Rauterberg, 2003:337), customer satisfaction (Raab, 2008:19) and brand equity (Verma, 2006:212). Within an organisational context, service quality (Panda, 2008:309; Reid & Bojanic, 2010:147; Hö hsmann, 2014:12), customer satisfaction (Chen, 2006:1; Liu, 2008:52) and brand equity (Burger, 2012:12; Kumar & Shah, 2015:18) are some of the important issues.
Service quality is a difficult construct to define and there have been many conceptualizations of it.
From a customer’s standpoint, service quality is defined as excellence, value, and meeting or surpassing customer expectations (Wood & Brotherton, 2008:316). van Schalkwyk and Steenkamp (2014) contend that service quality is a single most important issue in private higher education in South Africa. Unfortunately, Nair (2010:105) contends that there is a general lack of a quality culture in South African higher education, but in a transformation context, higher education institutions should lead and not lag behind in demonstrating quality in all areas. In fact, one of the important goals that the minister of higher education in South Africa has made reference
2 to is putting into place interventions in improving quality (MacGregor, 2012:para 9). In support of adopting a service quality orientation, Gbadamosi and de Jager, (2008:10) reason that it becomes imperative for higher education institutions in South Africa to use effective techniques to improve service quality because South African universities have experienced budgetary and government subsidy cuts and in addition, are pressurised to increase student numbers. Moreover, owing to the increased competition between higher educational institutions in South Africa, Universities of Technology (formerly Technikons) and Universities are now competing directly in the same market. Other researchers (Badat & Sayed, 2014; Mitra & Edmondson, 2015:388) have also documented similar challenges that higher education organisations in South Africa face.
In support of a service quality culture in South African higher learning, Radder and Han (2009:108) contend that “South African tertiary institutions are increasingly being forced to compete on the basis of service quality and satisfaction due to higher education becoming more competitive, changes in market demand patterns, and an increasing concern for quality assurance.” Likewise, Wang, (2012:193) also asserts that “a greater pressure is being placed on South African higher education institutions regarding service delivery.” It is noteworthy that the success of higher education institutions has been shown to have a link with service quality (Abouchedid & Nasser, 2002:198).
Like service quality, customer satisfaction is another important area of focus in marketing and is defined as “….. the feeling a customer has about the extent to which their experiences with an organisation have met their needs” (Hill, Roche, & Allen, 2007:32). Competitive pressures faced by higher educational institutions have resulted in a greater importance being placed on student satisfaction (Letcher & Neves, 2010:2). From English universities (Douglas, Douglas, & Barnes, 2006: 251-252), to Italian universities (Petruzzellis, D’Uggento, & Romanazzi, 2006: 349-350), to universities in Germany (Gruber et al., 2010:106), a strong emphasis is placed on student satisfaction.
Brand equity, unlike service quality and customer satisfaction, is a comparatively newer area of focus in marketing and amongst its various definitions, it (brand equity) has been conceptualised as “the value that the brand adds to the product,” (Crane, 2010:131). There are many potential advantages that a brand can offer in a higher education context. It helps to benefit the institution
3 through benefits being provided to students; marketing efforts become more efficient and effective; prices and margins become higher; revenue generation becomes more stable;
opportunity to extend the brand become better; a reduction in risk; and the institution becomes more competitive (Toma, 2003:201).
In as much as the concepts of service quality, student satisfaction and brand equity are important as alluded to above, there is limited literature in the areas of service quality (Gruber et al., 2010:6), demographic issues pertaining to service quality (Takaro, 2014), student satisfaction (El Rawas &
El Sagheir, n.d) and branding (Teh & Salleh, 2011; Lamboy, 2011) in a university context.
Service quality in higher education, particularly using the SERVQUAL scale is a somewhat under researched area (Barnes, 2007:317). In fact, overall, there is limited research into higher education service quality (Diedericks, de Klerk, & Bevan-Dye, 2015). Also, research into higher education service quality is relatively new (Sharma, Patel, & Sabharwal, n.d) particularly in terms of antecedents of service quality (Sultan & Wong, 2011:11).
In a South African higher education context, in the last five years, the majority of the most relevant studies in service quality focused on “gap” analyses using the SERVQUAL scale (Veerasamy, Govender & Noel, 2012; Green, 2014; Naidoo, 2014; van Schalkwyk & Steenkamp, 2014). One study used the SERVPERF model, but focused on business students and concluded that the SERVPERF scale is a useful one in higher education (Diedericks, 2012). A different study, which was a purely qualitative one found three themes in a higher education context, which were Empathy, Professionalism and Responsiveness (McClean, 2012). Finally, a study that focused on management students to find the key factors in higher education service quality, uncovered 13 factors. None of these studies went into any detail regarding the demographic issues associated with service quality, nor undertook any form of cluster analyses or predictive analyses (except for a study by Radder & Han, 2009:116), which focused on room amenities at a university, to determine statistically whether there are specific service quality factors that predict service quality.
A number of South African studies attempted to show the relationship between service quality and student satisfaction in the past five years. Of these, the most relevant studies were correlational (Nell & Cant, 2014; Hefer & Cant, 2014; Oduaran, 2011). In addition, there were studies that
4 showed positive relationships between service quality and student satisfaction using predictive analyses like structural equation modelling, but focused only on postgraduate students (Govender
& Ramroop, 2012), and another study by Gbadamosi and de Jager (2009:251) that used predictive analyses was based on non-SERVPERF or SERVQUAL dimensions. None of the aforementioned studies undertook any significant demographic analysis (i.e. with reference to gender and academic field of study) pertaining to service quality and student satisfaction.
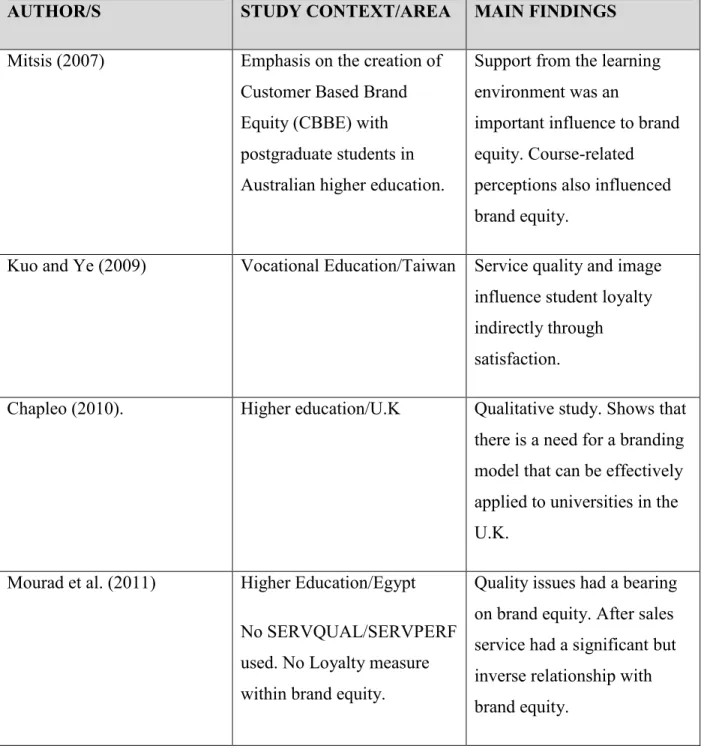
In exploring the brand equity literature in higher education over the last nine years, studies that measured brand equity of higher education institutions were Manafi et al. (2011) in Malaysian Universities, Aggarwal, Rao and Popli (2013) who studied brand equity at Indian business schools; a qualitative study using the Keller (2001) model of brand equity (Clarke,2009); U.K studies on brand positioning (Furey, Springer, & Parsons, 2014), a qualitative branding study by Chapleo (2010); a U.S-based exploratory study on brand equity (Joseph, Mullen, & Spake, 2012);
a study pertaining to creating brand equity at select Australian universities (Mitsis, 2007); a study of business school websites in a branding context (Shaari & Areni, 2009); and one African-based brand equity study of re-branding the University of Botswana (Makgosa & Molefhi, 2012).
Furthermore, regarding the relationship between service quality and brand equity in a higher education context, Mourad, Ennew and Kortam (2011) showed that quality issues in general had a bearing on brand equity in an Egyptian context. Furthermore, using non-SERVPERF and SERVQUAL dimensions, a study into Iranian universities showed that service amenities and the physical environment had a positive effect on brand equity (Moghaddam, Asadollah, and Garache, 2013). In addition, in an Australian higher education study, the support from the learning environment and course-related perceptions had a significant influence on brand equity (Mitsis, 2007). In another study, using only image as a brand equity factor and non-SERVPERF or SERVQUAL dimensions, Iqbal, Rasli and Hassan (2012) found that quality followed by prestige were significant influencers of brand equity. Finally, a brand equity study with engineering students in India found that quality influenced the brand rating of the university (John & Senith, 2013). From the aforementioned studies on brand equity and the relationship between service quality and brand equity in higher education, it is evident that there is a dearth of literature, not only internationally, but more particularly in a South African context where no studies were found
5 in the literature pertaining to the key dimensions in higher education brand equity and the predictive relationship between the popular service quality models and brand equity.
Evidently, there are gaps in the extant literature in a South African higher education context pertaining to service quality, student satisfaction and brand equity, which this study seeks answers to. Hence, the problem statement below raises the pertinent questions to be addressed in this study.
1.2. Statement of the Problem
Given the dearth of information in the literature as alluded to in the section above, this study seeks to address the following broad question:
What is the state of service quality, student satisfaction and brand equity at select South African university campuses, and is there a predictive relationship between each of these constructs and their dimensions? The sub questions relating to the broad problem are as follows:
1.2.1 How do students at select South African universities rate service quality, student satisfaction and brand equity at their universities?
1.2.2 What level of importance is placed by students on the explanatory factors/dimensions of service quality and brand equity at select South African universities?
1.2.3 What are the key explanatory factors for service quality and brand equity as perceived by students at select South African universities?
1.2.4 What is the relationship between service quality, student satisfaction and brand equity, also including the relationships between their constituent factors/dimensions as perceived by students at select South African universities?
Relating to the aforementioned research questions, the specific research objectives of the study are addressed hereunder:
6 1.3. Research Objectives
1.3.1 To evaluate service quality, student satisfaction and brand equity at select South African universities.
1.3.2 To determine and analyse the importance placed on explanatory factors/ dimensions of service quality at select South African universities.
1.3.3 To determine the key explanatory factors for service quality and brand equity as perceived by students at select South African universities.
1.3.4 To evaluate the predictive relationships between service quality, student satisfaction and brand equity (including their overall measures); also including the predictive relationships between their constituent factors/dimensions at select South African universities.
Based on the aforementioned research questions and objectives, the hypotheses that this study will attempt to address are postulated in Chapter three of this thesis.
1.4. Significance of the Study
As alluded to, this study is unique in that it attempts to address the gaps in knowledge in the existing literature within a South African higher education context. Evidently, as indicated earlier in this chapter, the areas of service quality, student satisfaction and brand equity, and more particularly the predictive relationships between these constructs, are relatively under researched areas in a South African higher education context. In addition, owing to the important role that these constructs play in organizational success as already alluded to earlier in this chapter, it is the researcher’s view that being able to effectively manage these constructs and the interrelationships between them would benefit higher education institutions in serving their students more effectively.
More specifically, the study is significant as it would be able to provide insight into how students at the select universities rate service quality, student satisfaction and brand equity, and determine if there exists room for improvement, if any. This knowledge would be beneficial to the administrators and managers of the select universities in the sample used who could utilise the
7 information to understand their strengths and weaknesses, in order to manage their institutions and attract more students.
In addition, the study is significant in helping higher education marketing practitioners to understand where students place importance regarding service quality, and to determine which areas are most and least important, to improve the focus on key areas of importance.
Moreover, the study is significant in that it attempts to understand the underlying dimensions or explanatory factors relevant to service quality and brand equity. This information will be very useful in determining whether the validated service quality (SERVPERF scale), popularized by Cronin and Taylor (1994) and brand equity (Aaker, 1996) model used in this study apply to the sample studied. This knowledge will be useful in providing exploratory insight in debating whether South African universities need different models to measure service quality and brand equity.
Another significant area of contribution of this study would be in exploring the predictive relationships between the research constructs. This knowledge would be useful in helping the managers and administrators of higher education institutions to obtain an understanding of which specific factors predict or significantly influence other dimensions, factors, and constructs.
Equipped with this knowledge, higher education marketers can manipulate the relevant dimensions or factors and constructs to affect positive changes in service quality, student satisfaction and brand equity.
The research methodology adopted in this study is briefly explained in the section below.
1.5. Research Methodology
The population under study were undergraduate students studying courses in the main academic disciplines offered at select university campuses.
Unfortunately, a list of student names, email addresses, telephone numbers, and other relevant contact details could not be obtained due to the confidential nature of the information. However, for each campus, a list of the broad disciplines under study, as well as the different courses offered within such disciplines was available. Hence, the sampling frame that was used in the study was a
8 list of all the broad disciplines and the courses offered within each discipline for each of the two university campuses chosen for the study.
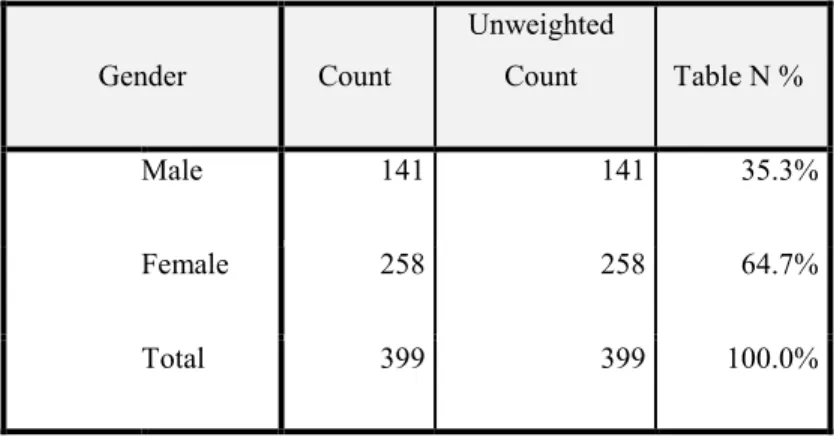
Over 500 completed questionnaires were collected. However, in the end, taking into account spoilt copies and other editing issues, the sample was reduced to 400 with 200 students from each campus so that both campuses were represented equally. Non-probability, judgmental sampling was considered to be most appropriate and used in this study.
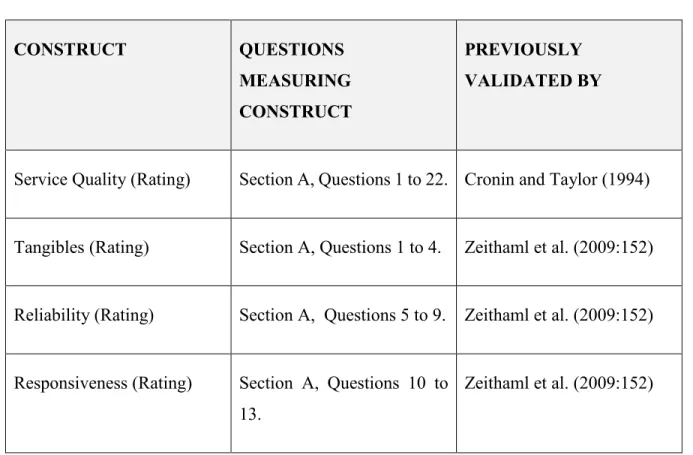
The study employed a structured questionnaire to collect the data. This questionnaire comprised of five sections. Each of the constructs under study – service quality, student satisfaction, and brand equity were measured based on validated scales as reported in the existing literature. Service quality was measured based on the SERVPERF scale (Cronin & Taylor, 1994); OVERALL STUDENT SATISFACTION (OSS) was measured based on two measurements - a four item/variable measure used by Yadav (2012), and a one item/variable overall measure used by Govender and Ramroop (2012); and brand equity was measured based on the popular Aaker (1996) model. Before finalisation of the questionnaire, it was pre-tested with marketing academics and pilot tested among students.
Data was collected using the survey method, as surveys are considered to be the most popular form of data collection method in descriptive research designs (Matthews & Kostelis, 2011:84). The data was collected from two selected campuses of different universities in Kwa-Zulu-Natal, one of nine provinces in South Africa. Before data collection, written gatekeeper permission was obtained from the respective gatekeepers (i.e. the department controlling the right of entry into the university) to conduct the survey on their respective campuses. Thereafter, application was made for ethical clearance from the Ethics Committee of the University of KwaZulu-Natal, and permission was granted to conduct the survey.
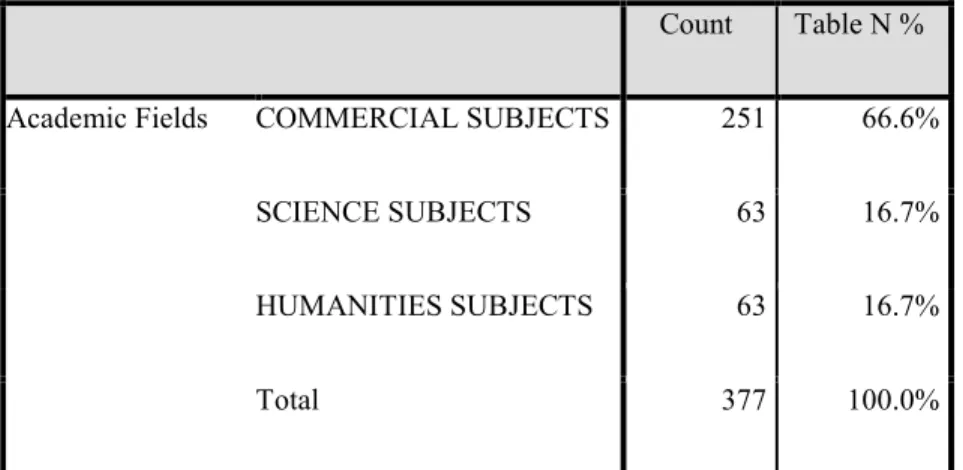
From each of the selected campuses, lecturers were contacted in advance with requests to conduct the survey in class after being briefed on the specifics of the study. Efforts were made to make sure that for each of the selected campuses, students enrolled for courses representing all the relevant broad disciplines, namely, Science, Humanities, Commerce, and other relevant disciplines were surveyed.
9 Upon permission being granted by the lecturers, the relevant lectures were attended where students were briefed on the survey and informed that participation in the study was entirely voluntary, and that the information collected will be treated in the strictest of confidence, and anonymity will be ensured. Those that were willing to participate were given about 15 minutes to complete the questionnaire.
1.6. Delimitations of the Study
In the main, this study was limited to the following boundaries:
1.6.1. The Research Problem, Questions and Objectives
This study was conducted within the context of a problem that comprised of a set of four questions and four objectives and their related hypotheses. Hence, the literature review, research methodology, findings and conclusions are within the context of these aforementioned issues.
1.6.2. The Constructs under Study
The study and its objectives focus on three constructs namely, Service Quality, Student Satisfaction and Brand Equity. Moreover, each construct is limited in its measurement and scaling.
The service quality construct is operationalized based on the popular perceptions only SERVPERF model adapted from Cronin and Taylor (1994). Service Quality is measured based on 22 items that converge into five dimensions, which are Tangibles, Reliability, Responsiveness, Assurance and Empathy. The OVERALL STUDENT SATISFACTION (OSS) construct is operationalized based on a composite mean score of four variables as used by Yadav (2012) and another measurement as reported by Govender and Ramroop (2012) where one overall measure was used to operationalise OVERALL STUDENT SATISFACTION (OSS). Hence, there were two separate measures of OVERALL STUDENT SATISFACTION (OSS). The brand equity construct is confined to Customer-Based-Brand-Equity (CBBE) as popularised by Aaker (1996) and Keller (1993), and does not include financial-based brand equity as explained by Oh (2009). In addition, the Brand Equity construct used in this study comprised of 25 variables as operationalized in the Aaker (1996) Model of Brand Equity converging into four broad dimensions, which are Perceived Quality and Leadership, Loyalty, Awareness, and Key Associations and Differentiation.
10 1.6.3. The Population
Another de-limitation of this research is the population under study. Only institutions classed as South African universities were targeted, and within such institutions, only undergraduate students were targeted. In addition, due to logistical and resource constraints, only two university campuses were included. Hence, the findings of the study should not be generalised without factoring this limitation.
1.6.4. Research Philosophy, Approach and Strategy
From a research philosophy perspective, this research is confined to using a Positivist philosophy, which according to Chui (2007:49) is perceived to be the most scientific way of research. It uses existing theory in producing other theories and hypotheses, is relatively structured and addresses important issues of rigor and validity that go with testing theory and measurement (Carson, Gilmore, & Gronhaug, 2001).
The research approach conforms to the deductive reasoning procedure outlined by Wagner, Halley, and Zaino (2011:9) in that “it moves from general to specific.” In so doing, it follows Kitchen’s (1999:480), five main sections to a deductive research project as follows:
1. Literature review: this includes a summary and critical assessment of secondary information in the field. It also addresses gaps in the literature that the researcher tries to address pertaining to Service Quality, Student Satisfaction and Brand Equity.
2. Explaining the research method: defining the main research method, explaining the research instruments to be used, and justifying the research approach to be adopted.
3. Findings: analyzing and synthesizing the primary data.
4. Discussion: interpreting and evaluating the findings and explaining how the findings can
"explain the research questions and hypotheses".
5. Recommendations: based on the findings and the limitations of the research approach will be highlighted.
11 Furthermore, this research focuses on a quantitative survey method, as opposed to qualitative research, which is less scientific (Yellin, 2008:142). It uses a scientific approach in testing hypotheses, showing statistical relationships, and using precision and objective methods in data collection, which is in keeping with Rubin and Babbie’s (2013:41) explanation of quantitative research.
1.7. Outline of the Study
This thesis spans seven chapters. Chapter one introduces the study, the problem and research questions to be investigated, the significance of the study, the research methodology and the study context.
Chapter two is the first of the two literature review chapters that introduces the important constructs to be addressed in the study, namely, Service Quality, Customer Satisfaction and Brand Equity. The main aim of this chapter is to explain how these constructs are conceptualised, measured and defined.
Chapter three is the second literature review chapter which elaborates on Service Quality, Student Satisfaction and Brand Equity in higher education. This chapter discusses the importance of Service Quality, Student Satisfaction and Brand Equity in higher education both internationally, as well as in South Africa. The chapter also reports on the relationships between Service Quality, Student Satisfaction and Brand Equity and the related empirical studies both international and South African-based.
Chapter four explains the research methodology adopted in addressing the research questions and objectives. It explains the research design, data collection method, sampling, questionnaire design and the operationalisation of the study constructs as well as data analysis specific to the research questions and the hypotheses.
Chapter five presents the research findings and is organised based on the research questions and objectives. Both descriptive and inferential statistics are used to report the findings.
12 Chapter six provides a discussion of the significant findings within the context of the research objectives. In addition, the chapter also presents models based on the significant findings of the study and summarises the main findings based on the study objectives.
Chapter seven concludes the study, provides recommendations based on the findings and offers some direction for future research.
1.8. Conclusion
Chapter one introduced the constructs to be studied, the background that has given rise to the gaps in knowledge that necessitates and justifies undertaking this study, the research problem, research questions, objectives, the research methodology, significance of the study and the parameters within which the study will be undertaken.
In the next chapter, a conceptual review is provided of Service Quality, Customer Satisfaction and Brand Equity.
13 CHAPTER TWO
SERVICES, SERVICE QUALITY, CUSTOMER SATISFACTION AND BRAND EQUITY
2. 1. Introduction
This chapter will address the theory relating to the constructs covered in the study. These constructs are Service Quality, Customer Satisfaction and Brand Equity. The unique characteristics of services will initially be addressed followed by a discussion of service quality and its importance in marketing. In addition, the various service quality models will be discussed with emphasis on the most widely used models within a marketing and management context.
Customer satisfaction, another important construct under study, will be discussed with emphasis placed on its importance in marketing and the different perspectives provided in the literature in defining and measuring it.
Finally, brand equity and its importance in marketing will be discussed. In particular, the different perspectives into brand equity namely, Customer-Based Brand Equity and Financial-Based Brand Equity will be explained. In addition, the different approaches in measuring brand equity will be discussed with particular emphasis on the Aaker (1996) model.
2.2. Characteristics of Services
The service sector has experienced exponential growth in most countries throughout the world. It contributes significantly to GDP and employment creation in the majority of countries and is fast
“becoming the mainstream focus of marketing” (Lovelock, Patterson, & Wirtz, 2014:5).
“A service is an activity which has some element of intangibility associated with it. It involves some interaction with customers or property in their possession, and does not result in a transfer of ownership. A change of condition may occur and provision of the service may or may not be closely associated with a physical product” (Payne & McDonald, 2012:10).
14 According to Lamb, Hair and McDaniel, (2014:194), services possess certain distinctive features that distinguish them from physical goods; each of these features will be briefly described below.
2.1.1. Intangibility
Intangibility is the most basic characteristic of services. A service cannot be seen, touched and smelt in the same way as tangibles. Due to the intangible nature of services, customers will make inferences regarding quality based on aspects of the service environment such as the people, place, equipment used and other tangible cues. Hence, services marketers need to be able to manage the physical evidence (tangibles), which can translate into converting the intangible service into concrete benefits (Rama, 2011:9).
2.1.2. Heterogeneity
Heterogeneity will come about because no two customers are the same and because of this, each customer would have demands that are unique and each would experience a service differently.
Consequently, it will be difficult to standardise service quality.
2.1.3. Simultaneous Creation and Consumption
In general, the creation and consumption of a service takes place simultaneously. This means, that customers are often present whilst the service is being produced. Hence, customers become coproducers of the service.
2.1.4. Perishability
Unlike tangible goods, marketers are unable to store, keep, or resell a service. In addition, a service customer is not able to return a service. In particular, the inability to store a service creates certain challenges for the marketers of services, mainly in terms of forecasting demand and capacity utilization planning. The inability to return or resell a service challenges marketers in that they need to have effective strategies in place to recuperate goodwill from customers in the event that something goes wrong (Zeithaml, Bitner, & Gremler, 2009:22).
15 Other academic writers in the field of services marketing have also alluded to the presence of the above unique characteristics of services (Verma, 2012:28; Rai, 2013:186-187).
Reid and Bojanic (2010) allude to the fact that service quality is important to customers, which is important for marketers to understand. In addition, Dominic, Goh, Wong, and Chen, (2010) have shown that service quality has an important role to play in gaining competitive advantage.
2.3. Service Quality and Service Quality Models
Siddique, Karim and Rahman (2011:3) contend that “quality is an elusive and indistinct construct”
that is not easily articulated by customers and difficult to measure by researchers. Similarly, Oh (2009:211) contends that service quality is both elusive and challenging to define and alludes to the many different perspectives used to define service quality over time, albeit many inherent weaknesses. Consequently, Oh (2009:211) suggests that the definition of service quality is best looked at by a performance-only measurement, and on this basis argues that a better definition of service quality should be based on a customer’s personal evaluation of performance. Other authors (Verma, 2008; Lindenau-Stockfisch, 2011; Lisch, 2014 ) define service and view service quality on a similar basis, that is, it is subjective.
Despite the many challenges faced in defining service quality, it “is one of the most researched areas of services marketing” (Adamson & Polgar, 2012:166). For example, the construct service quality was intensively investigated and widely researched by Parasuraman, Zeithaml and Berry (1985). The importance of service quality is documented by Hu, Kandampully, and Juwaheer (2009:112) who cite many authors (Anderson & Zeithaml, 1984; Buzzell & Gale, 1987;
Parasuraman et al., 1985; Zeithaml, 2000) who concur that service quality has a contributory role in consumer satisfaction and market share and suggesting that all organizations driven by a quest to survive and be competitive must pursue service quality.
As the interest in service quality increased over time, there have been many service quality models developed that covered many different types of services ranging from conventional services to web-based services. According to Merican, Suhaiza, and Fernando (2009:282), there are at least 19 service quality models that have been used and applied in a services marketing context. In addition, there have been many service quality models that have been applied to the manufacturing
16 sector and adapted for use in the service sector. These service quality models have been extensively studied and reported on (Seth, Deshmukh, & Vrat, 2005:915-932; Verma, 2012:412-414; Xu, Yasinzai, & Lev, 2013; Emel, 2014:79-93). A discussion of some of the more popular service quality models follows.
2.3.1. “Technical and Functional Quality Model” of Gro̎nroos
According to the Gro̎nroos (1984) model of service quality, service quality includes three components: “technical, functional and image” quality. Gummesson and Gro̎nroos (2012:483- 484) state that “technical quality” is focused on the result of the service i.e. what a customer receives based on his/her interaction with the service organization; “functional quality” pertains to how the customer gets the technical quality i.e. the process; and image quality, a “dynamic aspect”
which is important to service organizations, includes both technical and functional quality as well as additional marketing-related isues.
The Gro̎nroos (1984) service quality model is popular and a significant model of service quality, as it emphasises on the manner in which the service is conducted (Kardaras & Karakostas, 2012;
Rodrigues, 2013).
2.3.2. The “Gaps Model” (SERVQUAL) of Parasuraman, Zeithaml and Berry
According to Parasuraman et al. (1985:42) the “Gaps Model” of service quality (Figure 2.1) or SERVQUAL is based on a “disconfirmation paradigm”. This model envisages service quality as based on the difference between customer expectations of the service and their perceptions of the performance of the service by the service organization.
17 Figure 2.1: The “Gaps Model” of Service Quality
Source: Parasuraman, Zeithaml and Berry (1985:42)
Zeithaml et al. (2009) explain that the SERVQUAL model comprises of five domains or dimensions of service quality, which are depicted by 22-items, variables, or attributes in a measurement scale, which are discussed hereunder. These domains or dimensions of service quality are Responsiveness, Reliability, Assurance, Empathy and Tangibles. The SERVQUAL questionnaire used to measure the quality of a service comprises of two sections – one measuring the expectations of the service for each of the 22-items, and the other section measuring the perceptions of the service for each of the 22-items in the scale. Reliability is mainly concerned with whether the outcome of the service delivery was as promised. Responsiveness pertains to the ability to be helpful to customers and the provision of prompt attention. Assurance is the ability to instill trust and confidence by a service organization in the mind of the customer regarding its
18 service delivery. Tangibles pertain to the appearance of issues such as buildings, staff, communication materials, and so on. Empathy pertains to the caring and individual attention provided by the service organization to its customers.
As already alluded to, SERVQUAL is based on the gap or variance between customer expectations and their perceptions of the actual service. The SERVQUAL dimensions would show how customers differentiate performance on these dimensions (Bebko, 2000) cited in Hu et al.
(2009:112). The “Gaps Model” (SERVQUAL) of service quality views services in a structured and cohesive manner. The model is made up of Customer and the Provider (Marketer) Gaps (Zeithaml et al., 2009). A discussion of the “Gaps Model” follows:
The “Customer Gap” looks at the differences between what customers expect and what they get.
Expectations are essentially standards or reference points and perceptions are subjective based on what the customer thinks would happen. Due to the importance of customer satisfaction in influencing the competitiveness of a firm, in order to deliver quality service, an organization needs to begin with an understanding of its customer. The “Customer Gap” is calculated by finding the variance between what a customer expects and what he/she gets to determine service quality. There could be a positive gap, negative gap or no gap. Of particular concern will be a negative gap, as this would mean that customer expectations exceed their perceptions of the service (Zeithaml et al., 2009:32-33).
In terms of the “Provider Gaps”, four service quality gaps are prevalent, which are the “Listening Gap (Gap 1)”, “Service Design and Standards Gap (Gap 2)”. Service Performance Gap (Gap 3)”
and the “Communications Gap (Gap 4)” as explained by Zeithaml, et al. (2009:33).
The “Listening Gap (Gap 1)” is concerned with the differences between what the customer expects of the service and the organisation’s understanding and knowledge of such expectations. It arises due to an organization lacking an understanding of what customer expectations actually are.
Organizations may not be aware of customer expectations due to a number of reasons. They may not be willing to ask about customer expectations or not be prepared to address expectations.
Consequently, this may result in poor decisions thereby affecting service quality negatively. One of the reasons giving rise to the “Listening Gap” (Gap 1) is inadequate marketing research. An