cape T =
SOUl'H AFRICAN INCCME DISTRIBlJrION 1900 - 1980
Stephen Devereux Saldru Working Paper No. 51
August 1983
ISBN 0 7992 0545 1
This Working Paper is a revised version of a Long Paper which was presented to the University of Cape Town's Department of Economics in 1982, in partial fulfilment of the requirements for the Bachelor of Arts Honours degree.
I wish to express my sincere gratitude to Mr Charles Simkins, my supervisor, for his invaluable statistical assistance and for pointing out several ambiguities in the first draft.
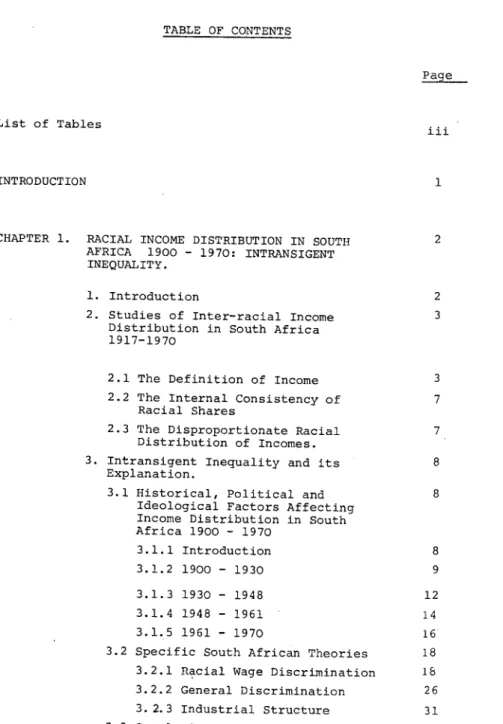
TABLE OF CONTENTS
List of Tables
i i i
INTRODUCTION 1
CHAPTER 1. RACIAL INCOME DISTRIBUTION IN SOUTH AFRICA 1900 - 1970: INTRANSIGENT INEQUALITY.
2
1. Introduction
2. Studies of Inter-racial Income Distribution in South Africa 1917-1970
2.1 The Definition of Income 2.2 The Internal Consistency of
Racial Shares
2.3 The Disproportionate Racial Distribution of Incomes.
3. Intransigent Inequality and its Explanation.
3.1 Historical, Political and Ideological Factors Affecting Income Distribution in South Africa 1900 - 1970
2 3
3 7
7 8 8
3.1.1 Introduction 8
3.1.2 1900 - 1930 9
3.1.3 1930 - 1948 12
3.1.4 1948 - 1961 14
3.1.5 1961 - 1970 16
3.2 Specific South African Theories 18 3.2.1 n~cial Wage Discrimination 18 3.2.2 General Discrimination 26 3.2.3 Industrial Structure 31
3.3 Conclusion. 33
CHAPTER 2.
CONCLUSION
APPENDIX REFERENCES
THE 1970's: A T&~ND TO. EQUALITY?
1. Introduction
2. Evidence of Declining Inequality 2.1 Abstract Explanations
2.2 Specific Explanations
2.2.1 Political and Economic Factors
2.2.2 Mining
2.2.3 Other Sectors 2.3 Summary.
3. Dissenting Voices 3.1 Inflation
3.2 Poverty Datum Lines 3.3 Capital Substitution 3.4 Sex Discrimination 3.5 Unemployment
3.6 Pensions and Overtime 3.7 Upward Mobility 4. Conclusion
1. Introduction 2. Theories 3. Statistics.
Page 34 34 34 39 41 41 43 47 49 50 50 51 52 54 54 56 59 62 64 65 68 71 76
Table 1
Table 2
Table 3 Table 4 Table 5 Table 6 'rable 7 Table 8
Table 9
"LI ST -OF TABLES
Studies of Inter-Racial Income Dist- ribution in South Africa, 1917-1970 Indicators of Changes in the Structure of Political and Economic Power in South Africa
4
27
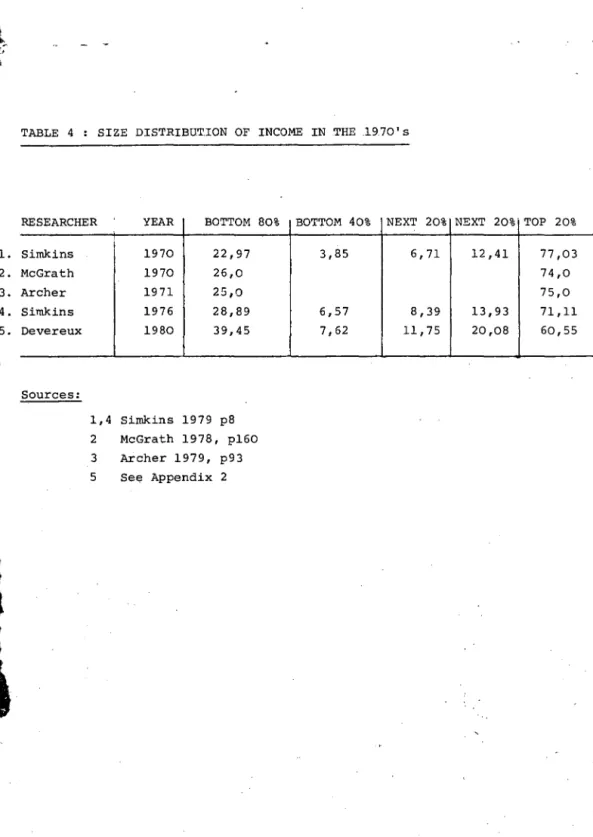
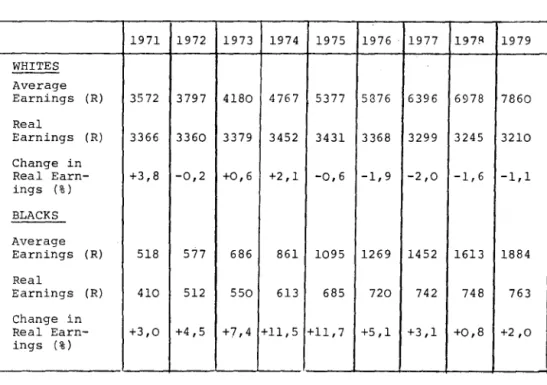
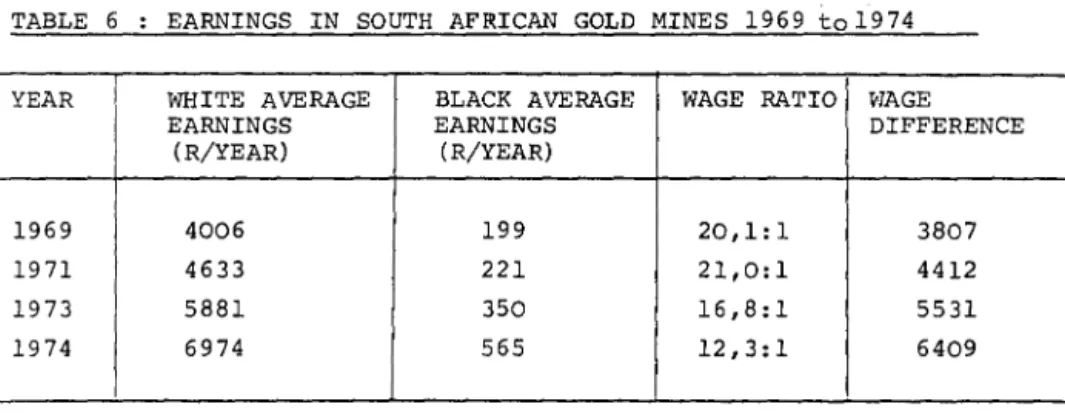
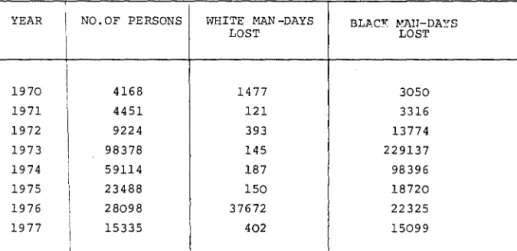
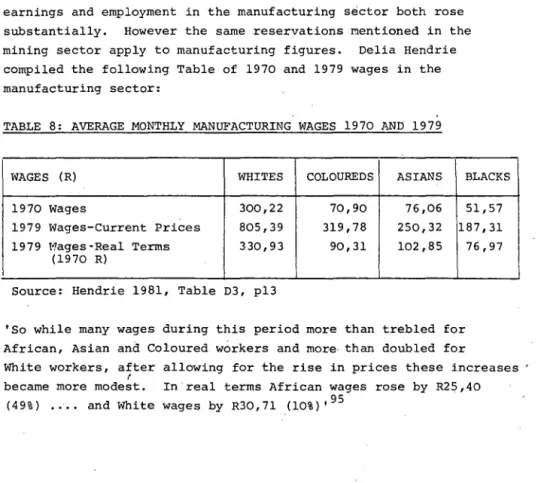
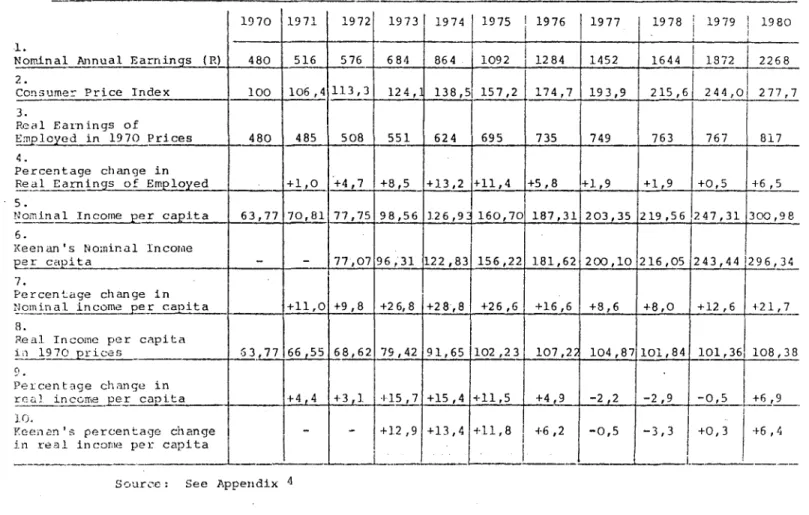
Racial Income Distribution in the 1970's 36 Size Distribution of Income in the 1970's 37 Nominal and Real Earnings 1971-1979 38 Earnings in South African Gold Mines 1969-1974 44 Industrial Disputes in South Africa 1970-1977 46 Average Monthly Manufacturing Wages, 1970 and 47 1979
Real Black Earnings per Capita 1970 to 1980 58
INTRODUCTION
From the earliest statistical evidence in 1917 until 1970,
South Africa maintained~ perhaps, the most distorted distribution of income between individuals and race groups in the world. Yet since 1970 a sudden reversal of historical trends has occurred, resulting in substantial real increases in Black incomes and a significant reduction in South African inequality indices.
The tremendous inequality in South Africa's income distribution conflicted directly with theoretical and empirical predictions.
According to the Kuznets U-curve hypothesis, inequality tends to increase in the early stages of development, but eventually levels out and begins to fall 1. This can be explained in terms of the 'typical' development pattern for developing countries.
Economic growth generally starts with the expansion of a narrow modern sector in a subsistence agrarian economy which raises income inequality substantially,'particularly where expatriate exploitation of rich natural resources provides the motivating force for
2 ' -
growth. A sharp dualistic growth prevails for some time and severe inequalities will persist as long as a traditional or expatriate/
colonial elite dominates the nation's economy and politics.
Eventually income disparities will start to even out, partly
as a result of political independence and partly because the economy becomes more broadly based. The process of increasing income
inequality usually peaks and is reversed relatively early in most countries' development paths.
The observation that South Africa has not moved along the Kuznets U-curve is due to a combination of economic, political and
institutional factors which have effectively fixed South Africa in a transitional dualistic stage of development. This paper is concerned with analysing the factors relevant to South African income
distribution from pre-1900 to the present .
.i .... ;" ... ..,;.' • "'-.. .-, ... -
CHAPTER 1
RACIAL INCOME DIS'rHIBUTION IN SOU'l'H AFRICA 1900 - 1970 INTRANSIGENT INEQUALITY
1. INTRODUCTION
South Africa suffers from a curious scarcity of information about the distribution of incomes among its inhabitants.
No official statistics or even estimates of income shares by race or other groupings are published; in fact, until the 1980 census, government censuses and surveys specific- ally ignored the personal incomes of Blacks. All studies to date of income distribution in South Africa have been made by academics using various definitions, methodologies, data sources and assumptions. Until the 1970's, such studies were almost exclusively concerned with inter-racial income
distribution, and not one accurate estimate of South Africa's Gini coefficient was produced until Simkins' in 1979.
These deficiencies are unfortunate, since if the distribution of personal incomes is accepted as 'the best available
surrogate for the distribution of economic welfare,3 then South Africa has lost a great deal of potentially useful
information 'about the spread of welfare in a given socio-economic system; changes in this spread over time; identifying the poor;
estimating saving and consumption patterns,4 and the level of socio-economic development at each point in time. According to Archer there is 'a remarkable paucity of systematic data by income interval, occupation, industrial activity, region or even race group itself, and therefore no direct method of identifying change or stasis in the structure of income historically'. 5
Although little work was done on South Africa's size
distribution of income before 1970, miscellaneous estimates of income distribution by raCial category have been produced at irregular intervals since Union in 1910.
2. STUDIES OF INTER-RACIAL INCOME DISTRIBUTION IN SOUTH
-- AFRICA
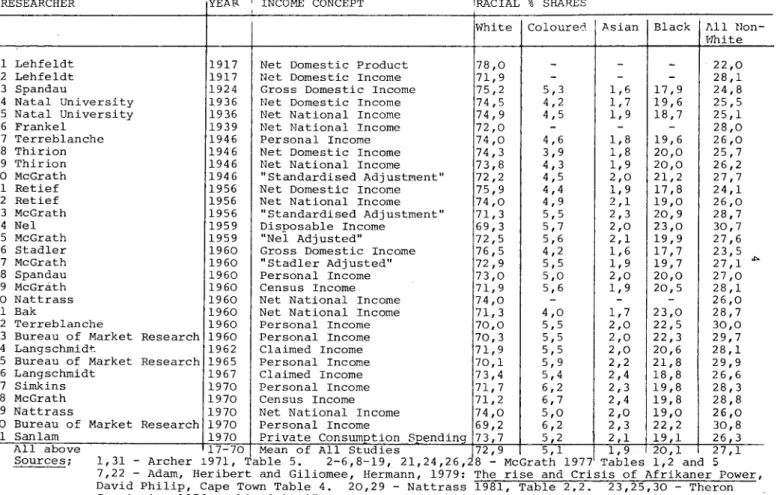
1917 - -1970The table overleaf collates most published studies on , South Africa's racial income distribution up to 1970.
Four features are immediately apparent from a cursory examination of the table:
1. Many definitions of income were used, most of them based on National Accounts statistics;
2. In spite of these definitional differences a remark- able consistency of racial shares is observed between most researchers;
3. The bulk of National Income accrues to Nhites, with Africans receiving a significant (gross') amount and Coloureds and Asians earning very little;
4. The racial distribution of income in South Africa had remained virtually static for over 50 years.
The last of these four pOints is arguably the most interesting and controversial, and many explanations for constancy have been postulated. These will be discussed below. Before dOinq so, however, th~ other three features merit attention.
2.1 The Definition of Income
A most comprehensive definition of income was conceived by the 1955 Royal Commission on Taxation of Profits and Income, embracing'all receipts which increase·an individual's command over the use of society's scarce resources - in other words, his net"accretion of economic power between two points of time ,,6 •
TABLE 1. STUDIES OF INTER-RACIAL INCOME DISTRIBUTION IN SOUTH AFRICA, 1917-1970
RESt:AHCHt:H yt:A",- ' lNCOMt: CONCt:P'l' , IRAC1AL 0. SHARES
White Coloured ! A.sian Black 1'.11 Ilon- vlhi te
1 Lehfeldt 1917 Net Domestic Product 78,0
-
--
22,02 Lehfeldt 1917 Net Domestic Income 71,9
-
--
28,13 Spandau 1924 Gross Domestic Income 75,2 5,3 1,6 17,9 24,8
4 Natal University 1936 Net Domestic Income 74,5 4,2 1,7 19,6 25,5 5 Natal University 1936 Net National Income 74,9 4,5 1,9 18,7 25,1
6 Frankel 1939 Net National Income 72,0
- - -
28,07 Terreblanche 1946 Personal Income 74,0 4,6 1,8 19,6 26,0
8 Thirion 1946 Net Domestic Income 74,3 3,9 1,8 20,0 25,7
9 Thirion 1946 Net National Income 73,8 4,3 1,9 20,0 26,2
10 McGrath 1946 "Standardised Adjustment" 72,2 4,5 2,0 21,2 27,7
11 Retief 1956 Net Domestic Income 75,9 4,4 1,9 17,8 24,1
12 Retief 1956 Net National Income 74,0 4,9 2,1 19,0 26,0
13 McGrath 1956 "Standardised Adjustment" 71,3 5,5 2,3 20,9 28,7
14 Nel 1959 Disposable Income 69,3 5,7 2,0 23,0 30,7
15 McGrath 1959 "Nel Adjusted" 72,5 5,6 2,1 19,9 27,6
16 Stadler 1960 Gross Domestic Income 76,5 4,2 1,6 17,7 23,5
17 McGrath 1960 "Stadler Adjusted" 72 ,9 5,5 1,9 19,7 27,1
...
18 Spandau 1960 Personal Income 73,0 5,0 2,0 20,0 27,0
19 McGrath 1960 Census Income 71,9 5,6 1,9 20,5 28,1
20 Nattrass 1960 Net National Income 74,0 -
-
- 26,021 Bak 1960 Net National Income 71,3 4,0 1,7 23,0 28,7
22 Terreblanche 1960 Personal Income 70,0 5,5 2,0 22,5 30,0
23 Bureau of Market Research 1960 Personal Income 70,3 5,5 2,0 22,3 29,7
24 Langschmidt 1962 Claimed Income 71,9 5,5 2,0 20,6 28,1
25 Bureau of Market Research 1965 Personal Income 70,1 5,9 2,2 21,8 29,9
26 Langschmidt 1967 Claimed Income 73,4 5,4 2,4 18,8 26,6
27 Simkins 1970 Personal Income 71,7 6,2 2,3 19,8 28,3
28 McGrath 1970 Census Income 71,2 6,7 2,4 19,8 28,8
29 Nattrass 1970 Net National Income 74,0 5,0 2,0 19,0 26,0
30 Bureau of Market Research 1970 Personal Income 69,2 6,2 2,3 22,2 30,8 31 Sanlam 1970 Private Consumption ~endi~ 73,7 5,2 2,1 19,1 26,3 2,3
I
22,2 30,82,1 19,1 26,3 All above 17 70 Mean of All Studies 72,9 5,1 1, 9 I 20, 1 27 , 1 Sources; 1,31 - Archer 1971. Table 5. 2-6.8-19. 21.24.26. 8 - McG 1977' Tables 1,2 and 5
7,22 - Adam, Heribert and Giliomee, Hermann, 1979: The rise and Crisis of Afrikaner Power, David Philip, Cape Town Table 4. 20,29 - Nattrass 1981, Table 2,2. 23,25,30 Theron Commission 1976, Table 3.1. 27 - Simkins 1979, p6.
JflIs::::z nil . . . "' ... ilNI.kt,.. I.'. w ... ,,,. . • -
I ,
,
I
'"
t
l
, P
In South Africa National Income includes all components of earnings received by the factors of production, namely wages and salaries, profits, interest and rents. Personal income is derived from National Income by deducting
co~porate savings, direct corporate taxation, and the income from property of the general government. To this
is added the value of current transfers received from general
govern~ent and current transfer payments from the rest of the world.
The South African Censuses of 1960 and 1970 used an income concept which included wages, dividends, rents, pensions, income in kind and the value of self-produced consumer goods, but which excluded capital gains, other windfalls, subsidies and transfers within families. Although this comes close to the 'ideal' concept of personal income, McGrath argues that the exclusion of 'certain items of income' such as employees' contributions to pension funds and imputed rents on owner
occupied buildings may have a significant effect on Census results.
A further problem is that Black incomes must be calculated as a residual of Total Personal Income, since Blacks are not asked about their incomes, so the value of non-primary subsistence production in the 'Reserves' is omitted.7
Finally, income surveys are notorious for their conservative results - respondents habitually understate their true earnings.
McGrath allowed for unspecified incomes and understatement, and he adjusted 1960 and 1970 Census data to generate income
distributions 19 and 28 in Table 1.8 These are possibly the most accurate estimates for those two dates, and are compatible with other results for the same years.
National Accounts data, on the other hand, are highly aggregated into functional categories such as employee
remuneration, property incomes, corporate savings and corporate taxes. Incomes are allocated indirectly to racial groups from these aggregated figures to determine racial shares. De Lange has criticised the Department of Statistics for publishing data that is frequently incomplete or inconsistent, for
changing methods of data collection arbitrarily, and for being
secretive about processing techniques and accuracy estimates.
Furthermore, 'in the nat-ional,accounts no indications are given of racial breakdown for issues such as personal saving, taxation, consumption expenditure etc,9
Because of the infrequency of census data, the National Accounts were the prime source of income information for most researchers up to the 1960s. No common definition was agreed on, although Net National Income and Net Domestic Income were the two most popular concepts.
McGrath has standardised the studies of Thirtin, Retief and Stadler, which were all based on different National Accounting concepts of income, to 'an approximately common definition of personal income,lO. These adjustments are shown as lines 10, 13 and 15 in Table 1, and once again are not too dissimilar from the original results.
Nel's 1959 study is based on more liberal concepts than the National Accounts. It includes all non-commercial transactions in the Black subsistence economy, as well as a much wider definition of transfers to households than that included in Total Personal Income. McGrath's adjustment to the constant definition yields figures very close to his adjusted results of Stadler, 1960.
To conclude, in spite of frequent warnings about the uncomparability of unstandardised income studies, the
diverse definitions of income used by researchers have apparently had little effect on their empirical results, National Accounts data and Census figures yield compatible results and McGrath's standardisation of various National Accounts interpretations generates only minor changes. Table 1 is not a set of consistent accurate data, but tentative trends may justifiably be deduced from its content.
1
!2.2 The Internal Consistency of Racial Shares
The surprising compatibility of results derived from different definitions and methodologies has been discussed above.
One potential source of confusion remains to be mentioned - the possibility of consis'tent bias among these studies.
If all researchers are using the same systematically inaccurate sources of information - National Accounts or Censuses - then they might be prone to common over - or underestimation, irrespective of their definitions and statistical techniques.
McGrath, Spandau and others have probably done enough work on
South Africa's inadequate income data to show that they are at least crudely accurate. Archer admits that the orders of magnitude
concerned 'feel' right intuitively, and he also points out that 'The margins of error they contain would have to be enormous to upset the putative conclusion that South Africa . . . . has an extreme degree of skewness. 11'
2.3 The Disproportionate Racial Distribution of Incomes The extent of personal income inequality in a society is only apparent when population figures are considered in
conjunction with income distribution. If racial incomes shares remain constant but relative population shares shift over time, the effect on individuals is equivalent to ~ change in the racial income distribution. Hence the contention that racial income shares in South Africa have been constant since Union is rather misleading. ~ .
From Table 1 i t seems that the White share of National Income.
has been greater than 70% at least since 1917, while the Black share has fluctuated between 18% and 23%. Between 1917 and 1970, however,the Whites as a proportion of total population declined from 21,6% to 17,8% while the proportion of Blacks rose from 67,9%
to 70,0%.12 The maintenance of such a high White income share in the fact of rapid Black population growth reflects the deepening rather than constant inequalities of South African society.
g
3. INTRANSIGENT INEQUALI'l'Y AND r:'S EXPLANATION
3.1 Historical, Political and Ideolog~cal Factors Affectin9 Income Distribution in South Africa 190~ ~ 1970
3.1.1 Introduction
A number of theories have been applied to the South
African situation in an attempt to explain the persis·tent skew in racial income distribution during the twentieth
century. At most, each provides only a partial solution.
An eclectic paradigm is necessary, one which incorporates the unique political, social and economic forces that combined to create and maintain the grossly unequal dist- ribution ~f income in South Africa at least until the 1970s.
The following discussion is roughly chronological, and will be non-theoretical. The economic effects of historical processes will be analysed with specific reference to their impact on income distribution.
9 3.1.2 1900 - 1930
,.
.
The first major consequence of the ~lliite conquest of southern Africa was the massive dispossession by Nhites of Black land. Towards the end of the nineteenth century,
~ite agriculture had become the dominant economic activity in the Boer Republics, while population growth and lack of capital was s:queezing the Black nation into a vicious circle ,of declining per capita product., However, some evidence
suggests that isolated Black areas were competing successfully with White cash-crop farmers for the profitable agricultural markets provided by the rapid growth of mining c~ps and
commercial centres.
Bundy, for instance, argues 'that there was a substantially more positive response by African agriculturists to market opportunities than has usually been indicated; that an adapted form of the traditional subsistence methods provided for
hundreds of thousands of Africans a preferable alternative to wage labour on ~fuite colonists' terms; that a smaller group of African farmers made considerable adaptations"
departing entirely from the traditional fgricultural economy, and competed most effectively with l.vhite farmers. In
'explaining the subsequent failure of this response and these adaptations, i t is suggested that the crucial post-mineral period was one in which non-market forces predominated:
in which discriminatory and coercive means were utilised
by the wielders of economic and political power to disadvantage the African peasantry: and that an economy was created whose structure was such as to render "market forces" highly favourable to the White capitalist sector. The decline in productivity and profitability of A~~rican agriculture - and the corollary ,of greater dependence by Africans on wage labour - is in an
imnortant sense the outcome of the nature of capitalist develop-
me~t
in South Africa,13.10
This capitalist development began with the discovery
!: . - " . , ... '-,'
of diamonds at Kimberley in 1367 and of gold on the l'litswatersrand in 1886, which created a massive demand for cheap Black labour, and started a series of formal and informal policies designed to ensure a constant supply of such labour for as long as deemed necessary.
Since this labour was preferably to be inexpensive, a 'carrot' inducement of high wages was impractical, so a 'stick' approach was adopted to drive Blacks off their land and down the mines. South African Blacks were further disadvantaged by being forced to compete with cheap foreign labour, which depressed mining wages considerably.
It was the coincidence of White agriculture and mining interests that led, shortly after Union in 1910, to the legalised implementation of the 'stick'in the form of the 1913 Land Act. Whether the Land Act was instigated by pressure from viliite farmers or from mining capitalists is unclear, but the results proved beneficial to both interest groups.
It may well be that the origins of high racial income differentials in South Africa can be traced to the initial
development of the mining industry and the simultaneous expansion of White agriculture at the expense of Blacks. While the State attack on Black agriculture was not essential, Fisher, Schlemmer and Webster argue that without State intervention, 'the
movement to the urban places of work would have been slower, much more restricted and would have created "market forces "
which "could have favoured higher wages for Africans. The presence of alternative forms of livelihood would have
given African workers greater independence and bargaining power from the outset' .14
I" : ~
I
During the 1920's, strangely enough, i t was the ~iliites who suffered the 'culture shock' of South Africa's rapid
'i~d~strialisation,
not theBi~cks: 'R~~al p~pulation
growth and the attractions of commerce led to large- scale urbanisation of Afrikaners, who were cut off from the English-controlled capitalist sector by the language barrier. The subsequent 'Poor White' problem persisted until the Second World War, although an exceptionally successful campaign was waged against it.
This campaign was headed by the Carnegie Commission of 1927 which identified the main cause of the 'Poor White' problem as 'Maladjustment to Changed Conditions', resulting from various accessibility barriers between the rural and urban sectors. The Commission recommended a broader system of State-subsidised education, including compulsory school attendance up to 15 years of age, and vocational guidance courses for rural children. Minimum wages for certain
categories of unskilled work were also advocated and implemented, which effectively entrenched labour discrimination against unqualified Blacks. Racial discrimination in employment was further encouraged by the Commission's recommendation of job reservation in industry and its explicit support of the
'civilised labour' policy introduced by the"Pact government·
in 1924, which advocated preferential employment of Whites"
in the public sector.lS
With hindsight, i t is e<isy to condemn the Carnegie Commission as just another brick in the wall of legislation constructed to deny Blacks access to the fruits of South Africa's economic prosperity, but i t must be recognised that its proposals were valid attempts to alleviate a poverty crisis in the short term. The Commission was not directed specifically against B1acks; the job reservation recommendation, for example, carried the following proviso: 'A policy by reservation of work to the"
Europeans should be treated as merely a measure of transition for
~. a period during which the poor White is given the opportunity to adapt himself to new conditions in South Africa,16
i, il"
12
It is the failure of the a1.1tborittes to remove these restrictions until the 1970's, restrictions which were s1.1ggested In the 1920's as temporary remedies only, that exacerbated the pllght of
Black workers unnecessarily and ralsed income differentlals to artificial heights. One might conc11.1de tentatively that the recommendations of the Carnegie Commission were instr1.1mental in reducing the Poor White problem of the 1920~s and '30's, but because they were never abolished as the Commission intended, they ultimately contributed to the 'poor Black' problem of the 1970's and '80'S.
3.1.3 1930 - 1948
During this period several positlve and negative forces combined to yield an ambiguous overall effect on income distribution. In 1936 two ominous signs for Blacks were the completion of the 1913 Land Act, which left Blacks owning only 13% of the country, and the Representation of Natives Act, which removed the last remalnlng Black South Africa.n voters from the common voter's roll. The 'Poor White' problem had not yet been resolved, so segregation and white protectionism became
further entrenched in the 1930's,
On the other hand, the Smuts-Hertzog United Party government initiated many welfare and education policies which probably had positive distributive effects. Bromberger cites the
following examples of the government's liberal attitudes dUring the 1940's: 'social pensions were extended to Blacks and Asians for the first time in 1944; the coverage of unemployment
insurance (1937, 1942) was widened across industries and down the wage scale in 1946;and cost of living allowances (1941) had a distinctly progressive character, thereby reducing the wage differential between high- and low-paid work,17 Bromberger suggests that these trends may be explained by the economic boom after 193'3, allowing generous State expenditure on welfare programs, and by the concomitant growth of the manufacturing industry, which possibly competed for Black labour on a wage or allowances basis. Another important influence was .the Second World War, during which the economy experienced
·1
a significant dependence on Blacks after the exodus of White males. At the same time, Black political movements' wene gaining momentum in South Africa, and the government evidently responded with economic appeasement rather than political concessions.
Black education also benefited ,from the decade of United Party liberalism. From 1940 to 1943 government grants and the percentage of Black tax revenue allocated to Black education wene raised annually, and in 1945 a separate budget vote was created for 'Native education' unrelated to revenue collected from Black taxation. Bromberger notes, however: ' I t is clear that in 1945 there was already opposition from within both main parties to progressive policies ',.18
The most vociferous opponents of 'progressive policies' were the Afrikaner element of the United Party coalition and the breakaway National Party led by Dr D.F. Malan. The National Party was the political platform of a powerful ideological movement which has subsequently been labelled Afrikaner nationalism. The incredible achievement of this
Afri~aner mobilisation, which culminated in a Nationalist election victory in 1948, has been summarised by Heribert Adam in a single sentence; , Such ethnic politicisation -
of which racism, to be sure, was an important facet- culminated in a successful ethnic revolution; the disciplined rise of a defeated, impoverished people to political dominance, economic prominence, and cultural achievements in an unprecendented few decades.' 19
As Adam implies, the ethnic ethos and the racist policy of apartheid had both political and economic origins. no Sizwe
postulates that the rise of Afrikaner nationalism was a deliberate reaction to the realisation that 'there was economic advantage to be gained from asserting a distinct political identity based
, , 20
on culture and language'.
14
Relegating (or elevating) the objective of ethntc identity from a political to an economic struggle, No Sizwe describes the post-Union period as one where the Afrikaans petty bourgeoisie attempted to mobilise the economic and political support of Afrikaner workers in order to promote the expansion of national capital.
Recognition of this economic dimension largely explains the rapid strengthening of Nationalist control in spite of its obviously unjust treatment of unenfranchised South Africans.
Put simply, vfuite self-interest has always prevailed over any moral misgivings voters may have. The election of 1948
gave the State a mandate for a return to high vfuite living standards and security, with its necessary corollary of further Black
repression and deprivation. Viewed in this pessimistic light, the ray of progress that shone during the 1930's and 1940's was nothing more than a deceptive digression from the inexorable South African reality of l'7hite domination, Black oppression and interracial inequality.
3.1.4 1948 - 1961
The early years of Nationalist government were undoubtedly years of regressive income distribution policies. Most
Uni ted Party welfare p ro rrraT'1.nes Ivere disma:1.tled or at least cut back, and economic barriers against Blacks were strengthened.
Bromberger argues that ' regressiveness was apparent also in the insistence. that White interests were paramount and were to be protected if necessary and promoted where possible by direct discrimination in law, administration and expenditure. ,21 While not defensible on economic or equity grounds, this action is understandable and even politically rational. The National Party was elected by Whites, and its power base lay in the Afrikaner
section of the White population. Now that all Blacks, Coloureds and Asians had been struck off the voter's roll, the government had Ii t·tle incentive to promote the interests of these groups, and in fact Afrikaner objectives were often pursued at their expense. Hence the grossly discriminatory practices of the Nationalist government can be regarded fundamentally as positive stimulants to Afrikaner business, and only inCidentally
---_.-.
I I'
15
as directed against Blacks, though an element of racial prejudice may have aggravated the situation.
Some government measures, however, seem unnecessarily severe and provided no obvious benefits to any group of people.
Bromberger lists the following examples of the government's 'tendency to restore or increase racial differentials and to reduce expenditure on selected black services' 22
Firstly; unemployment insurance for Blacks was
sy~tematically restricted by raising eligibility requirements and depriving seasonal workers of coverage. Secondly, racial disparities in social pensions were increased. Thirdly, Black school feeding schemes were gradually phased out, and were virtually nonexistent by 1960. More importantly, Black education was neglected, especially after 1955, when financing reverted to the pre1945 system. A Bantu Education Account was created and funded by a fixed sum of R13 million from the annual Budget, plus 80% of the general tax paid by Blacks. 'This policy led to declining state per capita expenditure on black education (in both. real and nominal terms)23 and an. '.increased financial burden on black parents' The effects of these expenditure cutbacks were unambiguously negative, as was Nationalist labour legislation during the 1950's, which was designed to protect Whites by denying Blac~~
free competition on the labour market. Statutory job reservation favouring White semi-skilled workers was formalised and extended to many industries by 1960, and Black trade unions were discouraged by bans on Black strikes and the suppression of collective
bargaining rights. Similarly, the Group Areas Act of 1950 restricted the access of Black traders to urban and suburban areas designated as White, which cut off many potentially
profitable markets and inhibited the rise of a Black entrepreneurial class. The Group Areas Act was supported by streamlined pass
laws in 1952, which aimed at controlling the Black Labour supply and artificially maintaining low unskilled wages by preventing Black urbanisation. Bromberger notes that these laws were distributionally regressive, since 'restrictions on exit from
agriculture were making more difficult a transfer from an essentially low-wage sector to the high-wage sectors,24
It is often claimed that the policies adopted by the Nationalist government were designed to retard the natural integration of classes and economic sectors that typically accompanies development, in order to maximise ~fuite profits. Kuznets
predicted a development pattern including high income inequality caused by poor urban-rural linkages during early industrialisation, followed by gradual income equalisation as intersectoral
barriers are eroded by market forces. In South Africa, i t is argued, Black repression has been a means of perpetuating barriers and urban-rural incomes differentials, resulting in increasing concentration of wealth in the hands of the White capitalist class. Government policy, even before the
Nationalist accession in 1948, has attempted 'to freeze the socio-economic structure ••••.• in a transitional dualistic phase' . 25 The evidence of the 1950's points to an intensification of these efforts, after a temporary relaxation during the
previous decade.
3.1.5. 1961 - 1970
The 1960's can be regarded as a watershed decade for racial income distribution in South Africa, if only because i t preceded the dramatic turn-around of the 1970's. Substantial progress was made in race relations and the erosion of labour market barriers, both formally and i'nformally, which would only be reflected in statistics for the following decade.
The preconditions for the progress6f the 1960's were
many and varied. One important factor was the growing Black unrest evident in the late 1950's, which culminated in
Sharpeville probably the nadir of South African ethnic relations.
This finally made the government aware of the high price of entrenched economic and political inequality in its multi-racial society. Besides, such extr~e discrimination was no longer essential. The National Party was firmly ensconced on the throne of South African government, and i t led the 'volk' to the zenith of i t s ' successful ethnic revolution' with the proclamation of a Republic in 1961.
I
1, I
Apart from these political forces, the economic climate was more conducive to increased State exp~nditure on Black
interests than before. Gross Domestic Product grew at an average of 5,8% per annum during the 1960'.s, the highest growth rate since the 1920's 26, yielding higher tax revenues for redistributive purposes. Furthermore, the ideological objective of encouraging Afrikaner business had been satisfact~
orily achieved. By 1964, Afrikaners controlled an estimated 28% of commerce, up from 8% in 1939, and substantial progress had also been made in mining, finance and industry. 27
Government priorities probably broadened around this time from the defence of Afrikaner workers to national defence of White South Africa, so a period of tentative reform began.
Among the indicators of a changing State attitude were the expansion of subsidised local transport services for Blacks, and improvements in Coloured and Asian pensions as a percentage of l'lliite pensions • . Per capita expenditure on Black education also started to rise after 1962, but greater hike's in White education spending ensured that the White/Black ratio widened further.28 With regard to legislation few positive steps were taken, but i t appears that the law became flexible and Blacks found the labour market more accessible than the statutory restrictions required. Bromberger believes that the progressive distributive impact of greater Black job mobility was minimised by ~fuite
demands for higher wages as compensation. 29 This is supported by Jill Nattrass' finding that 'In the ten years between 1960 and 1970 modern sector average Black and average White real wage rates grew at almost the same pace, namely 3,9 percent and 3,7 percent per annum respectively' 30 Similarly
Nattrass' calculation of identical raciai income shares in 1960 and 1970 (White: 74%, Black 26% in both years) implies a
distributionally neutral net effect of all labour and welfare policies of the 1960's.
The most crucial negative influence on income'distribution at that time was the ideological vision of separate development.
18
In a way, this policy of 'macro-segregation' is another argument for the artifici~lly-prolonJed dual economy hypothesis,
although the objectives of the policy are ostensibly political rather than economic. Extended influx control and large-scale Black 'resettlement' built new barriers between rural and urban areas, and were distributionally regressive because Blacks were confined to 'Reserves' which had few employment opportunities or income-generating prospects. State efforts to promote 'border industries' were feeble and ineffectual, and in fact 'rural poverty was almost certainly exacerbated,31.
To sum up, in Bromberger's phase, the 1960's showed distinct 'signs of a thaw'. Economic rationality had begun to assert itself in the marketplace, but was unfortunately hindered by political ideology. All in all, no significant progress was made in terms of wage gaps or income distribution. By 1969 the White/Black wage gap on the gold mines had peaked at 20,1:132
, and when Simkins recorded a Gini coefficient for South Africa in 1970 of 0,71 he also noted that 'coefficients greater than these are not reported for any country in a quite comprehensive list published by the International Labour Organisation in 1973' 33. The Afrikaner ethnic revolution had left a heritage of inequality and injustice in its wake unlike anything statistics could measure anywhere else in the world.
3.2 specific South African Theories
Many writers have produced theories specifically designed to explain income differentials in South Africa. The bulk of these writers have 'concentrated on discrimination as an
explanatory variable, but some have argued that South Africa's growth and industrialisation was a prime cause of racial income differences. Although not unrelated, these theories will be discussed in three separate categories: wage Discrimination, General Discrimination and Economic Growth.
3.2.1 Racial Wage Discrimination
In 1964 J.B. Knight completed 'A Theory of Income Distribution in South Africa', an eclectic theory embracing Classical, Keynesian and marginal productivity theories.
I 'I
I
~.
The Classical theory is relevant to this subject, since i t comes closest to explaining interracial wage differences in the capitalist sector. Knight, following Lewis, 1954, divides the South Aftican economy into a'highly developed capitalist sector and an underemployed peasantry in subsistence agriculture, which provides an elastic supply of largely unskilled labour to the capitalist sector'.
Since the Whites hold a virtual monopoly of skills, , i t is appropriate for the purpose of analysing income distribution to divide the population into an unskilled black group which is under-employed, a fully-employed skilled white group, and a profit- receiving capitalist group' .34
Now because the supply of unskilled Black Labour is perfectly elastic, the wage rate is unrelated to worker productivity, but
'may be determined by a conventional view of the minimum required for subsistence; or i t may be equal to the average product per man
in subsistence agriculture, plus a margin,~5
White labour, on the other hand, is relatively skilled and relatively scarce. lihite wages are excessively higher than Black wages not just because of higher White productivity, but also because skilled ~fuites earn 'a monopoly rent accruing to a factor in highly inelastic supply~36.
This analysis is interesting and comprehensive - Knight applies the Lewis 'unlimited labour' model to Black workers;
marginal productivity theory to White workers; and an
'artificial scarcity rent' concept to explain the differences between the two.
In suggesting that a surplus supply of unskilled Black labour exists side by side in South Africa with a relatively scarce pool of skilled White labour, Knight is clearly describing a
gross perversion of the typical dual sector pattern of development.
In early development, according to Lewis, the capitalist sector is expected to grow rapidly, raising the share of profits in the national income as long as the phenomenon of 'surplus labour'
persists. However, Lewis points out: 'The capitalist sector cannot
20
expand in these ways indefinitely, since capital accumulation can proceed faster than population can grow. When the surplus is exhausted, wages begin to rise above the subsistence
level,~7
This is the first step in the erosion of the barriers between the two sectors.
In South Africa, influx control and other labour rationing mechanisms previously discussed, combined with an unnecessarily
large employment of foreign migrant workers, have enabled ~he
capitalist sector to grow extremely fast without raising Black wages substantially. Commenting on the consistency of racial income shares from 1917 to 1970, Jill Nattrass wrote: 'The persistence of an income distribution of this nature over time means that the bulk of the purchasing power generated during the economic growth of the past century has accumulated in the hands of the White members of the community' .38
Instead of eliminating racial barriers and integrating the labout force, economic growth, supported by government actions, has benefited the Whites almost exclusively, with Blacks earning hardly any of the wealth for their efforst. According to Knight and McGrath: 'Within the institutional and political framework which keeps Black labour unskilled and plentiful and White labour skilled and scarce, the market mechanism acts as a malevolent Invisible Hand to produce increasing racial inequality,.39 In other words, the initial period of rising income inequality postulated by the Kuznet's U-Curve has been artificially extended in South Africa by structural restrictions on free exchange in the labour market.
Most of these constraints have been mentioned earlier, but Knight adds some interesting observations. In some occupations, a 'rate for the job' was enforced until rairly recently. This meant that Black workers could not undercut by offering to work at lower wages than Whites, so that 'the official prejudices of employers and the better training of White workers together ensure that Whi te ,labour i's preferred to Black'. 40 Another point is that White workers were unionised when Blacks were not, so that Blacks had very little bargaining power while Whites, holding a monopoly in most skills, could agitate successfully for higher wages. Knight concludes that
'the white wage rate is simultaneously a rent secured from the monopoly of skills and a reward for higher productivity at the margin', and that 'the equalisation of income in South Africa cannot proceed very far without a change in the socio-political situation responsible for the unequal distribution of land and skills,.41
22
While Knight's 1964 article was highly original and probably valid when i t first appeared, the theory is now something of an historical oddity. Even at the time, Knight's
stringent demarcation of the labour force into two separate factors of production - skilled labour, entirely White, and unskilled labour, entirely Black - was rather artificial.
With the progress of the late 1960's and early 1970's, these generalisations rapidly lost any justification they might once have had.
An impressively comprehensive treatment of relevant issues and up-to-date theories is provided by Knight and McGrath's 1977 paper, 'An Analysis of Racial Wage Discrimination in South Africa'. The authors argue that wage discrimination can explain at most up to half of the disparities in racial per capita income in South Africa. They then exam~ne wage data and labour legislation in terms of various theoretical frameworks, and conclude by
accepting modern market segmentation explanations.
Knight and McGrath believe that the origins of high racial wage gaps are to be found in the 'enormous racial differences in occupational structure,42 evident in South Africa. Whites were found to dominate the managerial, executive, professional and technical categories, while Blacks, Coloureds and Asians filled the semi-skilled, low clerical and labourer positions. This
observation is consistent with Knight's 1964 assumption that Whites are typically skilled and Blacks are unskilled, although such a generalisation is obviously extreme.
Three aspects of labour market segmentation theories were used to explain this abnormal occupational structure : 'job competition', 'internal labour markets' and 'crowding'.
The job competition concept is an eclectic approach drawing on neo-classical marginal productivity theory, theories of
discrimination and human capita~ theory. In this model employers are assumed to screen job applicants according to background
"
r
characteristics such as education, race and sex, and to attach an economic value to these characteristics that determines the order of applicants in the queue. This discrimination is not based on racial or sexual prejudice, but on expected training costs and productivities: 'lacking direct information on training costs for specific workers, employers rank workers in accordance with their background.characteristics, which they use as indirect indicators of the costs necessary to produce the standard work performance' 43
Racial job discrimination in South Africa is explained by the collective action of White workers, supported by government, to ensure that they receive preference in the queue for the preferred jobs. Legislated job reservation and minimum wage policies are two examples of measures which encourage racial discrimination by employers. While jo~ reservation is overt enforced discrimination, minimum wage legislation is more subtle; low productivity (Black) workers tend to be excluded in favour of higher-productiyity (White) workers, with the level of minimum wage determining how many low-productivity workers are cut o;ff from employment opportunities.
Knight and McGrath accept the relevance of the job competition theory without noting the obvious contradiction in the South
African application. The theory predicts that employers discriminate against Blacks because they perceive Blacks as ,being more costly to train than Nhites; they believe that Nhites are usually better educated, have broader general skills are good promotion prospects or are preferable in other ways. If this is so, Nhites would automatically be employed before. Blacks, and supportive legis- lation would be redundant. The legal enforcement of job dis- crimination implies either that the theory is irrelevant in South Africa, or that the basis for racial discrimination may erode over time, so that legislation was enacted to entrench preferential employment practices in anticipation of this possibility.
24
The second concept discussed by Knight and McGrath is that
of 'internal labour markets', described as a method of regulating job competition. An internal labour market discriminates for and against worker groups by establishing wage and employment
practice norms in specific industries which are negotiated between powerful labour groups and employers. It is argued that white unions and traditional industrial arrangements have established strong internal labour markets in many industries which are
dominated by Whites who consciously strive to exclude Blacks.44 This is more than a matter of blind prejudice, although the perceived loss of status from having a Black superior may be a real issue. More importantly, White workers are afraid of reduced wage levels or even of losing their jobs if Blacks flood the skilled labour market.
The third and last segmentation concept, 'crowding' is also the most fruitful, according to Knight an;: ;',;::Grath. Crowding is related to both the job competition and internal labour market models, in that i t explains how one group can monopolise certain
jobs and crowd other worker groups into different job categories.
Once again, union power and government legislation enables Whites to monopolise the high-skill and also, in South Africa, public sector occupations, restricting access and competition from Blacks.
Knight and McGrath extend the crowding concept from occupational discrimination to racial wage discrimination in the public
sector, 'where for many years it has been the enshrined principle~45 The public sector has traditionally provided job security and
moderate incomes for the unskilled minority of Whites who could command only very low pay in the private sector. In addition, the state is virtually a monopsonist (monopoly employer) of Blacks qualified as teachers, nurses and low-ran,king administrators.
This allows the government to discriminate on pay as well as
on occupation, and in fact 'a three tier salary structure, applying in descending order to Whites, Asians and Coloureds, and Africans is found over a broad spectrum of skillsl~6
l I
'1 I
After tabulating racial wages for comparable occupations, Knight and McGrath observe that Black wages are relatively and absolutely lowest in low-skill jobs such as primary school teacher or police constable. On the other h~nd, Black University professors earn 92% of the pay of White professors. Hence i t appears that 'wage discrimination is reduced as the level of
° d ° to ° ,47
education requlre In a pos lncreases .
Such discrimin?tion is made possible by the artificial division of occupational labour markets in South Africa. Black nurses, teachers and doctors do not serve Whites, both by custom and by law, so they cannot compete with Whites of similar training.
Declining discrimination in high skill jobs is explained by the greater range of options available to more educated Blacks. Knight and McGrath argue that 'the degree of racial wage discrimination is likely to reflect the extent of racial differences in transfer earnings.' 48 They explain the reduced wage discrimination in higher public sector posts as. due to the greater opportunities outside the public sector.
Kantor and Re·es add an international dimension to this scenario.
Addressing the question 'Is White Labour Overvalued?' they point out that skilled workers are highly mobile (and have high transfer earnings). The constant migration of skilled workers to and from South Africa implies that local salaries are international~y
competitive since 'If South African skilled wages were not competitive, the traffic would be overwhelmi~gly outwards,~9 The argument applies equally to skilled Blacks, who earn up to five times the pay of low-skilled public sector Blacks.50 Knight and McGrath conclude that Whites are sheltered in the labour market on all fronts by legislation like job reservation, by preferential public sector employment, by powerful trade unions, and by employer prej·udices. Blacks are crowded into unattractive jobs for which the demand is limited in relation to supply, thus allowing Lewis-type wage discrimination (because of the 'unlimited labour' effect). Overt wage discrimination is found mainly in the public sector, where i t is explained by low Black transfer earnings
26
and restraints on labour competition. However, job discrimination is a major cause of excessive wage gaps between occupations.
'By preventing wage discrimination within an occupation, White
workers achieve occupational discrimination and hence the possibility of wage discrimination between occupations •... If Blacks are
assigned to jobs with lower productivity and pay than their education and ability warrant, that is wage discrimination no less for being disguised,~l
The point is that job discrimination is as insidious a form of entrenching income inequality as racial wage discrimination, although its effects are more difficult to detect and quantify.
3.2.2. General Discrinination
Wage and job discrimination are two impo~tant elements of South African income inequality but several other factors are equally important. Discrimination exists in areas outside the labour market, which also affects racial income shares and welfare levels.
Nattrass points out that welfare derives from political and economic power, and she has drawn up an illuminating list of relevant
indicators for 1960, 1970 and 1977. The table reveals a total concentration of political pmver in the hands of the White group - 100% control of Parliamentary seats - but a riSing Black power potential as their share of the total workforce, of public sector employment and of matriculants increases: (see Table 2 overleaf) This ~s significant because i t implies greater bargaining power for Blacks, and ultimately represents a platform for a degree of
political participation. Only when the State recognises Blacks either as constituents or as a real threat to White security will i t implement serious attempts to raise Black wages and welfare.
There are many reasons why income is an inadequate proxy for welfare particularly in South Africa, and. there is also evidence that income disparities are merely syr.lptons of discrimination at a deeper level.
Some of these issues will be discussed briefly, but only to the extent that they affect the distribution of income, which is the primary concern of this paper.
i I
~ (
TJlBIE 2: INDICATORS OF CHANGES IN THE STRUcrUPE .oF POLITICAL AND ECONOHIC POWER IN SOlJI'H AFRICA
NATURE OF INDICATOR
WHITE GROUP ALL BLACK GROUPS 1960 11970 11977. 1960 11970 197i Political Power
Overt
Percentage Control of seats in the House of
I
IAssembly 100 100 100 0 0 0
Covert
Percen tage of Total population 19 17 17 81 83 . 83
Percentage Urban 84 87 38 40
Economic Power Th rough Capi t al
Share of Personal Income Share of Managerial Jobs Share of Public Sector Jobs Share of Industrial Jobs Through Labour
Actual
Percentage of Top Jobs Percentnge in Top Jobs
74 97 46 '28
74 97 36 24
68 97 28 21
26 3 53 72
26 3 64 76
80
1
75 73I
20I
2.5I
41 47 43 2 4
. I
32 3 72·
79
27.
5
Potential
I ~ I
perceot.g. of
Ec~omical1y
Active Populati= .2°1
18 17 80I
62I
83_ pe_r~eI~ta~e of Hatricu1ation ~asses 94 88! 8.0 6
I
12. 20Soucer,: Nattrass "'l'he South Aid.cnll Economy" / 1981, p286
"
-.J
28
A crucial point to bear in mind is that wages do not reflect different working conditions and environmental features of the various race groups. Archer notes: 'Given the structural divisions of the labour market, two workers of equivalent capability can earn identical money wages in work periods that vary by 25% or more 'if they are of different races5
?'
Even if hourly wage rates were equalised, influx control ensures that Blacks spend much more time and money than urban Whites, Coloureds and Asians in travelling to and from work. This expense is rarely incorporated in Black wages.
A similar accusation can be levelled at employers of migrant labourers. The migrant system is based on the premise, in
Francis Wilson's words 'that a human being can be broken into two
"
parts: a labour unit working in town, separated from the other part -." ~an with parents and wife and children, with hopes and aSPirations,:3 This unnatural separation has historically been destructive of
Black social life. Colin Murray has found evidence of a high incidence of conjugal instability, illegitimacy, marital breakdowns and general emotional misery, in a study of migrant communities in Botswana and Lesotho.54 In no way are Black migrants compensated for the inconvenience and personal hardship they endure under these harsh conditions.
Discrimination is also apparent in the distribution of social or public goods. Whether Whites benefit disproportionately from the provision of law and order services, national defence and local administration expenditure is debatable. Certainly the higher crime rate among Blacks indicates poorer policing and a less favourable living environment than most White areas, and the
pending electrification of Soweto, for example, should raise living standards and reduce the crime rate.
Health and education are two types of government services where racial disparities are easily discerned. Though not directly related to incomes, poor health. and low wages may have mutually reinforcing negative effects.
..
---~-~---~~---29
Available data is sketchy but most indicators point to vast differences in the health of the four major race groups in South Africa. In 1960, the incidence of tuberculosis per 1000 of population was 39,6 for vihites, 525,7 for Coloureds (52%!), 187,3 for Asians and 325,1 for Blacks. By 1974 White incidence was down to 18,1, Coloureds down to 327,7, Asians to 143,0 and Blacks to 285,2. Infant mortality rates are not know for Blacks, but in 1974 the figure per 1000 population was 18,4 for Whites, 115,6 for Coloureds and 32,0 for Asians.55
A
c~mparative
study has revealed that Black infant mortality is probably higher than theColoured rate - which is itself more than six times the White figure.56 The supply of health facilities for Blacks is correspondingly deficient.
In 1972 there were 10 hospital beds per 1000 of White population.
The figures for Blacks in South Africa was 5,57, and in the homelands i t was 3,48.57
A final health statistic of interest is racial life expectancies.
Since these figures were first published in 1946, the life expectancy of Black males has risen considerably, but is still far below the White rate. Over the period 1946 to 1975, the average life of White males was extended by only a few months, from 64,57 to 65,08 years. Black males, on the other hand, gained eleven years, from
40,97 to 52,05 years. Coloured expectancy rose from 44,78 to 50,54 and Asians from 54,87 to 60,32.58
Kantor and Rees postulate a direct link between income distribution and the age distribution of the population: 'Incomes rise with number of years spent working. If whites are on average older than
Blacks and have accordingly spent a longer period at work, this would account for part of the observed racial income differences,59.
This is an 'experience accumulation' rather than an 'asset accumulation' argument. Workers far along a career path will earn more than a
new recruit, and the large numbers of Blacks entering the economy each year serve to depress average Black wages in each sector accordingly.
A related point is that if Whites have a longer working life they
" also have greater opportunity to accumulate assets which generate non-wage income (dividend-yielding shares and savings, for example) or can be transferred to children after death (the family home and other
30
property). This is one explanation of inter-generation racial concentrations of property and capital. Spandau found that South African Whites have received more than half their total income from non-work sources at least since 1946. The corresponding figure for Blacks was less than 10% up to 196060 Unfortunately no
calculations have been made for recent years, but i t is possible that rising Black life expectancy has raised Black average incomes,
pensions received and accumulated assets. Certainly Black contributrions to pension schemes rose dvamatically in the 1970's.
State spending on education has been covered earlier in this paper, so will be embellished with only a few more statistics and
observations. In 1973 State spending on education totalled R97m, but per capita spending on Whites was R387 in the Transvaal and R557 in Natal, while the average for Black pupils was only R29.61 The 1970 census revealed that over 90% of urban Black males had not completed a primary school education, probably because Black
teachers are generally underqualified and over-utilised. As recently as 1976, 84% of Black school teachers had a junior certificate or less,
and only 11% had passed standard 1062 In 1980 the ?u~!l-teacher ratio averaged 18;7 in White schools and 45,9 in Black schools. 63
Perhaps these appalling statistics can be related to our preceding analysis. As has been shown, high incomes and living standards for Whites have historically been maintained by preferential employment policies supported by Black-repressive government legislation. Wage discrimination has been facilitated by job
discrimination, which is achieved by White monopolisation of skills - which in turn may be ensured by White monopolisation of high-quality education. Perhaps State neglect of Black education in the past reflects more than careless indifference; i t may well have been a planned component of the system which guaranteed cheap, unskilled Black labour to White industry, agriculture and the mines. Referring in particular to training, Francis Wilson touches on this issue when he argues that 'In the South African context, we may criticise the
education and training available both on the grounds that i t restricts output, as people are not all properly equipped to do the jobs they are doing, and also that i t effectively prevents large numbers of individuals entering cells into which they would surely flow if they could have had the necessary training,~4 Discrimination in education