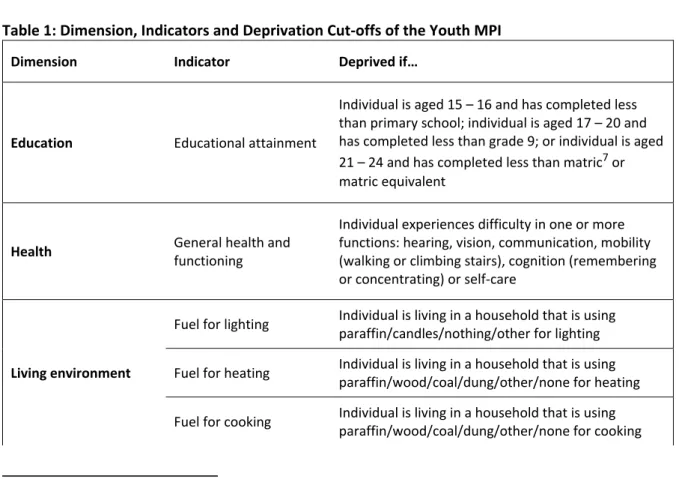
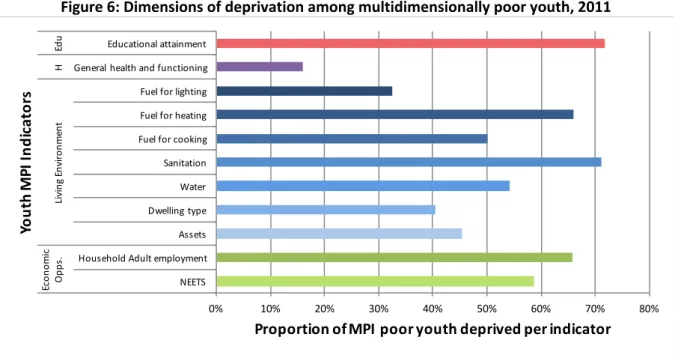
The analysis of the specific indicators that make up the Youth MPI shows that 72% of multidimensionally poor young people are deprived of educational achievements. The results illustrate the potential utility of the MPI for youth as a tool for informing and targeting youth-directed policies and interventions. The multidimensional youth poverty index (hereafter Youth MPI) described in this paper is based on the multidimensional poverty measurement method developed by Alkire and Foster3 (hereafter AF method) and includes various specially selected components to reflect the unique experiences of today's South African youth. group.
These and subsequent Youth MPI applications enable the identification of young people experiencing a range of disadvantages simultaneously within specific areas of the country. 9 This included but was not limited to: The Constitution of the Republic of South Africa (Republic of South Africa, 1996a). However, this is a household-level indicator that is not directly related to the health of an individual young person.
A key advantage of the adjusted headcount introduced in the AF method is that it summarizes information on both the incidence of multidimensional poverty and the intensity of hardship suffered. The authors are currently working, in collaboration with Statistics SA, to produce small area-level estimates of the Youth MPI. Since the 2011 Census provided the most suitable data for subprovincial disaggregation, the development of the Youth MPI was limited by the rather limited number of youth-relevant survey items included in the questionnaire.
As a result, the Youth MPI presents a somewhat limited assessment of the health situation of young people in South Africa.
Robustness checks
However, this kind of information is particularly important for the design of policies and interventions. However, it may be that the poor in one municipality are exposed on average in seven out of ten indicators (intensity), whereas the poor in the other municipality are only exposed in three out of ten indicators. By combining headcount and intensity, adjusted headcount is sensitive to both the prevalence and depth of poverty and can therefore provide a more nuanced picture of deprivation than traditional measures.
As mentioned earlier, estimates presented at a relatively high level of aggregation may hide pockets of poverty that exist at a small area level. To provide a more fine-grained analysis of the Youth MPI at sub-municipal level, it would be necessary to use the 100% (or full) Census 2011 sample. Ideally, a measure of multidimensional poverty for the youth cohort would include indicators that capture hardships related to, for example, safety and violence, quality of social relationships, access to information26, emotional and mental health and so on.
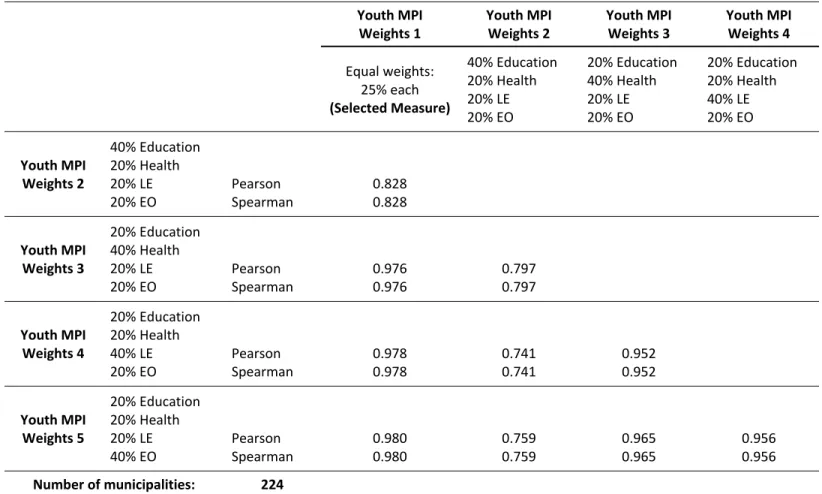
As noted earlier, the census provides no information on disease, nutrition, hunger or food security. The correlations between the equally weighted estimate and the three alternatives are 0.827 or higher using the Pearson correlation coefficient and Spearman's rank correlation. These results indicate that while changes in the weights may affect the size of the poverty estimates that can be produced by the Youth LPI, they will not significantly affect the relative position of each municipality in relation to others.
In other words, the MPI rankings for youth across municipalities are robust to differences in its weighting structure. Depending on the poverty line, it is possible that a limit above or below 1/3 (or 33.33%) would significantly change the ranking of the municipalities and thus have a strong impact on the results and their use. To test whether the MPI for youth is robust to variations in this threshold, the measure was estimated for a reasonable range of poverty thresholds, from 1. Then, for each estimate, municipal scales were constructed and rank correlation coefficients were calculated.29 Table A2 in the Appendix presents the Spearman rank correlation between each pair of ranks.
The minimum correlation is 0.868 between a score with a poverty line of 30% and a score with a poverty line of 80%. While changes in the poverty line would inevitably affect incidence rates, these results show that the MPI ranking of youth across municipalities is robust to changes in the poverty line.
Profiling multidimensional poverty among the youth
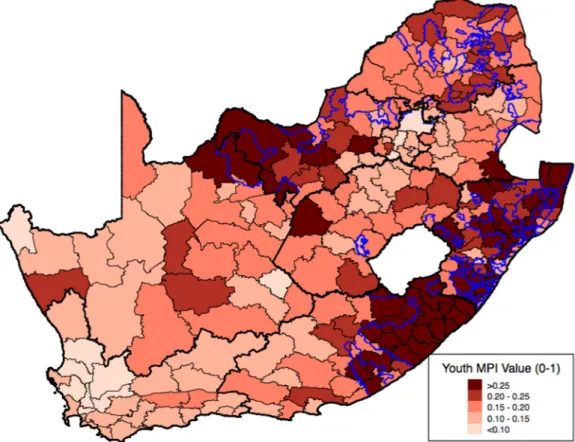
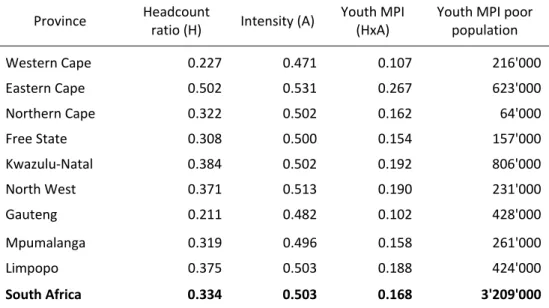
While the Youth MPI score is not very intuitive to interpret, it can be loosely understood as reflecting the concentration of poverty in a particular area, i.e. the concentration of poverty across young people and for each young person (Alkire, Roche, & Seth, 2011). In contrast, Gauteng has a significantly lower Youth MPI score, suggesting that the concentration of poor youth and deprivation for each poor youth is significantly lower. This is because the Youth MPI differs from the SAMPI in terms of its unit of analysis and its construct of the education, health, and economic opportunity dimensions.
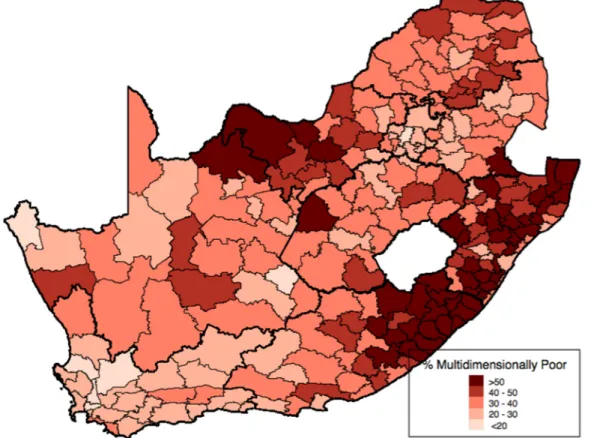
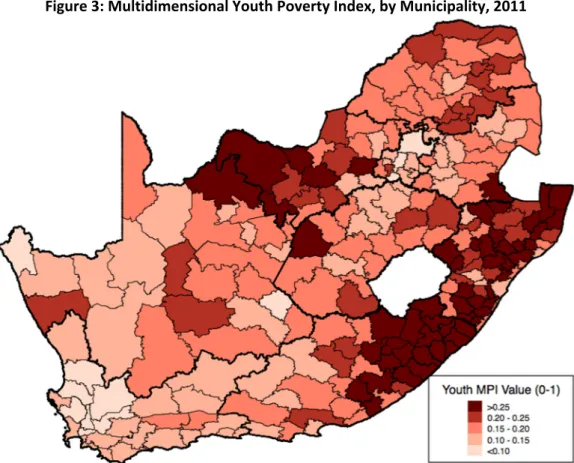
The Youth MPI can be used as an analytical tool to highlight the spatial patterns of poverty among the youth population. The map highlights several pockets of extreme youth poverty (shaded in dark red on the map), these are municipalities where more than half of the youth population is classified as multidimensionally poor. No municipality in the Western Cape or Gauteng has a Youth MPI value above 0.25 and only one municipality in the Northern Cape, Free State and Mpumalanga each has an MPI value above 0.25.
The map highlights the deep levels of deprivation still found in former homelands, even within the youth cohort. The municipalities with the highest Youth MPI values (shaded in dark red on the map) correspond very closely to the areas previously designated as Bantustans. The Youth MPI can be parsed in a number of other ways to provide valuable insights into multidimensional poverty in the youth population.
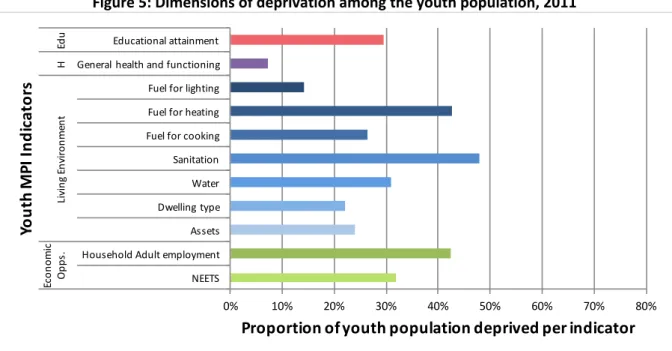
About 43% of the youth population lived in households that did not use clean fuels for heating, 48% lived in households without a flush toilet, and 42% lived in households where working-age adults were not employed. Deprivation in educational attainment, water and NEET was also particularly high with 29%, 31% and 32% of the youth population deprived of these indicators. Notes: Values show the percentage of deprived youth in each indicator as a percentage of the entire youth population.
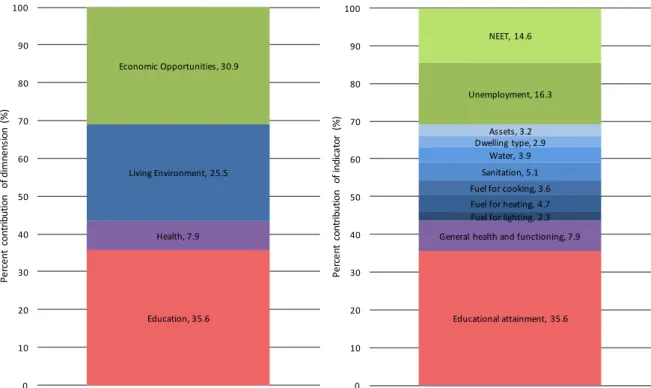
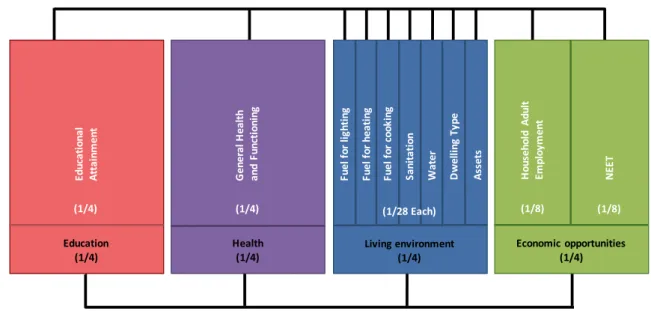
The Youth MPI can also be disaggregated to analyze the composition of poverty in terms of indicators and dimensions. The three indicators with the largest contribution to the total MPI for young people are educational attainment (35.6%), adult unemployment (16.3%) and NEETs (14.6%). Interestingly, while the heating fuel indicators and household unemployment indicators had similar deprivation levels in Figures 5 and 6 above, their weighted contributions to the overall youth MPI in Figure 7 are vastly different.
30 The contribution of each indicator or dimension to the Youth MPI is calculated as the proportion of young people who are poor and disadvantaged in that indicator or dimension, multiplied by its weight, divided by the total number of indicators or dimensions and then multiplied by overall Youth MPI. Despite being given equal weight, the dimensions of education and economic opportunity contribute much larger shares to the Youth MPI.
Conclusion
Subnational differences and the intertemporal evolution of multidimensional poverty in developing countries (OPHI Research in Progress 32a). Acute Multidimensional Poverty: A New Index for Developing Countries (Oxford Poverty & Human Development Initiative Working Paper No. 38). National Human Development Report Training Material: The Multidimensional Poverty Index (MPI) (OPHI Research in Progress 31a).
Measuring acute poverty in the developing world: robustness and scope of the multidimensional poverty index. Measuring multidimensional poverty in India: a new proposal (Oxford Poverty & Human Development Initiative Working Paper No. 15). Welfare Shifts in Post-Apartheid South Africa: A Comprehensive Measurement of Changes (DPRU Working Paper No. 07/128).
Income and non-income inequality in post-apartheid South Africa: What are the drivers and potential policy interventions. Changes in education, employment and income in South Africa – A cluster analysis (SALDRU Working Paper No. 105). Educational attainment and labor market outcomes in South Africa OECD Economics Department Working Papers no. 1022).
Setting weights for aggregate indices: An application to the commitment to development index and human development index. Measuring inequality through asset indices: A general approach with application to South Africa (SALDRU working paper no. 141). Thinking about youth poverty through the lenses of chronic poverty, life course poverty and intergenerational poverty (CPRC Working Paper No. 57).