Murray Leibbrandt acknowledges the Research Chair Initiative of the Department of Science and Technology and National Research Foundation for funding his work as the Research Chair in Poverty and Inequality. We propose the adoption of the methodology of multidimensional poverty measurement in the calculation of an index of multidimensional food insecurity. This framework has become increasingly popular, especially with the introduction of the Multidimensional Poverty Index (MPI).
The claim is that food insecurity, like poverty, is a multidimensional phenomenon that requires the inclusion of several aspects of deprivation in its measurement. Nationally representative data from South Africa are used to construct a Multidimensional Food Insecurity Index (MFII), based on the MPI's methodology. The MFII is used to develop a detailed profile of individual food insecurity in South Africa.
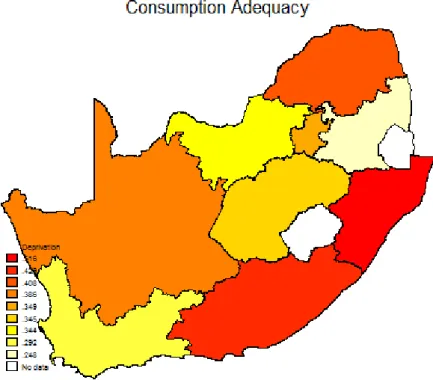
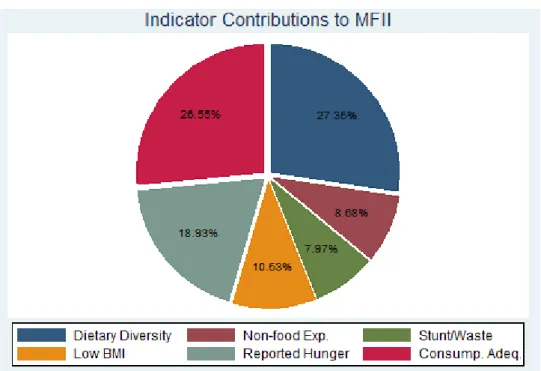
At the national level, close to half of the population is considered multidimensionally food insecure, with the main contributors to food insecurity being dietary diversity and subjective food consumption.
Introduction
While much of this paper is a contribution to the theory of food safety measurement, particularly in the multidimensional framework, the findings are also important for applied food safety analysis. The index is used to develop a detailed food insecurity profile for South Africa, highlighting the indicators and sub-populations of greatest concern. In terms of structure, each section of the paper begins with a discussion of the Alkire-Foster method and some technical details, followed by its application in a food safety context.
The variables selected for the MFII are discussed in some detail, as are the boundaries within the indicators. The trigger pooling procedure is then outlined, including intercepts and cross-reference weights, followed by application to MFII. Decomposition properties of the Alkire-Foster framework are discussed, before a detailed profile of multidimensional food insecurity in South Africa is presented.
Developing the Multidimensional Food Insecurity Index
Dimensions, Indicators and Cut‐offs of the Index
- Data
- The Indicators
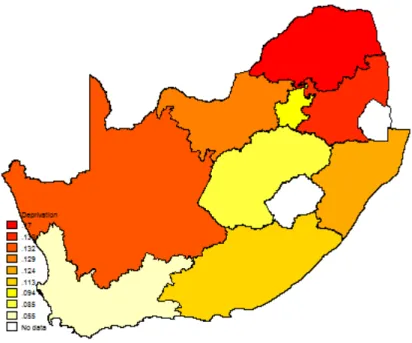
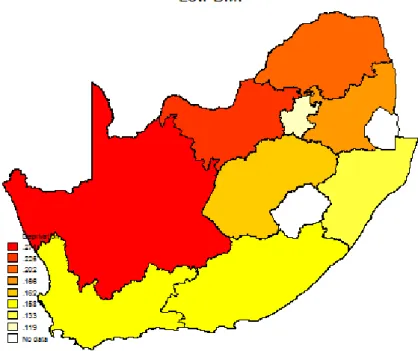
- Deprivation by Indicator Findings
As such, the union method can lead to overestimation of the problem and is not always suitable for identifying the poor. The three dimensions of the MFII are guided by the 'domains' of food security identified by Coates et al (2006)6. Furthermore, these domains include the identifiable 'elements' of the FAO definition of food security as mentioned in the introduction7 (Maxwell et al, 2013).
The Household Food Access Scale (HFIAS) and the Household Diet Diversity Score (HDDS) are surveys that capture different objective components of the concept of food security. The HFIAS measures the component of access to insecure foods, while the HDDS measures dietary diversity in terms of the number of food groups consumed per day (Coates et al, 2007; Swindale & Bilinsky, 2006). One suggestion in the HDDS guide is to take the average diversity of the top tertile of household diversity scores (Swindale & Bilinsky, 2006).
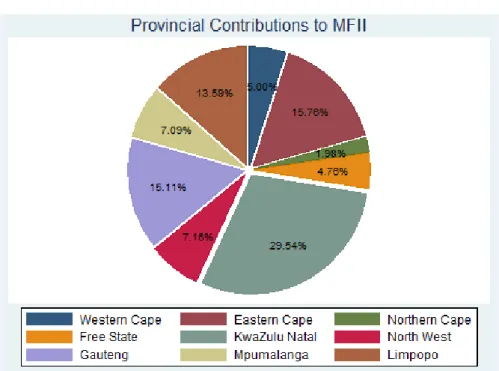
In the NIDS data, 12 households report positive expenditure on food items, while not consuming any of the 12 food groups. 3 of the households reporting positive food expenditure report no consumption of any of the food items listed. The findings of the proportion of the needy in each province are presented with the indicators grouped in the three domains14.
Aggregation of the Indicators into an Index
This censoring means that the overall measure only includes information on the deprivation of the poor, and not those who may be deprived on a single dimension but who do not identify as poor. This is important because information on the deprivations of the non-poor should not influence any measure that focuses on the poor (Alkire & Foster, 2011). The choice of dimensions, weights and cuts are key aspects of the index and require further discussion.
The chosen dimensions and the cut-offs within each are largely guided by the literature, where a general motivation and interpretation can be found for each indicator of interest. In contrast, the cross-dimensional cut-off is less guided by the literature and may rely on a number of points. For example, the minimum number of deprivations required to be considered poor in a specific context, where the cut-off can be set to the minimum level of one, if deprivation on any dimension is considered a gross violation.
It is advised that any choice of cut-off point be tested for robustness (Alkire & Foster, 2009). By defining a measurement based on deprivation scores and simple averages, an equal weight is implicitly assigned to each dimension of the MPI (Alkire & Foster, 2009). The interpretation of the indicators is also made easier by assigning equal, or at least not very different, grades.
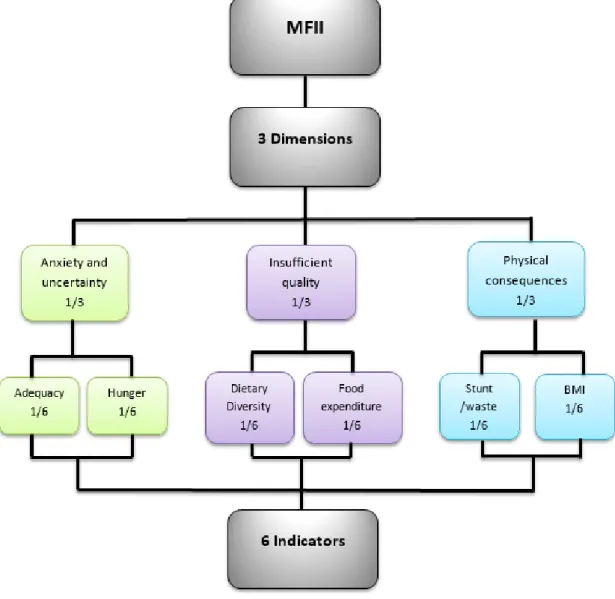
Given that there is no a priori reason to believe otherwise, and for ease of interpretation, each dimension of the MFII is weighted equally and each indicator within the dimensions is also weighted equally. There does not appear to be any indication in the literature that the weights should be different, but as suggested for the weights in the MPI context, these will change as part of robustness checks16. Each indicator has its own cutoff point, which determines whether a household or individual is food insecure to that extent.
The second cut-off, the cross-dimensional cut-off, determines that a person is identified as food insecure if they are deprived in at least one third, or 2 of the 6, weighted indicators. This is again based on the MPI method, and will be varied as part of the robustness tests.
Using the Decomposition Properties of the Index for Food Insecurity Analysis in South Africa 17
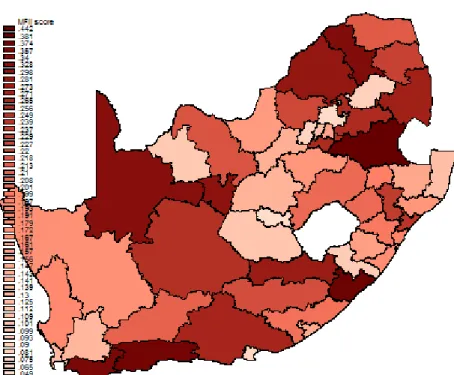
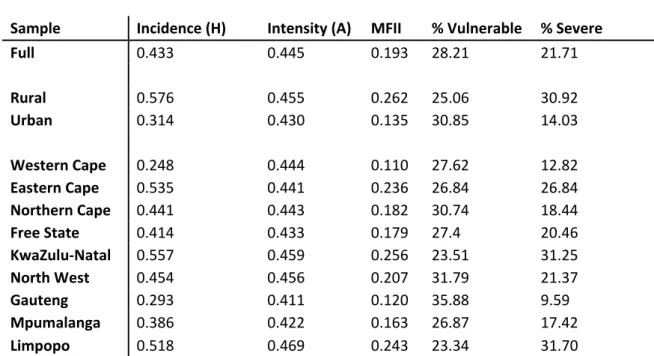
Vulnerable refers to the percentage of the population that is vulnerable to food insecurity and is disadvantaged in 1. Severe refers to the percentage of the population that suffers from severe food insecurity and is disadvantaged in three or more indicators. The incidence of food insecurity in South Africa is 0.433, which means that almost half of the population is multidimensionally food insecure.
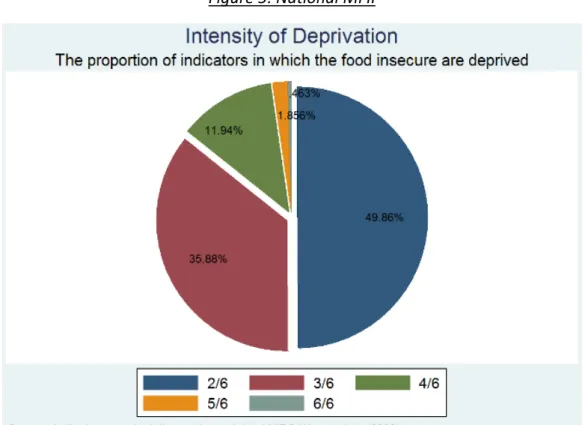
Among the food insecure, the average share of indicators in which they are deficient is 0.445, or between 2 and 3 out of 6 indicators. However, breaking down the measure into different geographical subpopulations and the contributions of the indicators provides a more nuanced picture of the state of food insecurity in South Africa. An additional capability of the MFII is to identify those vulnerable to food insecurity.
Severe food insecurity is defined as a lack of 50% or more of the weighted indicators. The intensity of deprivation experienced by food insecure people can also be explored using the MFII. These patterns are reflected in the proportion of the food insecure for each indicator listed in the appendix.
Most of the MPI debate focuses on the issue of weights and the inherent trade-offs. As part of the robustness checks, the cutoff is increased to 1/2 and this is expected to reduce the MFII scores. The limits for the indoor indicators are closely determined by the literature and as such are less open to user judgment.
The cross-dimensional cut-off value was increased from two to three of the six indicators. At the same time, the intensity, A, of hardship experienced by people experiencing food insecurity has increased. Similarly, the weighting of the anthropometric measurements was increased to 0.5, and the balance allocated equally to the remaining indicators.
As mentioned in the discussion of indicators in section 2.1.3, issues of physical consequences.
Policy Discussion and Conclusion
The extensive robustness checks serve to test the sensitivity of the index to certain user-defined decisions. They also serve to highlight the flexibility of the MFII, and how it can be adapted based on the purposes and context of the study. These concerns are largely alleviated by the methodology and properties of the MFII, where no information about the different dimensions is lost through aggregation.
Furthermore, the degradability of the index facilitates tailored interventions for specific sub-populations, as well as detailed impact evaluation of specific indicators. The degradability property of the index also makes it particularly valuable in setting up targeted household and individual food security policy. The ability to differentiate across many different subgroups of the population allows for a nuanced evaluation that can identify even subtle changes in the level and composition of multidimensional food insecurity.
The food security of beneficiaries and non-beneficiaries can be compared and contrasted in a detailed way that can shed light on the potentially different impact of policies. The sensitivity tests, while addressing some of the criticisms of the methodology, also serve to illustrate the flexibility of the index. It can be adapted depending on motivation, question, context and prior beliefs, while retaining all the properties that make it a useful tool for detailed analysis.
The potential utility of the MFII is similar to that of the MPI in terms of being a single measure that takes into account. multidimensional nature of food insecurity. An additional utility of MFII is that it facilitates the design of policies that directly address the interlocking deprivations of food insecurity. One of the key factors in the creation of this multidimensional measure is that it utilizes existing data and can therefore be applied using different datasets.
In light of this, future waves of NIDS, or even the General Household Survey, could be modified at little cost to include the measurement of the indicators needed to compile the index. This will provide for a thorough examination of the current state of individual food security, the changes therein. phenomenon over time, and the impact of various targeted policies on numerous subgroups in the population. Health: Analysis of the NIDS Wave 1 data set. http://www.nids.uct.ac.za/home/index.php?/Nids‐Documentation/discussion‐papers.html.
The food (in)security impact of land redistribution in South Africa: microeconomic evidence from national data.