~
I
\
,
o
o
SALDRU ·FARM LABOUR CONFERENCE
SEP'I'EI'..mER 1976
Paper No. 8
Capitalist Agriculture : Accumulation and the Labour Supply - The Case of South Africa
Jill Nattrass
Preliminary Draft : No portion of this paper may be quoted without permission of Saldru, School of Econamics,.University of Cape Town.
\
LABOUR SUPPLY THE CASE OF SOUTH AFRICA
by Jill Nattrass ,.
28.7.76
Paper for Presentation at the Conference on Farm Labour in South Africa organised by South African Labour and Development Research Unit to be held in Cape Town 20-24 September, 1976.
C!pitalist Agriculture: Accumulation and the Labour Sqpgly - The Case of South Africa
"The sto{,cal calm wi.th which the political economist contemplates the most shameless violation of the
r
sacred right of property' and the perpetuation of the arudeBt acts ofv1-CJlence against persons (when these things are essential to establish the found- ation-of the capitalist mlfthod of production) can be studied for
instanae~inthe person of Sir F.M.
Eden~
philanthropist "though he be
andtory to boot.
The whole series of
thefts~outrages and tribulat- ions that accompanied the forcible expropriation of the peopZein the period that lasted from the end of the fifteenth century to the end of the eight- eenth lead him only to the comforting conclusion:
'The due proportion between arable land and pasture
hadto be established' Marx-
[2l1P.806-
This quotation stands as a caveat to all who work in the general field of economics and in particular to these who study the role of labour andl~bou~ allo·cati~n: In ; economic--devei.6pmerit~ -- Modern economic methods far from becoming more hUmanistic as a result Qf Marx's strictures have
developed the art of analysing human behaviour without reference to the
-'
human beings _concerned toa high level of sophistication. The methods used in this paper arenq-exception but I would ask all who read it to recall that every labourer who is reallocated either voluntarily or arbitrarily by the-state or by his landlord incurs some personal
sacrificeswhichmay~ormay not be adequately compen.aated and that under every capital labour ratio or output per worker lurks a 'human being' who may be enjoying less rather than more job satisfaction.
The Econ<t1tlic-~ackdrop
I
E
I
Economic development theori.es, that have been designed as a starting
1
point in the explanation of the emergence of a capital using sector from a (1) My thanks are due~to my colleagues Alec Erwin and Nigel Morris,
who _commented Qn an earlier draft of this paper. The I flights of fancy' and the errors and omissions, however, I achieved without their assistance!
sector that was previously almost totally concerned with subsistence economic activities, are usually based on the assumption that the economy
. /
is a two sector or dual economy, the two sectors being variously described as: capital and subsistence, Lewis (19); agrarian and industrialist, Fei and Ranis [10] and capitalist and.precapitalist, Legassick [18],
Kaplan [16]~ However, the latter authors stress the nature of the links at the interface between.the sectorsrather.than the dual nature. of the economy.
The nature of the starting point of the development process ensures that agriculture, in particular subsistence agriculture, must playa crucial role in economic development. This role is a two-pronged one in that the sector is seen as the major source of supply of both labour, as anlnput . in the production process in the capitalist sector and the major portion of the supply of· wage goods in the economy, namely food.
The critical nature of the role of agriculture in promoting sustained economic growth is highlighted by the fact that all the current theories of de..elopment, no matter whether they start from a position 'of unemploy- ment, Lewis [19], or from the assumption of full employment, Jorgensen [15], or whether they predict growth with decreasing economic stratification and unemployment, Lewis [19] ,'Jorgensen [15], or growth with increasing
unemployment and widening degrees of economic differentiation, Arrighi [I], Legassick [18], predict that sustained economic development is only
possible when labour productivity levels in the agricultural sector rise continuously. If output per worker in agriculture fails to expand adequately, then in order to maintain the supply of food, the supply of labour from the sector starts to dry up. On the other hand if labour continues to flow out of the sector in the absence of increased labour productivity, the supply of food becomes insufficient to meet the
increased demand for food and food prices start to rise. Rising food prices will push up the wage'rate in the non-agricultural sector expressed
in terms of that sector's output; no matter whether the economy is
developing with or without surplus labour. Increased wage rates will most likely reduce the level 6f profit and so the rate of expansion of the
non-agricultural s~ctor. Since the overall development of an economy depends in the long run on the successful establishment of a non-.
- 3 -
agricultural sector, Kuznets [17]1 this will retard the growth of the economy as
a
whole.A natural corollary of these simple models but one that is seldom spelled out, other than by the Nee-Marxian development school, is that the rate of growth of the modern sector can be increased substantially by the impl,ementation of policies that are designed to dichotomise the source of supply of food and the source of supply of labour. This dichotomisation may be achieved by a number of methods, and the-actual means used will be a
result of both the outcome of the struggle between the various power blocks in the society and the structural limitations within which this struggle takes place. One possibility lies in the production of goods for export by the non-agricultural sector which are then exchanged for wage good imports. The nature of the international market is such, however, that this is not a good long- term strategy. An alternative str~tegy
is one that is based upon the internal dichotomisation of the agricultUral sector establishing one po~tion.of the sector as a capitalist agricultUral
sec~or, using modern capital intensive methods of production and enjoying ~
high levels of labour productivity whose object is to provide a stable
,
and cheap source of wage goods and agricultural inputs for the non- agricultural sector, whilst leaving the remainder of the sector to operate within its pre~capitalistmode of production.
Once a capitalistic agricultural sector has been established then the natural market processes can be strengthened by the actions of policy makers that intensifies the degree of differentiation. Measures can be taken on the one ha.ndthat ensure a l';'~gular supply of foodstuffs to the modern sector from the capital-using modern farms and on the other that ensure the maintenance of a supply of labour to the modern sector by means of increasing the degree of dependency of the pre-capitalist sector on the modern sector until the former degenerates to the point where it is a simple labOur reservoir for the latter.
The path of economic -development in South Afr'ica is often advanced
as an example of accelerated growth resulting from the application of this corollary. Legassick [18], Williams [31], Rex [25] and Kaplan [16]
all see the African Reserve areas as labour reservoirs and the development of capitalist agriculture as one of the major means by which capitalists
increase the rate of surplus value earned in the capitalist sector.
Whilst the present paper.agrees with the general tenor of these presentations it will argue that this dichotomisation is in fact too clear cut to
describe adequately the nature of South Africa's economic development.
The distribution of the. African population between White farms and African Reserve areas was such that even as early as 1916 it was inevitable that the capitalist farms themselves must play a crucial role as labour
SUppliers to the remainder of the capitalist sector of the economy.
In the early days of the development of capitalism in South Africa the food requirements· of the emerging modern sector were niet by the marketed surplus of both.Black and White farmers Bundy [5]. However, .the rocketing costs of living in Johannesburg bear witness to the fact
that this supply of food was totally inadequate. (2) In addition,
when considering the Black farmers, there was the problem, as far as the modern sector was concerned, that the development of a successful Black
commercial farming sector might make substantial inroads into the available supply of Black labour to the rest of the .;::apitalist sector:
~ sector already perennially short of labour.
At this time there was also a certain amount of evidence beginning to accumulate which suggested that in fact the Black peasant farmers appeared to be adapting more quickly than their White counterparts to the improved and extended market opportunities. Bundy [5] quotes from a letter written to a Cape newspaper by a traveller in the Glen Gray
(2) See for example the comparative living costs quoted in the Report of the Commission of Inquiry into the Conditions of Trade and
Industry [32] which reported in 1912.
- 5 -
district in 1880 who said:
'man
for man the Kaffirs of these parts are better farmers than the Europeans, more carefuZ of their stock, au Ztivating a Zarger area ofZand and working .themse l:ves more assiduous Zy. "
P.3?? •
These f'actors in a situation,wpere political power was the preserve of the White led to an inevitable outcome; State action
designed to pr9vide a long-term solution, to the problems of establishing adequate supplies of both foodstuffs and labour to the modern economy whilst at the same time preserving the power structure represented by the dominant classallianc;::es in the conununity that maintained the State itself in that particu~c:-rmanifestation .. The long run solution that was sought to these problems was" therefore" sought wi thin the overall framework of the maintenance of White domination in the field of agricultural and non-agricultural capital and of the ~lite portion of the labour supply. It was aimed at e~tablishing the successful dichotomisation of the food and labour supplying sector into one
sector providing food and one providing labour: White agriculture and the African Reserves, To this end South African economic development has taken place to the accompaniment of a barrage of
state activity both at the. legislative and administrative levels designed to limit African's access. to land and to foster the development of a '. viable 'capital~using agricultural sector predominantly owned by Whites .
. Although the State in South, Africa has had a long history of
taking an active part in. attempts to establish an adequate labour supply, (3)
p~rticularly in the period after the establishment of the gold mining industry, (4) it is interesting to note that until v.ery recently, very little official pressure had ?een placeq on White farmers to reduce their labour supply. This is despite the f~ct that when one looks at the early distribution of the African rural population it becomes
immediately apparent that only a relatively small proportion of the African population was in fact resident in the reserve areas. The
(3 ) Government efforts to generate labour supplies in the pre-Union
States are well documented by S.T. van der Horst [ 27]
(4) Jeeves (13).
•
Beaumont Land comm~ssi~n [33] estimated that in 1916 only 55 per cent of the African population were resident in the African reserve areas, by 1936 this perc.entage had decliried slightly to 52 per cent including the temporary. migrants.
This population distribution meant that the cornerstone upon which the attempted dichotomisation was ,built; the legislation which
restricted African access to land/such as the anti-squatting legis- lation that was passed in the early states and the Union government's Land Act of 1913, whilst it was certainly successful in establishing potential labour reservoirs, was not 'as apparently successful in fillingthe1'(lwith resettled'labour. Indeed, in a situatibnwhere . farmers are politically powerful; where the need to establish a
-
supply of food is critical to the development of the rest of the' capitalist sector; and farmers traditionally use labour intensive
techniques of production, then as long as the expansion of the rest of the economy is not be~nghindered by an overall shortage of labour, it would seem that a sensible strategy would be one that allowed
surplus labour to rernainoll the farms and concentrated upon
implementing policies aimed at improvihgagricu1tura1 output levels.
As far as the rest of the infant capitalistic sector of the South Afric;:an economy was concerned, it appears that in the early stages of , . . . " '
the Union's development the flow of labour,from the established reserve areas when coupled with temporary migration from the White farms, which was a feature of the labour tenancy system i n many
areas, ~."hen taken together with a substantial inflow of foreign migrants indeed sufficient to meet the labour requirements of the growing
capitalist sector, both in terms of the number of labourers
available and in terms of the price placed on their labour. As long as this remained so, there would be little reason for the state to pressurise capitalist farmers to release a portion of their large potential labour supply. However, once the supply from these other sources was no longer adequate in terms of numbers or too costry in
was
- 7 -
terms of wage goods, then it follows that continued expansion of the capitalist non-agricultural sector wouldfbecome contingent upon the successful' rationalisation of agriculture; WhiCh in turn would result in capitalist a:griculture expelling the now redundant labour from the sector. Consequently, one would expect that tbe overall'thrust of the State's activities would accordingly alter should the non-
agricultural modern sector show signs of becoming short of labour either in tenns of the number of men available 6r in tenns of
a
rapid increase in the cost of ,labour to the sector. (5)Capitalist agriculture in South Africa has been a net absorber of labour, in ~the capitalist sector until ,relatively recent-times. However, there is at present an increasing flow of people out of the modern agri- cultural sector both ,as a result of the push forces exerted by the in- creased levels of capitalisation ~n the sector and the pull forces of the rising wage,levels in.the remainder of the capitalist secto
7
whichare themselves an, iI!dication that the sector.is beginning to approach
, (6)
a situation of labour shortage. Consequent upon this there appears to be signs of.achange'in,the ,government's attitude towards the
, "
existing capitalist farm labour supply i f one accepts the recoriunendation of the Commission of Inquiry into Agriculture [37] as being represent- ative of the 'official outlook.
(5) .Labour can be extracted from agriculture in a variety of ways:
by market forces'either ,on the'food supply side leading to capitalisation in agriculture and a consequent reduction in the demand for labour; or.on the labour supply side as rising non- agricultural wages draw men off the land forcing the fanners to mechanisei or by direct state action designed to force some degree of labour l;"e-allocation.
(6) The average African money wage in the manufacturing sector'has risen at an average annual compound rate of 8,5 per cent over the fifteen year period 1960-1975 [55]. 'In addition when one remembers that tbe district studies of the levels of temporary outmigration of men from th~ rural areas of the African homelands show an average rate of out migration of over 70 per cent, one must seriously question the ability of such areas to supply increasing quantities of labour to the modern sector of the South African economy.
In any event, in the long run in an economic development situation one expects the proportion of the labour force employed
in agriculture to decline firstly in relative terms and finally in absolute terms, Kuznets [17] Dovring [8]. It is therefore obvious that
eventually the capitalist ·farming sector itself must play .a substantial role asalabour supplier and that ~onsequently it is an over-
simplification to see the capitalist farming sector simply as a major absorber of labour.
The Development of Capitalist Agriculture in South Africa
State assistance to agriculture is certainly not simply a modern South African phenomenon, but as Wilson [28] points out:
"The establishment of the Land Bank in
19l2had marked the beginning of a new stage in the farmer's approach to the State •.•••..•
henceforth the farmers were to lookinarease- ingly to the State to solve their problems."
P. l36.
Further evidence of the growth of the feeling that it was the role of the State to stabilise the suppiy of foodstuffs comes from the Report of the Commission on Trade and Industries [32] which
emphasised in 1912 that:
"The success of a country depends primarily on its agricu Uura
ldeve lopmen
tand. un ti
lthis is brought about industrial expansion will be retarded. P. 95-96.
Frankel [11] estimated that over the period 1910-1936 State assistance to White agriculture was in excess of Rl13 million which as Kaplan [16] points out is almost the exact equivalent of the total government receipts from mining taxation - and is some indication of the overall degree of importance attached by all sectors of the expanding South African economy to the need to establish a viable modern agricultural sector. Horwitz [12] also comments
.'
"
- 9 -
"the stream of LegisLative and administrative effort.to
pLaa.e men. uppn ,the'
Land~toconserve water and financewaterconservation.l to conquer . erwironmentaZ and entom:; logical, ad:iJersity.l to
provide co-operative marketing.l was in principLe 8uppor>ted ,by most White. men. They vot.ed for it as the apparentLy Logical, pursuit of secUring
the future of .the White man in South Africa.
P.1,30 •.
. Despite continual state assistance and the acceptance of .. the development of White South African agricuiture as a conunon goal cunongst the electorate, the rationalisation of White agriculture has pr~ved an extr.emelydiffic\l~ta~d time ~onsuming task. Table.
1 contains data, which show the' progress that has been made over the
" " } . , 'J
period.
Selected. Performance Indicatoll; in Capitalist Agriculture 1921-1973
indices (Including Casual
1 f &nployment Labour) Index of Capital
OUtput . Index of Physical 1960 - 100 Capital per Man
per Man Stock
Capital I
Output Ratio
Volume of' (Constant
Year Current output Total (Constant 1963 Prices) (Curren~
Prices 195.8-60 -100 Employ- Whites I Coloured Asians Africans 1963 Prices) Prices)
Rands mente ~ e 1960 = 100 Rands Rands
(1) (2) (3) (3) , (3)
(3) (3) (4) (5) (6)
. i ,
1921 108 30 42 143 59 168 29
,
1936 112 46 63 153 73 158 52
1946 252 53 71 142 77 117 62 52 653 1.6
1951 619 73 82 123 76 109 77 75 812 1.3
1960 794 99 100 100 100 100 100 100 895 1.6
1971 1 298 144 109 83 98 59 110 128 1 054 1.8
1973 1 629 138 98 76 98 54 98 144 1 317 1.9
,6 21/73 5.4, p.a. 2.9 21/71
-1. 2 -2.2 21/71
3.82 2.7
,6 46/73 7.2' p.a. 3.6 46/71
-2.3 -2.8 46/71 3.8. 2.6
. 1. 7 2.3
(1) output'frol\l South African Statistics 1974 [53].' Employment<frol\l Union Statistics for 50 years f~r 1921-1951. [511 South African Statistics 1974 [53] for 1960 and 1971, and for 1973 Agricultural Census ~972-73 [44].
(2) FrOl\l South African Statistics 1974 1531 P. 94.
(3) E9tillla~frol\l'data'obtained frOl\l the following" sources. 1921-1951 Union Statistics for 50 years [51]. 1960 and 1971 South African· Statistics 1974 [53]: and 1973 Agricultural Census No. 46 [39].
(4) Estilllated from data obtained. from .the following sources.1921-1946 .. Relnderscommission of Enquiry into Cost and
~x:ofit Margins on Agricu~tura1 Implements [351; 1946-1972/de.Jager I I i 1973 has been obtained by adding new investment in II\Iprovements, Vehicles and Implements 1972/73 to de Jager's estimate for 1973, from Agricultural Census No. 46. [39)
(5) Capital as per note 4. Employment as per note 3.
(6) Cepita1 as per note 4. output from South African Statistics, 1974 [53].
! I
4
\ i
~n
I I
I
I I
~
I
II ~,
Some interesting conclusions can be drawn from.the data in Table 1. Firstly, so far as the growth of real output 'in ca?italist agri- culture is concerried the performance has been steady but not
scintillating. Population growth levels in South Africa over the period 1921-1970, averaged 2,33 per cent per annum (7) and the rate of growth of the number of economically active persons not employed in agriculture grew at an annual average rate of growth of 3,2 per
(8 )
cent over the same period. Given this data it is apparent that the growth of agricultural output was more than adequate to sustain the level of consumption of domestic food per head that existed in· 1921 in the face of an expanding population. If however average consumption levels in either or both of the agricultural sectors' of the economy increased as labour was transferred· to the modern sector then it is quite possible that the supply of marketed surplus would no longer be adequate.
In addition, in a growth situation average per, capita incomes should be increasing and when such incomes increase from low
absolute levels the income elasticity for food products is likely to be high. Taking this into account, then, suppose for the sake of illustration that the size of the market in terms of people is, growing at an average annual rate of 3 per cent and incomes at an average annual rate of 2 per cent, and if the average income elasticity of food is 0,6, ,food supplies must grow at an average annual rate of 4,2 per cent simply in order to prevent an increase in food prices resulting from the normal working of the market mechanisms. It seems/ therefore/ from these considerations that despite the long and sustained efforts of the State to develop tne capitalist agricultural sector, it is quite possible that an adequate and stable supply of agricultural goods has still. n,ot been established,"
although undoubtably the situation is considerablyim:proved in terms of the circumstances prevailing in the early 1920is.
(7) South African Statistics 1974 [54].
(8) Growth rate estimated from data in Union Statistics for Fifty Years [51], and Monthly Bulletin of Statistics, December 1975 [55]
..
- 11 ...
Looking at the 'data in Table 1 it becomes apparent that the rate of economic transformation in agriculture has been very slow.
Although the capital stock in the agricultural sector, measured in constant prices grew over the period 1946-1971 at an average rate of 3,7 percent per annum, capital per man grew very much more slowly' at 1,9 per cent. This implies that either the sector was very slow to release labour no'longer required by the new techniques, or; and probably more likely, that, a good deal of the new capital was applied to capital widening rather than to the adoption of new techniqUes.
This latter view is supported by the fact that the capital output ratio remained remarkably constant over this time. Capital
accumulation in agricultUre up to 1971 was, therefore, apparently used on a substantial scale to augment the labour supply of the sector rather than to replace' it.(9) There are signs, however that the
situation is beginning to change. In the two years 1971 to 1973, the capital stock grew rapidly, and employment in the sector fell,
resulting in a substantial increase in the average capital labour ratio •
. ,
OUtput in physical terms however, fell over this period, so it is possible 'that these changes may not be permanent.
When one considers the employment variables more clos,ely one can see that members of both the White and the Asian race groups have been seeking work in increasing numbers outside agriculture, and that up to 1971 their absence was more than replaced by the employment of increasing numbers of African' 'and Coloured labourers: However, even though employment levels in agriculture have risen on aver~ge over the period, particularly that of Africans, this does not necessarily mean' that South African economic development has taken place without the wholesale evictions' and transfers of population that have been a feature of the capitalisation of agriculture in other countries.
In this'i-espect one should note 'that agricultural employment over the period 1946 to 1973 grew considerably more slow,ly than did the
(9) The high degree of aggregation in'this data may well, however, conceal some of the nature of the transformation.
~
I IAfrican rural population. Consequently when one recalls the
relative size of the farm popula.tion in 1936, this implies either that there is heavy rural unemployment or a significant level of out-
migration from agriculture. In addition, as the markets for
agricultural products develop so the farmers have every incentive to evict squatter or family labour groups and to replace them by a less land intensive wage labour system. This transformation also
implies substantial outmigration from agriculture. These possibilities will be discussed in more detail in the following
sections of the paper.
Population Movements in the Capitalist Agricultural Sector 1921-1973 Economic development i~capitalist agriculture in South Africa has'led to the development· of two distinct streams of outmigrants from the sector: those migrating with their families and leaving the sector permanently to settle either in the growing urban areas or in the African reserve areas; and those, historically laboUr tenants, who are temporary migrants seeking work. outside the sector for a
period of time, but who leave their families resident on the farms during their absence. Permanent outmigrants are found from all four race groups whilst the temporary migrants come ,exclusively from the African groups in the society.
Permanent Labour Migration from Capitalist Agriculture
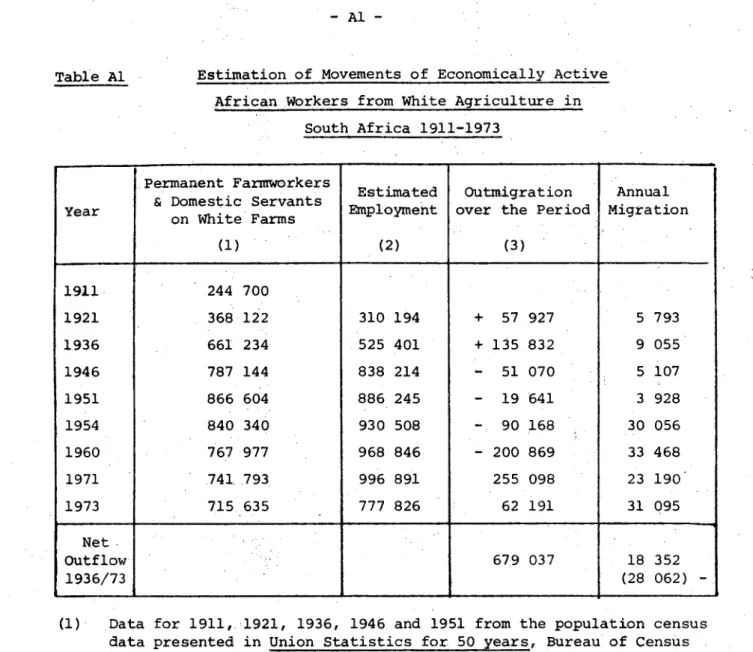
Using the population growth rates it is possible to estimate the extent of the net outflow of economically active people from.
agriculture. If one compounds the number, of people employed at one period forward to the next period at the population growth rate and then. deducts the actual level of employment in the .second period, the difference will be an estimate of the impact of migration on the sector's labour supply (10) Table 2 contains estimates made on this basis from all four of South Africa's major race groups for the period 1921-1973.
(10) This method will not yield an estimate of the actual count since natural increases are included in the calculation -hence the use of the word 'impact'-rather than absolute level.
I
i
- 13 -
Labour Movements on White Farms 1911-1973 (1) (2) (3)
, , Movements of Labour in Agriculture
White Ceiloured Asiatic (" . African Migration
Year
,Migration Migration Migration
At 2.4'" Mean Pop- At Actual population
, .', ,
'u1ation Rate Growth Rates
In OUt In OUt In Out In out In OUt
0 '
1911
1921 '57 900 B1 300
1936 4() 400 1.1 700 10 BOO 135 BOO 143 500
1946 50 200 2B 100 10 500 51000 5 000
1951 3B 000 10 300 2 600 B7 000 97100
1960 52 500 3 900 4 500 61 300 29 200
1971 43 BOO. 42,000 B 200 252 200 437 600
1973 14 900 25 700 1 700 219 400 24B 100
Total 239 BOO 3 900 123 BOO 383 000 342 000 522 600 355 100 6B5 700
"
.
'These estimates have been obtained by means of compounding the number of individuals employed on white farms on the cenlils ,dates, to the following census date at the average popu1at;!.on qroWth ,rate feir the race group over 'the period 1936'-1970. The actual number of people employed on the Census
I
,
I I I
I !
i'date·was·thensubtracted.from this estimate and the difference recorded as· an inflow or outflow. e.g.
'Migration of African to White farm 1936 = Employment 1921 (1+.024)15.;. Actual Employment 1936 135 BO.O infiow= 368 122 (1+.024)15 - 661234. An example of these estimations for the African population is qivenin Table A I' in ,the Appendix. The grOWth rates used were White 1,B5"'"
Coloured 2.711s, Asian 2. 711s, African 2.4."'. ,These rates were obtained. from South, African Statistics 1974 Department of Statistics, Pretoria, 1975. ,I53]
(2) ~ estim&tes were made for the African populatioll'One using the mean population growth rate of 2.4 pe,rce!lt per annum and asecondu~ing the actual . .{nnual compound growth rat~s between the. different census years name1y19~1-362.3"';36/46 1. "'" 1946/51 1.B", 1951/60 2.7"; 1960/71 3.4"'; 1971/73 3.4'"
Rates l;rom South ~rican Statistics 1974, Department of Statistics, Pretoria 1975. IS3J
(3) Data on which these estimates have been based have,been obtained from the following sources; 1911, 1921, 1936, .1946 and 1951 from the population census data contained in Union Statistics for, 50 years, Bureau of, Census and Statistics, Pretoria;I51jl960, 1971 and 1973 from Aqricultural Census Numbers 34, 44 and
~, Department of Statistics, Pretoria, Deceaber 1962, OCtober 1974 .and July 1975. (42) [43) [44].
The
White Race GroupsAs far as members of the Whi~e,race groups are concerned it appears ,that the number of Whites employed in agr~culture increased ,between 1921 a~d 1936, and then declined continuously. ,The overall
decrease has taken place at an annual average compound rate of 1,5 per cent. This means that if one takes into account the natural rate of increase of the White population of 1,8 per cent over the period
19~1-1970'(1l)
economicaliy~ctive
Whites have been flowing out ofi I
I I
(11) South African Statistics 1974, [53] . I
•
I
capitalist agriculture at an annual rate of 3,3 per cent. This rate of outflow implies that by 1973 24 per cent of the White
economically active population outside agriculture had originated in White agriculture, or were first generation descendants of people who themselves originated in agriculture in the period 1921-1973.
Considering the movements of the population as a.whole, rather than simply the economically active members of the population, the total number of Whites. who left the agriculture during this fifty year period was of the order of 978 000. In other words for every
economically active person who left, two dependants migrated as well.
Coloured OUtmigration
As far as the Coloured conununity is concerned the absolute level of Coloured emp·16yment. in the capitalist agricultural sector rose continuously from 1921 to 1960, when it started to fall. . Despite the overall increased levels of employment there was a considerable outflow of economically active Coloured people during the period, which amounted to 33 per ·cent of the economically abtive Coloured employed outside agriculture if one adjusts for. continued population increase. The rate·of outmigrationof C~loureds increased substant~
ially over the period 60/70 to an average of 4 200 persons per year, . . , and then rose dramatically again, actually doubling to 8 650 persons per year for the period 1971 to 1973. These movements probably m,irror the demand for Coloured labour outside agriculture. As the shortage of White labour became increasingly critical, so the opportunities outside agriculture for both the Coloured and the Asian race groups increased substantially, attracting workers from the farms.
support this contention is given in Table 6 in this paper.
Asian OUtmigration
Data to
When one remembers the origin of the Asian race in South Africa as indentured labour on the Natal sugar farms it is ironical to·
observe t~t during the period studied here the Asians migrated out of agriculture on a far larger scale in relative terms than the other
, i
- 15 ....;
three race groups. This occurred to the extent, in fact, that by 1973 there were only 6 281 people of Asian descent who were employed in agriculture and of those one third were in fact farmers in their own right.
The average annual rate of outrnigration from capitalist
agriculture by Asians over the period 1921-1973 was 5 per cent; 2,7 per cent being natural increase and 2,3 per'cent the ,rate of absolute dimunition. Once again if one breaks the time period up into shorter periods one can see that there has been a rapid increase in the rate of outrnigration in recent years. Over the thirty-nine year period 1921-1960 the average rate of outmigration was in fact less than 5 per cent but it accelerated to 7,per cent over the following thirteen years 1969-1973 and reached 8 p~r cent betweeri 1971 and 1973. Once again most likely, reflecting the growth of job opportunities for Asians outside agriculture.
AfricanOutmigration
Estimatesofperrnanent labour movements amongst the Africans employed 'in modern agriculture are complicated by the fact'that there are large numbers of African temporary migrants moving in and out of the sector. To the extent that there is net in or out. temporary migration the estimates of the change in the labour supply given' in Table 2 will over or understate the degree of permanent labour migration. I t was only possible to estimate the extent of the overall temporary flows for 1970 and the effect of these will be discussed below.
The African population group is the only group which provided an increased supply of labour to the agricultural sector over the period. From 1921 to 1960 there was a net inflow of African labour when the estimations are made with the actual intercensal population rtrowth rates. (12) (13) ~ Th e a so u e n b I t urnb ers 0 ' f perrnanen t Af· r~can '
(12) South African Statistics,1974. [53]
(13) Estimates based on the mean growth rate for the period however showed a net outrnigration of labour from agriculture for the period 1936-1946.
J
I
I
I
I
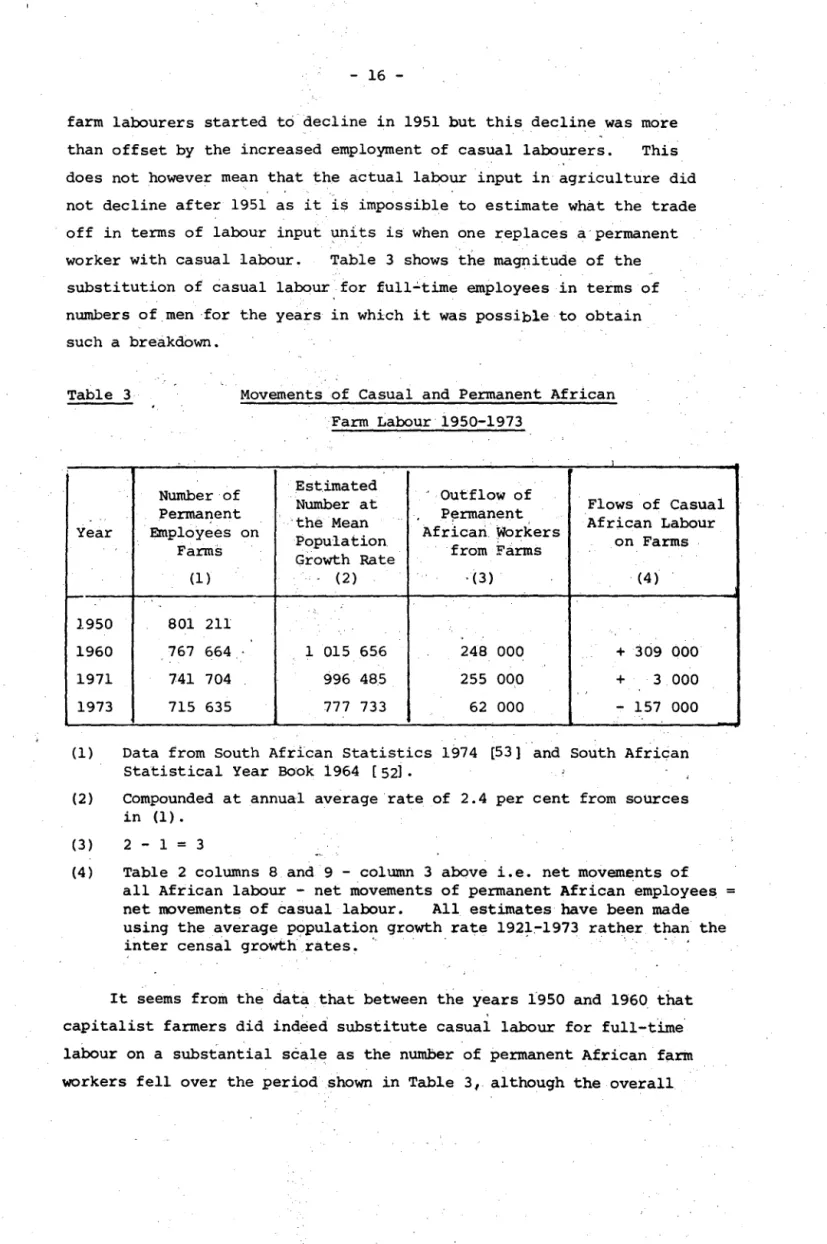
1-farm labourers started to decline in 1951 but this decline was more than offset by the increased employment of casual labourers. This does not however mean that the actual labour input in agriculture did not decline after 1951 as it is impossible to estimate what the trade off in terms of labour input units is when one replaces a'permanent worker with casual labour. Table 3 shows the magnitude of the substitution of casual labour for full~time employees in terms of numbers of men for the years in which it was possible to obtain such a breakdown.
Table 3 Movements of Casual and Permanent African Farm Labour 1950-1973
Number of Est.imated .,
outflow of
Number at Flows of Casual
PermaJ?ent ·the ·Mean P~rmanent African Labour Year Employees on
Population Africari Workers
on Farms Farms
Growth Rate from Farms
(1 ) ... (2) ·(3 ) (4 )
10- . ,
..
1950 801 211
1960 767 664 1 015 656 248 000 + 309 000
1971 741 704 996 485 255 000 + 3 000
, ,
1973 715 635 777 733 62 000
-
157 000(1) Data from South African Statistics 1974 [53] and South African Statistical Year Book 1964 [52].
(2) (3)
(4 )
Compounded at annual average·rate of 2.4 per cent from sources in (1).
2 - 1 = 3
Table 2 columns 8 and 9 - column 3 above i.e. net movements of all African labour - net movements of permanent African employees
=
net movements of casual labour. All estimates have been made using the average population growth rate 1921:-1973 rather than the inter censal growth' rates. " . .
It seems from the data that between the years 1950 and 1960 that capitalist farmers did ind~ed substitute casual labour for full-time' labour on a substantial scale as the number of permanent African farm workers fell over the period shown in Table 3, although the overall
- 17 -
" '
level of African farm"employment rose up to'197t-. What is not clear however, is whether this substl. tution was done from choice or forced upon the farmer by an overall' shortage of permanent employers - this
."
distinction could well be crucial as in the first instance the use of casual labOur may well represent an improvement in overall'allocation of labour resources, whereas in the 'second case it is quite likely that the use of an increased proportion'of casual labour represents' an
It is apparent from the data in the Table that farmers either found it i~creasingly difficult' or increa'singly unprofitable to continue to substitute casual fabour for permanent workers in the
,C."
years subsequent to 1960. -The period. 1960 to 1971 showed effectively no substitution and in. the two year period 1971 to,1973,
.
a sub.stantially great'er reduct,ion took place in the casual labour force than occurred~ i'
in the permanent African ,work force. 'This change in the pa:tterns of the ~mployment behaviour of the capitalist farmers could be indicative of an 'emerging trend towards the rationalisation and capitali!?ation'of the sector particularly when one recalls that the period'1960 to
1970 saw an increase in the capital labour ratio in the sector and a ' very substantial further increase in the ratio took place in the two yep.r period 1971-1,973., More: sophisticated techniques of production
offer a greater potential,benefit from the process of 'learning by doing'.
This in turn implies that the labo~r force must be stabilised since a high labour ,turnove,r mitigates against, the learning pr<?cess .•
It has also been argued that in recent years the capitalist
~aritiing sector has relied increa'singly upon migrant labourers rather
. . . ;1-', 1 ..
than upon' a'settled work force as tneir main supply of permanent WOrkers quite ap~rt from the use made of casual labour in particular seasons: Wilson [29]. Even outmigration on the scale that it has ,taken, place is ~ot sufficient to support Wi,lson' s contention unequi-
v?cally. In 19~6, 33 pe;r cent of the African population was
permanently resident on farms owned by Whites, whilst ,16 per cent of the . ' . ~': ~ ' , ' ,
f'
economically active Africans were employed in capitalist agriculture. (14) Sheila van der Horst [ 27] states that:
"In the year L936-7 nearLy
588000
01'oVer 89 per aent of the
658000 reguLar farm workers were resident on the·farms on whiah they were errrp Loyed."
P. 287.Taken together, these two sets of data suggest that in 1936 there (15) . was a substantial 'surplus population' on the White farms~
By 1960, the latest year for which such data were available, the percentage Cif Africanspermane~tly·resident upon White farms had
decreased to 20 per cent, whilst the size of the permanent agricultural
labq~tforce had grown. This evidence may be indicative .of a switch to:migrant labour on the White farms or on ·the .other hand may simply reflect the eviction of the surplus farm families.
The problem is furthercomplicatedby'the flow of temporary migrants in and out of capitalist· agriculture. . This flow will be discussed later in more detail but pertinent to this argument is the
fact that migration patterns are geographically differentiated.
Historically there are agricultural regions such as the fruit growing areas of the Cape and the sugar plantations of Natal that have
employed migrant workers ·for a long period of time. Similarly there
,
are areas, notably the North Eastern Cape and Northern and North
Western Natal, that have been sources of the supply of outmigrants for the whole of the twentieth century. It will be shown later that once these trends are taken into account Wilson's assertions are substantiated.
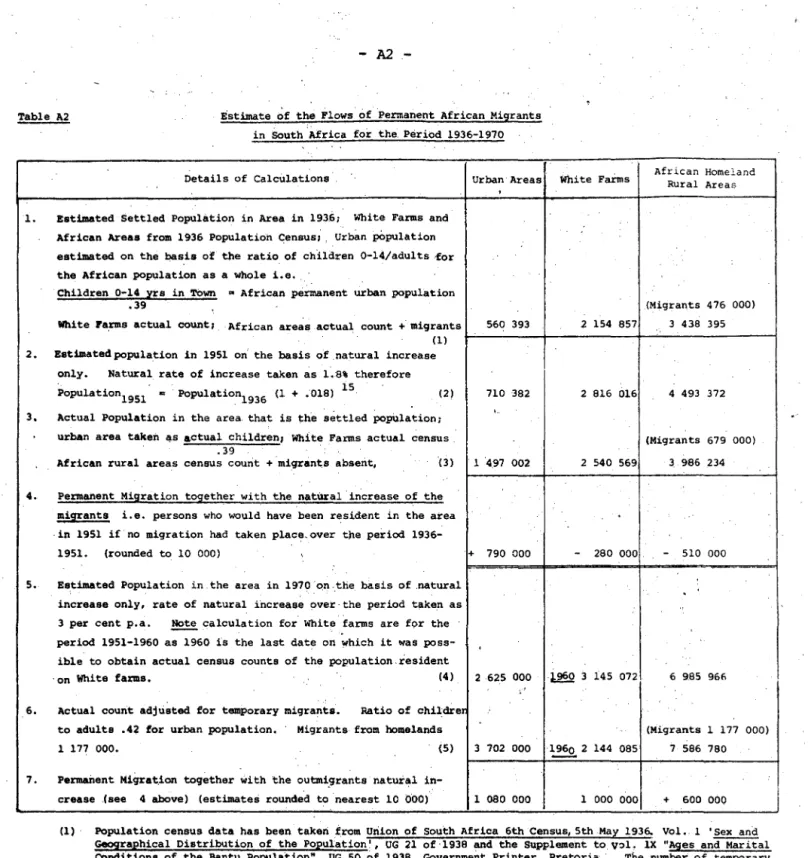
African Permanent POPlllation.Movements1936-1970
In an attempt to place the Airican farm labour supply within the total picture of the African labour supply some overall estimates of
(14) 1936 Census Report. [451'
(15) Surplus by,virtue of the fact that the White farms provided ..
residential rights to Africans who were not providing labour on the farm.
- 19 -
permanent population movements wer.e made. The detailed estimates are contained in Table A4.in the Appendix and the overall results are sununarised below in Table 4.
Table 4
Areas
White Farms '
..
and Ru;ral (2) Areas
African Rural Areas
Urban Areas
.
African Population Movements between 1936 and 1951
andbetwee~
1951 and 1970, (1))
1936-~ 1951 1951 - 1970
:
Net Inflow 'Net Outflow Net Inflow Net Outflow, 51/60 1 ,000 000
280 000 60/70
680 000
..-:---....
510 000 600 000
790 000 1 080 000
7.9.0 000 790 000 1 680 000 1 680 000 (1) Source data is listed in' Table A2 in
the'
Apl?endix and' in thenotes on the Table.
(2) Outmigration from' White farms for the'per.iod 1960-1970 has been obtained as a balancing figure only as no data on the size of the African farm populations could be obtained for 1970. Independent estimations were made for the period 1936-1951 for ali three areas however ~ , "
,It was not possible to allocate migrant workers between White farms and 'rural homelands for any year other than 1970 on anything other than an entirely' arbitrary basis. The estimations in Table 4 are therefore based on
the
assumption that all temporary migrants came from the African rural arEaas in the years 1936, '1951 and 1960. If, in fact there was 'substantial net temporary outmigration from the capitalist agricultural sectors in those years this assumption w,ill lead to an over-estimation ,of the extent of ,the permanent outmigration from modern agriculture and an under-estimation of the leve:1of out.- migration from the, African rural areas for those years.ever, not be affected. '
1970 'will how-
_ . ,
~
I
/
Subject to the above caveat it seems that the thirty-four year period was a period which saw a substantial resettlement of the African population. In the ear~y period, the end of which corresponds
roughly with the imposition of influx control by the Nationalist government, the African population was moving slowly to the towns.
In the 15 year period 1936 to 1951 the urban African population,grew by almost 800 000 people as a result of outmigration from both White farms and the African rural. areas, but it is interesting to note that the outflow from the African areas was slightly faster than that from White farms over this period.
In the period 1951-1970 however, the general picture altered
drastically. During these 19 years more than 1,5 million Africans left the capitalist .farming sector. One million Africans became permanent residents in the urban areas of·South Africa and nearly 700 000 were resettled in the rural areas of the African homelands. A population movement of such magnitude is likely to involve substantial levels of human suffering; since in terms of the evidence presented to the
Tomlinson Commission [34] the African rural areas were unable to support their existing populations by the early 1950's. Consequently, it is highly unlikely that these new immigrants were able to make
a
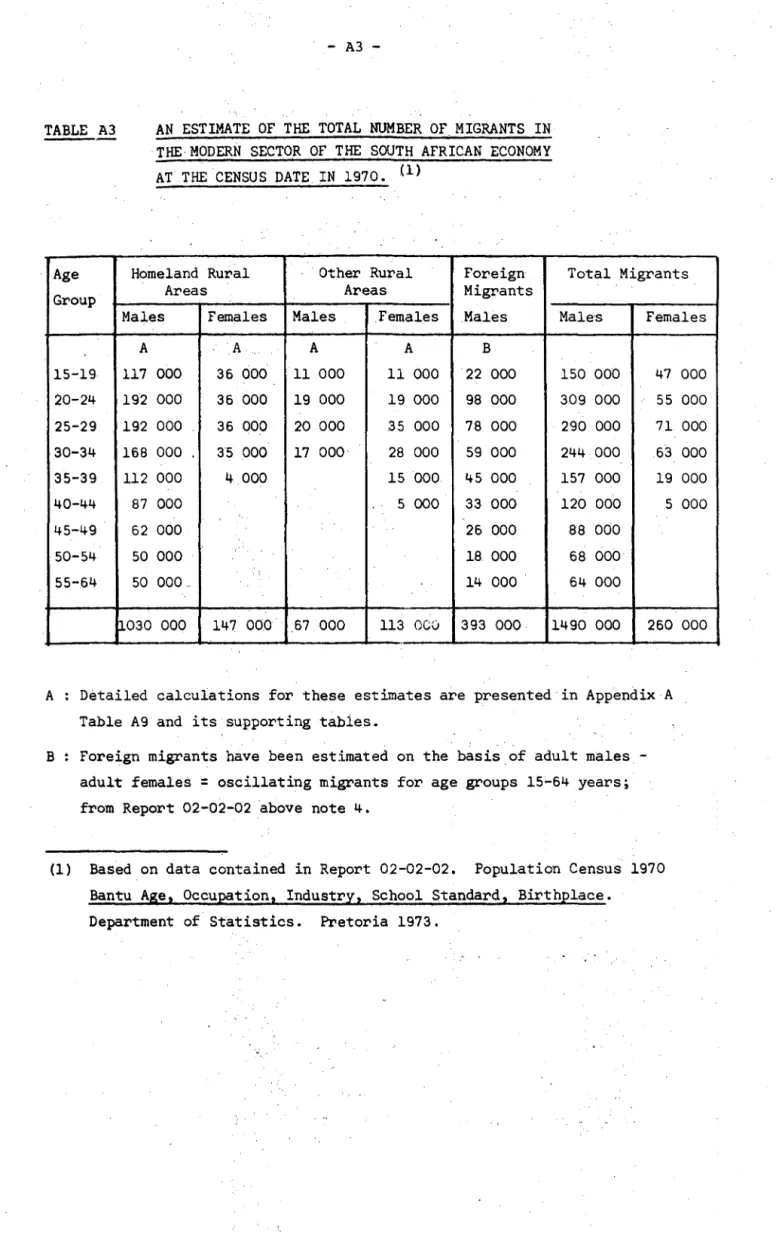
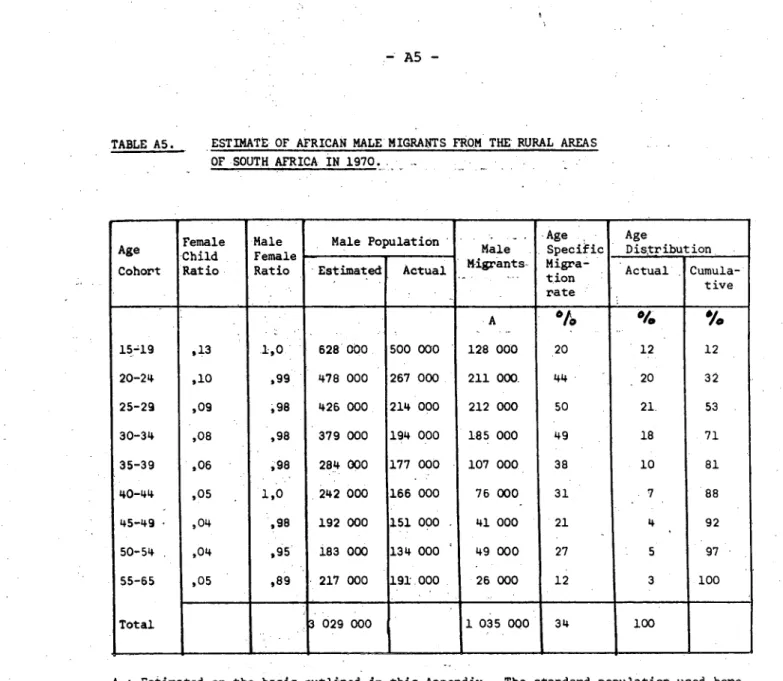
viable living for themselves in the Reserve areas. In addition one should question whether the rate of job creation in the modern sector outside agriculture was sufficient to. provide jobs for both its own expanding work force, and this substantial inmigration resulting from the exodus from capitalist 'agriculture.African Temporary Migration. in the Capitalist Agricultural Sector The picture of the labour and population movements amongst Africans in the modern agricultural sector that has been drawn in the preceding sections of this paper is complicated by the movements of temporary migrants. It was only possible to estimate the number of temporary migrants f~omthe areas predominantly devoted to
capitalist. agriculture for the census date in' 1970. These' estimates
- 21 -
are presented in ~ Tab~e ~ 5 and certainly highlight the magnitude of the ~ .
mi~ration flows which are hidden by the use of net-migration estimates. (16)
e
Estimates of 'Gross Flows of African Male Temporary Migrants from White,...-- '~ral Areas and capitalist Agricuiture; Census Date 1970
-
,In-Migration to
-
Gross OUt- In . .Migration
Net Migration White Rural Areas Capitalist Agriculture Net Migration
Age ,Migration from
Group from White from White Capitalist
Rural Areas
Foreign ' Homeland Rural Areas Foreign Homeland Total Agricultl,1re Inflow
Migrants Migrants Migrants Migrants
Gross
(1) (2) (3) (4) (5) (3) (6) (7)
Under 20 -11 000 4 000 ' 64 000 79000 1 700 64 000 66 000
-
13 00020 - 24 - 19 000 10 000 39 000 6B 000 1 400 39 000 40 000
-
28 00025 - 34 - 37 000 18. 000 61 000 116 000 3 800. 61 000 65 000
-
51 00035, - 44 + 16 000 18 000 53 000 55 000 8 400 53 000 61 000 + 6 000 45 - 54 + 25 000 17 000 39 000 31 000 10 500 39 000 50 000 + 19 000 55 - 64 +14 000 8 000 22 000 1.6 '000 5 600 22 000 28 000 ,+ 1~ 000 Total - 12 000' 75 000 278 000 365 000 ' 31 400 • 278 ,000 310 000 - 55 000
(1) (2)
, ~
F~oin T~ble A3 colUmn 4 and its supporting Tables A4,' A5 andA6, I
From Report 02-02-02 1970 Census [50 I , All foreiqn Africans have been. trea ted as migr,ants. this will lead to a slight upward bias in these estimations.
(3) Obtained bY applying the job. distribution of migrants from the four major African language groups to the estimate of migrants ,from homeland areas see Table A7 and Table A3 i.e. 27\ of 1 030 000 = 278,000. These migrants were then allocated between age 'groups as the basis of the age group percentages of the four main' language groups employed in agriculture namely 23\. 14\. 22\. 19\ 14\
and 8\, Source data Report 02-02-02 1970 Census [50) Tables Al3. B13. D13 and Ell. in Nattrass (24);
(4) 1 + 2 + 3 = 4
(5) Foreign migrant;' in' capitalist agriculture were taken as "Foreign migrants 'in White Rural Areas" and allocated between'the age groups as the basis of the age ,distribution of all foreign'Africans
employed in agriculture, Source .data Report 02-02-02 1970 Census [50) Table 1 and TableKlO. in Nattrass [24J ( 6 ) 3 + 5 :, 6
(7) 4 - 6 ~ 7
On the census date in 1970 the net estimated migration of men from the White rural areas was only 12 000 people. However, when one loolts ,at t.he gross flows involved one sees that in fact as many as 365 000 men could well have been absent from their homes on the
capitalist farms. In addition the sector had absorbed a further inflow of 310 000 migrant men, 278 000 of whom came from the
African· homeland rural areas and 32,000 who were foreign immigrants To this massive flow of men one can add an outflow of 113 000 women from
(16) Such as those given for "other rural areas of South Africa"
in Nattrass [2.3J.
the White rural areas making a total migration flow in the two directions of close to 800 000 people.
If one works on the basis that these inmigrants were all full-time contract farm labourers'and not employed purely as casual labour one comes to the somewhat incredible conclusion that as much as 42 percent of the African labour force in the capitalist agricultural sector could have been composed of migrant labourers on the census date iIi 1970. This is to be compared with Sheila van der Horst's [27] data of 70 OOOinmigrants who comprised 11 per cent of the labour force excluding casual labourers in 1936. It is obvious from this data that the capitalist agricultural sector is indeed making increased use of the migrant labour system in obtaining labourers for the sector. At the same time the!';ector supplied outmigrants to the non-agricultural modern ,sector that were the equivalent of nearly half, 49 per cent, of the sector's permanent labour force.
The extent of these cross-flows is due in a large part to thE!
.fact that historical. patterns of labour supply have been established in South African agriculture. The sugar plantations in Natal, the fruit-growing districts in the Cape and the maize areas of the Trans- vaal have relied on migrant labour for the greater part of their
existence and still do; , although so far as the sugar regions of Natal are concerned there is evidence that the level of employment of
Africans on the plantations has decreased in r.ecent .years. Similarly the poorer agricultural districts such as those in Northern and North Western Natal and the North Eastern Cape have an equally long history as areas supplying outmigrants. These historical trends are reinforced by well-established behaviour patterns as far as job preferences are concerned on the part of the vorker, for preferences for African labour from a particular region as far as the employers are concerned, and by interregional wage differentials.
When one takes all the African population movements out of
capitalist agriculture into account then, if one assumes that all the
- 23 -
economically active members of the outmigrant group~ were employed
' t ' "
in the modern sector of the South African economy, as much as 20 per cent of the Africans who 'are economically active but not employed in agriculture either themselves originated in the capitalist agricultural sector or are first generation descendents of men who left the sector within the nineteen year period 1951-1970.
Capitalist Agriculture and the Labour Supply of the Capitalist Sector There is no doubt that capitalist agriculture has been a very' significant source of supply of labour as far as the rest of the capitalist sector is concerned despite the ,fact that'there is little evidence of any SUbstantial economic transformation taking place within the sector itself to date. Between the years 1936 and 1971 the sector has provided 24 ,per cent of the White labour force, 33 per centof,theColoured labour force, 41 per cent of the Asian labour force and 20 per cent of the African labour force employed in the non-agricultural capitalist sector in 1970.
There has therefore been a substantial movement of people out
"; , . . :
of the capital,ist agricpltural' sector, despite the fact that the sector itself has not until very recently undergone any substantial degree of capitalisation. ,What has happened, appears to' be a com- bination of the operation of'pull forces that have strongly affected the White, Coloured and Asian populations as labour scarcities in jobs normally filled by these, race groups began to emerge on an increasing scale in the manufacturing, mining and tertiary sectors cif the economy' and push forces, directed mainly at the African labour force, arising as farmers evicted squatters,and laboUr tenants in increasing number!) and substituted wage labourers resident nearby or migrant workers.
In the early period discussed in this paper it appears that the outflow of labour from modern agriculture was of an order of magnitude that enabled the remainder of the capitalist sector to employ the
economically active members of the outmigrant community. However there are indications that the rate of outflow from agriculture has now
reached proportions where this may no longer be the case. Table 6
I
I I
I~
It
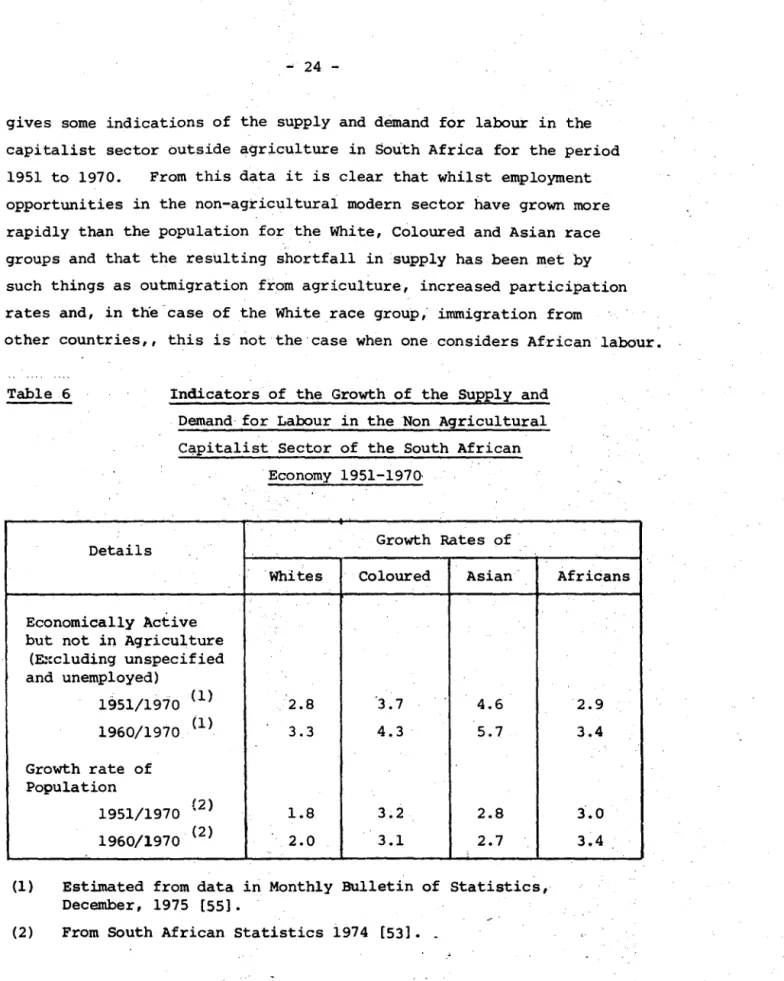
gives some indications of the supply and demand for labour in the capitalist sector outside agriculture in South Africa for the period 1951 to 1970. From this data it is clear that whilst employment opportunities in the non-agriculturai modern sector have grown more rapidly than the population for the White, Coloured and Asian race groups and that the resulting shortfall in supply has been met by such things as outmigration from agriculture, increased participation rates and, in the case of the White race group,' immigration from
other countries" this is not the'case when one considers African labour.
Table 6 Indicators of the Growth of the Supply and Demand for Labour in the Non Agricultural
C~pitalist Sector of the South African Economy 1951-1970·
Details Growth Rates of
'Whites Coloured Asian
I
Economically Active but not in Agriculture
(~:cluding unspecified and unemployed)
1951/1970 (1)
2.8 3.7 4.6
1960/1970 (1) 3.3 4.3 5.7
Growth rate of Population
1951/1970 (2)
1.8 3.2 2.8
1960/1970 (2)
2.0 3.1 2.7
, ,
(1) Estimated from data in Monthly Bulletin of Statistics, December, 1975 [55].
(2) From South African Statistics 1974 [53] • .
. '
Africans
2.9 3.4
3.0 3.4
The demand for African labour in the modern sector appears to have barely kept pace with the natural increase in population over this 19 year period. Jobs for Africans in the modern sector outside
•