The South African Parliament passed the South African Academy of Sciences Act (No. 67 of 2001), which came into force on 15 May 2002. South Africa is officially recognized by the government and represents the country in the international community of science academies and elsewhere.
Introduction
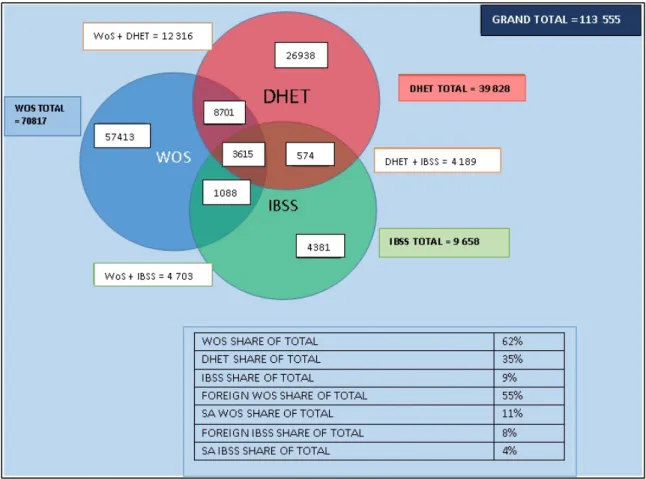
7 in TR WoS can be linked to the citation data available in the latter (see above). This means it presents the most comprehensive coverage of SA-authored scientific publications as it includes all papers in TR WoS, local SA journals accredited by DHET and articles published in IBSS-listed journals.
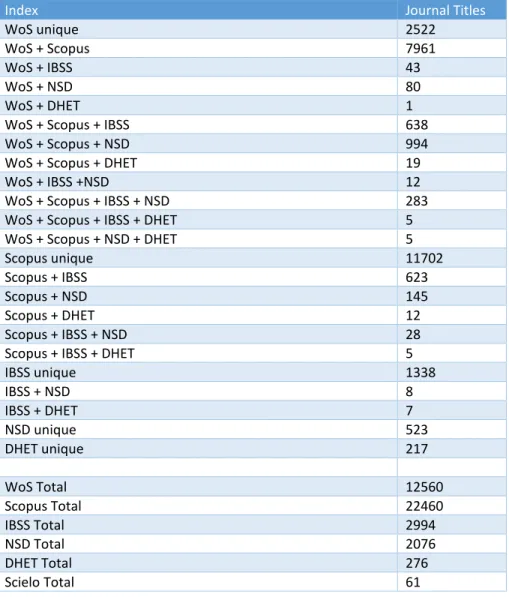
Distribution of journal articles by journal list
The DHET recognizes all journals listed in the TR WoS (Core Collection) for subsidy purposes. From the perspective of the DHET, this means that it "trusts" the judgment of the WoS in its inclusion of journals.
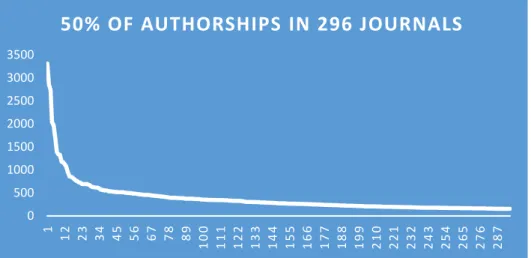
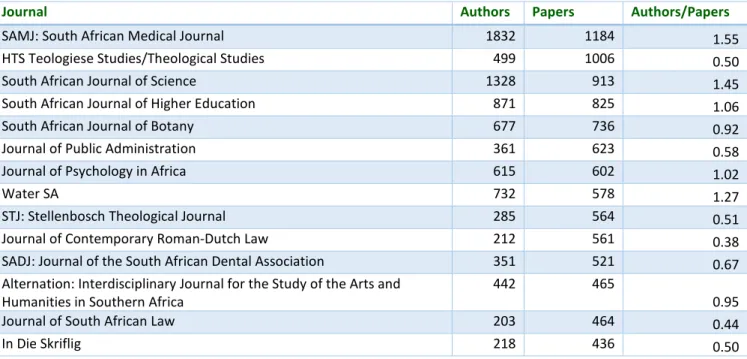
Distribution of journal articles by journal title
An analysis of journal publication patterns/configurations
Consistent and stable publication output
Inconsistent and interrupted trends in publication
66 We have selected two examples which we analyzed in more detail as examples of quite inconsistent article publication: Journal of Arid Environments and Physics and Chemistry of the Earth. Journal of Arid Environments is an international journal that publishes original scientific and technical research articles on physical, biological and cultural aspects of arid, semi-arid and desert environments.
Gradual and incremental increase in publication output
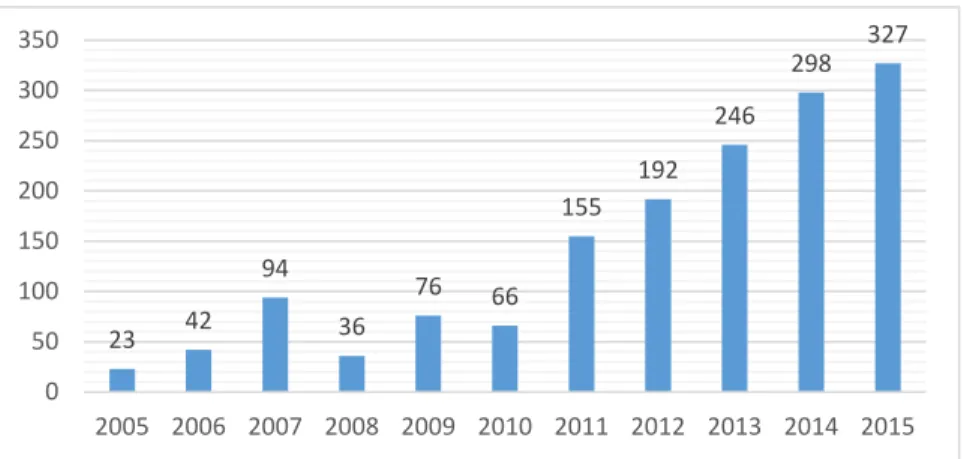
A review of their website shows a steady increase in the number of issues per year and articles per issue. The increase in the number of articles published by PER is clearly the result of an increase in the number of issues per year (from one in 2005 to seven in 2015) as well as an increase in the average number of articles per issue: from around five per issue in the early years to more than 10 in 2014. The increases appear to be the result of an increasing professional effort by the editorial staff and editor as they responded to market demand for their journal.
See also the paper by Marita Carley entitled Identifying predatory open-access academic journal publishers, in light of the South African Department of Higher Education and Training's decision to retrospectively deaccredit certain journals published in Orbiter (Vol.
Inexplicable (recent) spikes in publication trends
In this section we have presented fairly detailed information on the historical trends and patterns of journals in which SA academics have published over the past decade. Different journals serve different scholarly and scholarly communities, different academic and research interests, and are increasingly responding differently to the new demands and reward systems for publishing. But our goal in this section was an even more practical and mundane one, one that speaks to the sustainability of SA journals.
It is reasonable to ask whether public funding should pay for "subsidized" journals that serve a very small community of scholars and academics.
Journal articles by scientific discipline/field
Introduction
Perhaps more important is the question of whether very small journals have the resources to maintain consistently high quality standards in peer review and journal management. Second, we have developed a more elaborate subject classification framework that allows us to articulate at different levels of classification. Using the WoS 291 categories as the lowest (most detailed) level of classification, we have added three higher order levels of classification.
In this report, we use both the lowest level (level 4), which is the most detailed, and level 2 (which contains 22 categories).
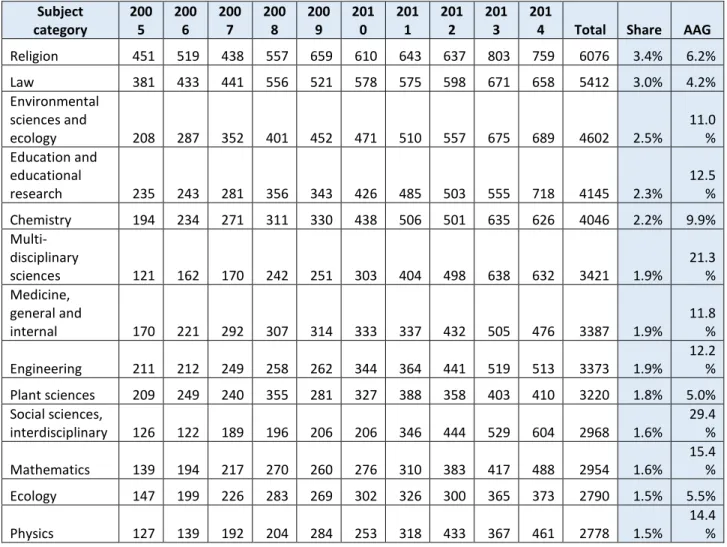
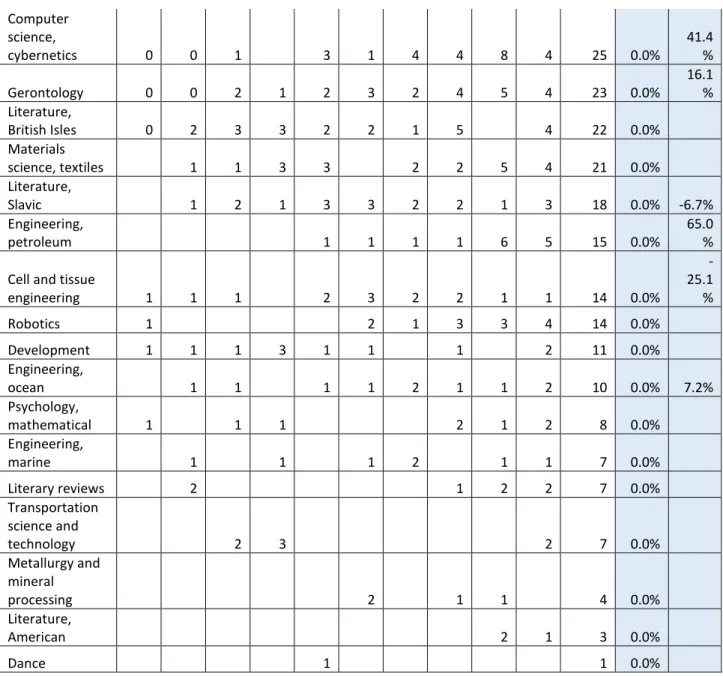
Level 4 field categories
These twenty areas account for one third (33.7%) of all journal articles produced by the university sector. Perhaps the most striking result is the fact that the Social Sciences and Humanities (Religion, Law, Education, Interdisciplinary Social Sciences, Management, Psychology and Business and Economics) account for such a significant proportion of all journal articles (13.9%). RELIGIOUS SCIENCES ENVIRONMENTAL SCIENCES & ECOLOGY EDUCATION & EDUCATIONAL RESEARCH CHEMISTRY MULTIDISCIPLINARY SCIENCES MEDICINE, GENERAL & INTERNAL ENGINEERING SCIENCES PLANT SCIENCES SOCIAL SCIENCES, INTERDISCIPLINARY SCIENCES ECOLOGICAL SCIENCES MENT PSYCHOLOGY BUSINESS & ECONOMICS.
Behavioral Sciences Anthropology Sociology Environmental Studies Business, Finance Physics, Particles and Fields Economics Social Sciences, Interdisciplinary Astronomy and Astrophysics Multidisciplinary Sciences Planning and Development Thermodynamics Electrochemistry Communication Energy and Fuel Neurosciences Multidisciplinary Management Materials Science, Humanities
Level 2 categories: AAG rate (2005 – 2014)
The distribution of journal articles by main scientific domain (Figure 9) shows that slightly more than a third appeared in journals categorized as natural science and agricultural science journals. The share of articles in medicine and health sciences of the total sector output is 20% and the share of engineering and.
Trends in collaborative publishing (multi-authorship)
Trends in collaborative publishing in WoS journals
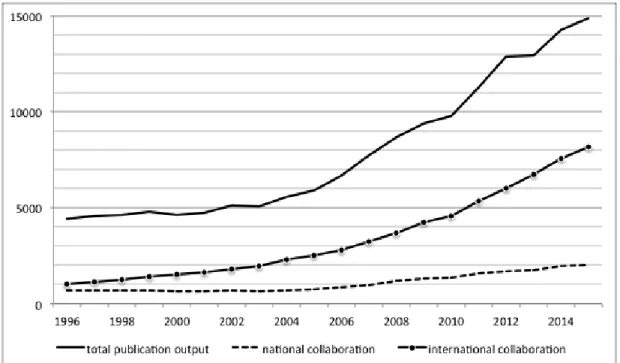
Our analysis of collaborative publishing is limited to 'research articles' (excluding other document types such as editorials, book reviews and letters). The total publication output from South Africa has more than tripled over the past ten years. Research publications originating from domestic collaboration grew by 200%, while publications produced by a single organization lagged behind, increasing by 'just' 70%.
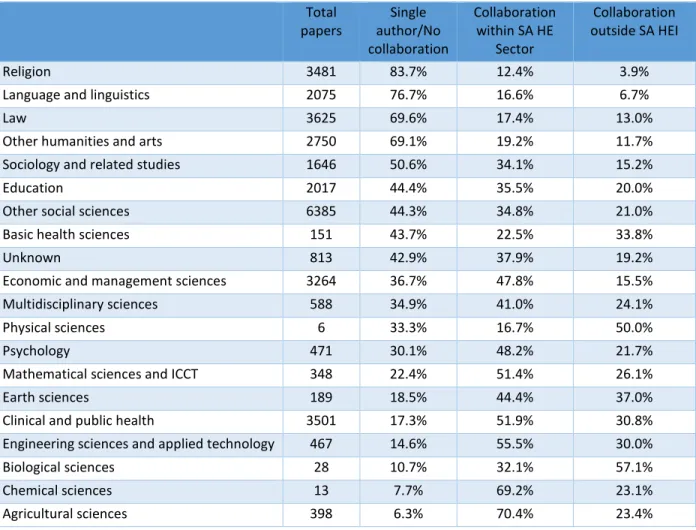
91 2.6.2 Trends in collaborative publishing in non-WoS journals (local SA journals and journals indexed in IBSS).
Trends in collaborative publishing in non-WoS journals (local SA journals and
Tydskrif vir Vroeë Christelike Geskiedenis: 'n Tydskrif vir die Studie van Vroeë Christendom en Laat Oudheid. Missionalia: Tydskrif van die Missiologiese Vereniging van Suider-Afrika
The citation impact of South African-authored papers over the period 2005 – 2014
Citation impact of SA papers in WoS journal papers
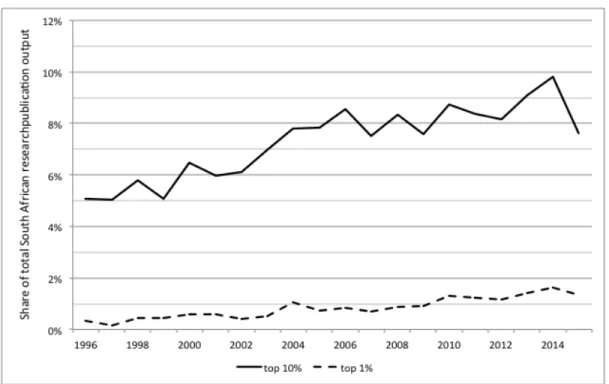
Moving up to the top 1% globally cited in their discipline, citations from South African articles make up 0.6% of that top segment. 99 Figure 12: Annual trend in the share of South Africa in the world publication output and within breakthrough research publications. 100 Figure 13: Annual trend in South Africa's share of highly cited publications within its total publication output Data source: CWTS TR WoS database (whole count; research articles and letters).
The upward trend lines mark an increase in the proportion of these highly cited publications, which is certainly one of the driving forces behind the overall increase in South African research impact.
Journal-level citation statistics
The proportion of authors publishing in the journal with SA affiliation and the comparative trend (80% increasing to 85% in recent publication window. In this case, there is very little difference in the relative citation rates of these two groups of authors. it average number of citations is very low, which would translate to a very low JIF.
Correlating the average number of citations and the Journal Impact Factor for these journals shows a high correlation, as you would expect.
Citations in the WoS to SA journals not indexed in the WoS
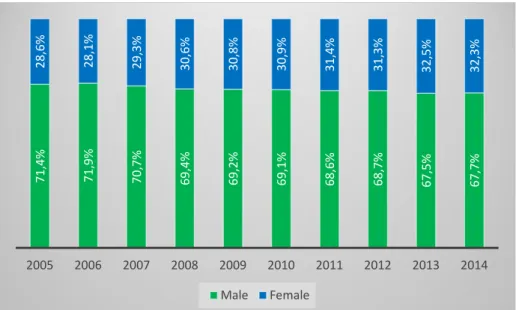
Trends in the demographics of SA journal article authors
10 This graph is based on an analysis of 65% of all scientific papers produced by SA academics during this period. Due to the methodology followed in linking author demographics to scholarly articles, we would suggest that these data underestimate the number of female authors. 11 This graph is based on an analysis of 62% of all scientific articles produced by SA academics during this period.
Due to the methodology followed in linking author demographics to scientific articles, we might suggest that these data underestimate the number of articles with Black authors.
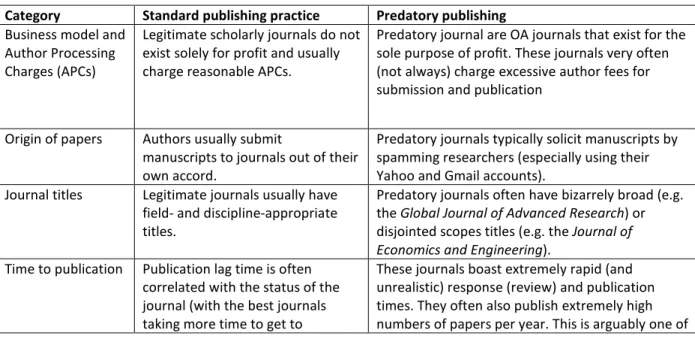
Ethics and journal publishing
Predatory publishing
Examples of the latter are by Robert E Bartholomew (2014) in an editorial in the Journal of the Royal Society of Medicine17 and David Moher and Anubhav Srivastava (2015) in a correspondence note in BMC (BioMed Central). It certainly should not (and Beall should have known this) be construed as some fraudulent practice on the part of the journal. The final source of evidence was our own inspection of each of the journal's titles.
We could not find her name on the staff list of the University of Arizona.
Questionable publication practices
It is already causing some concern that the former editor-in-chief ****** published 58 articles in the journal (the same applies to the current editor. The most striking, however, is the publication profile of Prof ***, who is also a member of the editors of TR were asked in 2010 to review Journal B and finally removed the journal from its list in February 2012, approximately 18 months after serious.
169 It is essential that we protect the integrity of our publication system and therefore also of the funding system.
High-level trends in scientific book (monograph) publishing in South Africa
Book and book chapter subsidy units account for approximately 4.3% of total publication output over the past ten years (Figure 26). 172 Figure 27: Relative share of book/chapter and conference papers of total publication output Data source: SA Knowledge Base (SAK), CREST. A breakdown by parts of books and chapters of individual universities for the same period is given in Figure 28.
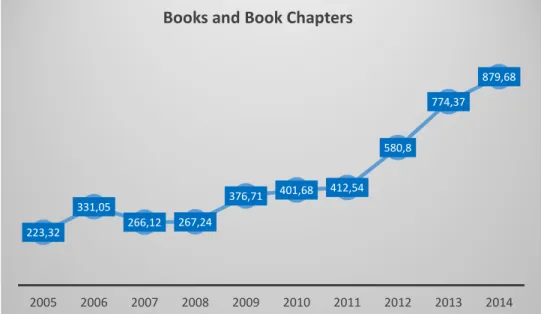
Book and book chapter submissions (2005 – 2014)
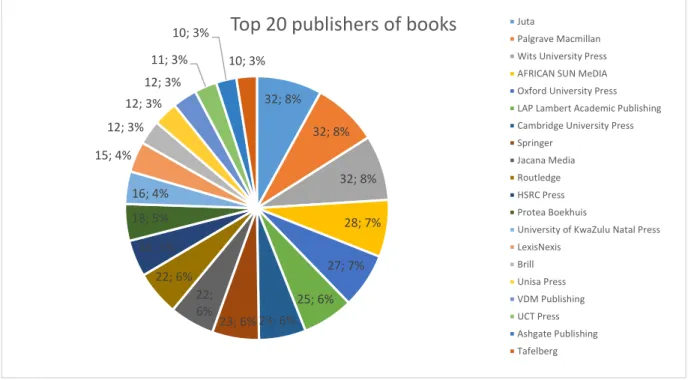
Book submissions
In table 25 we list the names of the publishers of these book titles in descending order (for 3 or more titles). The following table lists, in descending order, the names of the most prolific book authors of these submissions. Palgrave Macmillan Wits University Press AFRICAN SUN MEDIA Oxford University Press LAP Lambert Academic Publishing Cambridge University Press Springer.
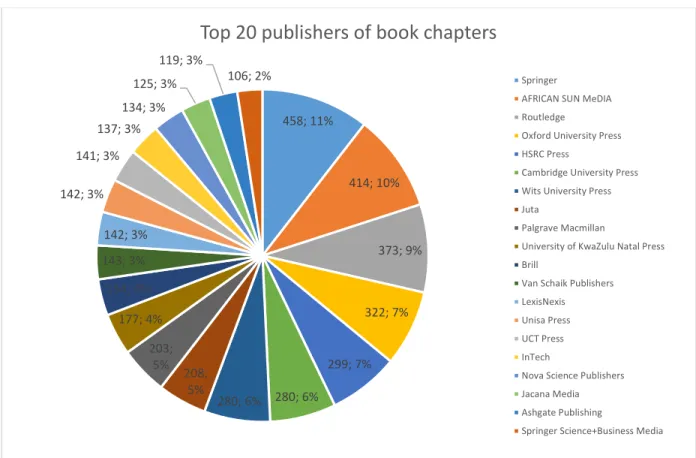
Submissions of chapters in edited books/collections
We could only find two: the SENSE scale and the NSD scale by the Norwegian Research Council. We found such studies for the disciplines of political science (Lewis, 2000 and Garand, 2011), social sciences and humanities in general (Giminez-Toledo, 2013), chemistry and sociology. When correlating these titles with Sense and NSD's ratings (or . associated publishers), we found the following.
29% of these titles were published by publishers not rated by any of these.
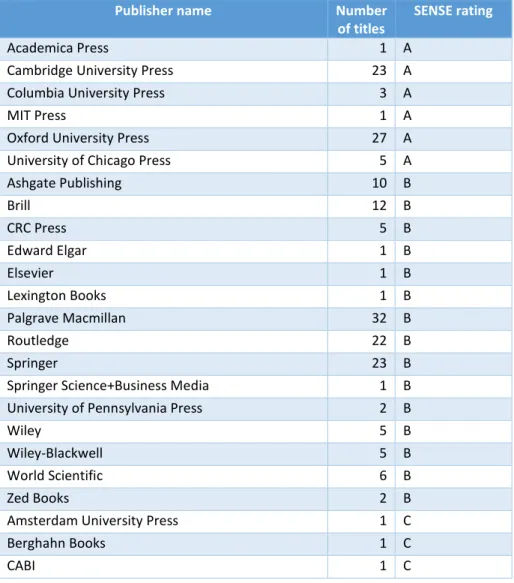
The Sense ranking of publishers
184 ranking system covering all scientific fields, we were left with no choice but to revert to the Sense and NSD rankings. Our database contains 11,890 unique titles of books and chapters that were submitted for subsidy during the period 2005-2014. The SENSE list for 2015 was imported into SAK and linked to book chapter and book submissions.
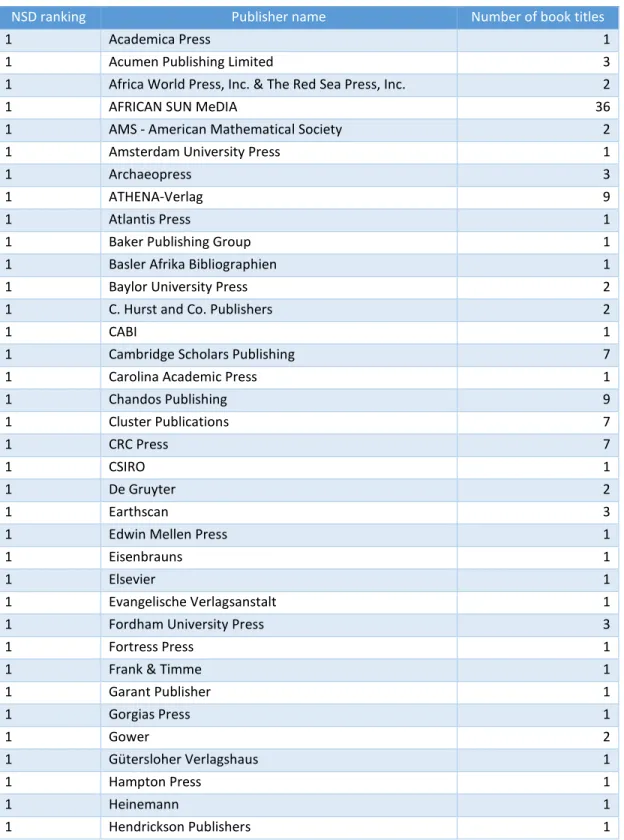
The NSD ranking of publishers
These results show that a relatively small proportion of the titles submitted are published by the top ranked publishers in the world – at least according to the SENSE ranking. In the final table, we compare the SENSE/NSD ranking with the recommendations made by the ASSAf panels (2013 data only). The point of this comparison is to see if there is sufficient convergence between the more detailed reviews of book titles by the ASSAf panels and the international rankings of the relevant publishers.
The last column of Table 46 shows the percentage of YES recommendations (ie the ASSAf panel recommends that a specific title be supported) for that publisher.
High-level trends in publication of conference proceedings
Conference proceedings outputs by university
The issue of quality in conference proceeding submissions
Bibliometric profiles of SA Journals indexed in the WoS