• Tidak ada hasil yang ditemukan

Directory UMM :Data Elmu:jurnal:T:Tree Physiology:vol17.1997:

N/A
N/A
Protected

Academic year: 2017

Membagikan "Directory UMM :Data Elmu:jurnal:T:Tree Physiology:vol17.1997:"

Copied!
10
0
0

Teks penuh

Loading

Gambar

Figure 1. Dry mass per unit area (A), gross rate of oxygen evolution atan irradiance of 750 Picea abieslarger than the symbols
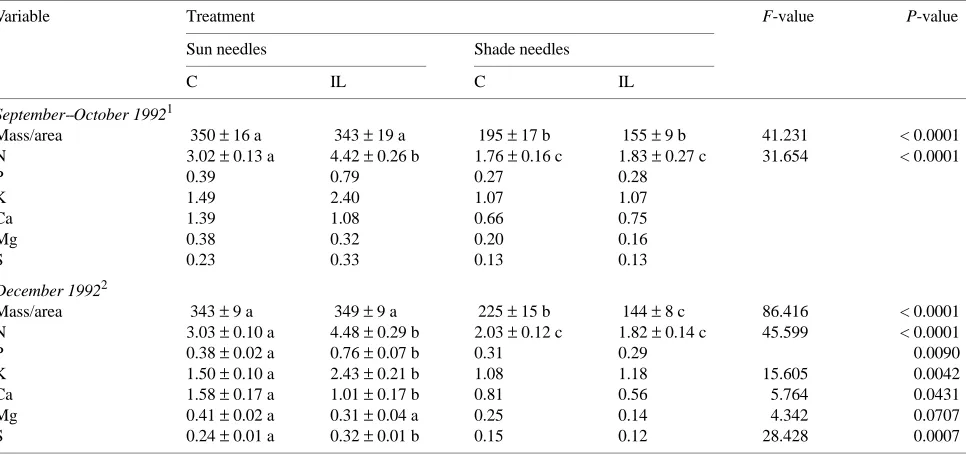
Table 2. shown. Within a row, significant differences ((C), irrigated (I) and irrigated-fertilized (IL) Dry mass and content of macronutrients expressed on a projected area basis (g m−2) in current-year needles from the third whorl of controlPicea abies
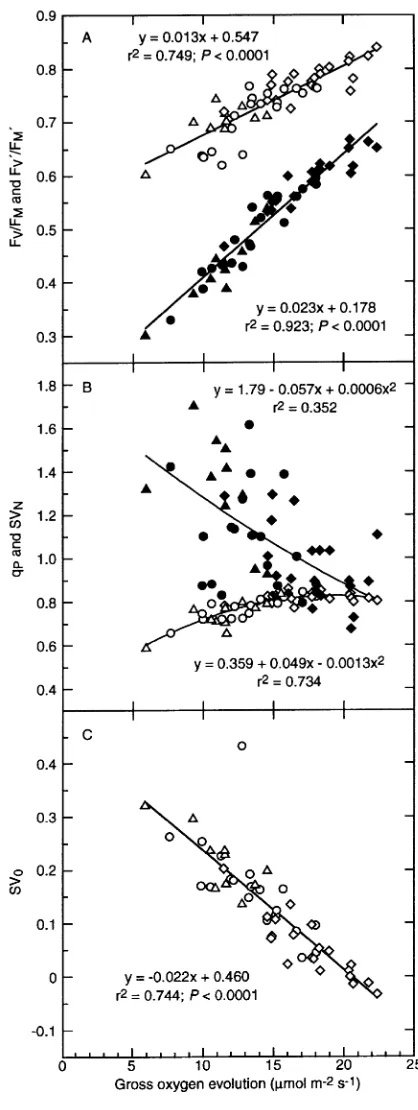
Figure 2. Gross rate of oxygen evolution at an irradiance of 1020 ±(gross rate of oxygen evolution) and values representing pooled samples from 4--5 trees (mineral nutrient content) are shown in B--D
Figure 3. Gross rate of oxygen evolution at an irradiance of 600 ±potassium (C) and sulfur (D) in current-year needles from the third whorl of control ( 10 µmol m−2 s−1 as a function of the content of nitrogen (A), phosphorus (B),�), irrigated (�) and irri
+3

Referensi

Dokumen terkait

If technical progress is stronger than the drag caused by land then the model approaches a steady state with a rising wage and a constant rate of profit so that the revolution does