JOURNAL
American Society Sugar Cane Technologists of
1980 MEETINGS
Volume 1
Florida and Louisiana Divisions July 1982
ASSCT
OFFICERS AND COMMITTEES FOR 1980 General Officers and Committees
Denver T. Loupe Program Chairman
Joe E. Clayton Executive Committee
Guillermo Aleman Antonio Arvesu Pat Cancienne Joe E. Clayton Gary J. Gascho Albert Guidry Roland Hebert Dalton Landry Ben L. Legendre Irving Legendre, Jr.
Denver T. Loupe Lowell L. McCormick Joseph R. Orsenigo Alberto Recio Charley Richard Blaz Rodriguez Robert Stacy
i
Editors of Journal Managing Editor
Lowell L. McCormick Technical Editors
Agriculture Fred A. Martin Manufacturing
Joseph A. Polack
Divisional Officers
Florida Office Louisiana Antonio Arvesu President Dalton Landry
Gary J. Cascho 1st Vice President Irving Legendre, Jr.
Guillermo Aleman 2nd Vice President Ben L. Legendre Robert Stacy Chairman, Agricultural Section Charley Richard Alberto Recio Chairman, Manufacturing Section Albert Guidry Joe E. Clayton Chairman at Large Pat Cancienne Bias Rodriguez Past President Roland Hebert Joseph R. Orsenigo Secretary-Treasurer Lowell L. McCormick
TABLE OF CONTENTS Page
1 President's Message - Louisiana Division Dalton P. Landry
3 President's Message - Florida Division Antonio Arvesu
Agriculture Papers
5 The Use of Trichlorfon to Identify Insecticide-Resistant Sweet Sorghum Cultivars 1). M. Broadhead, K. C. Freeman and N. Zummo
7 Losses Caused by Diatraea Saccharalis in Florida Modesto Ulloa, M. G. Bell and J. D. Miller 11 Sugarcane Land Valuation: A Computerized Approach
Jose Alvarez and Ben Abbitt
15 Performance and Energy Considerations in Mechanical Sugarcane Harvesting Without Preharvest Burning - Florida Progress Report
B. R. Eiland and J. E. Clayton 20 Two Row Cane Harvester
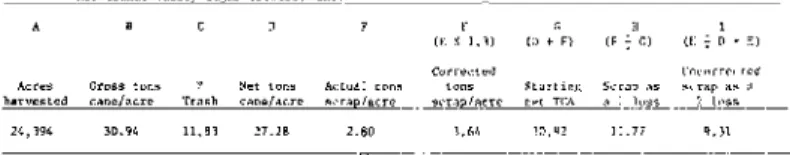
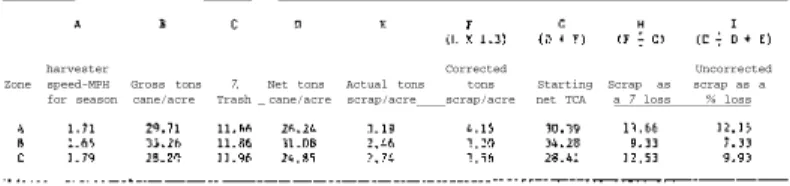
R. A. Duncan, Bryan Allain and Lawrence Dugas 22 An Investigation of Sugarcane Scrap in the Rio Grande Valley
Norman Rozeff
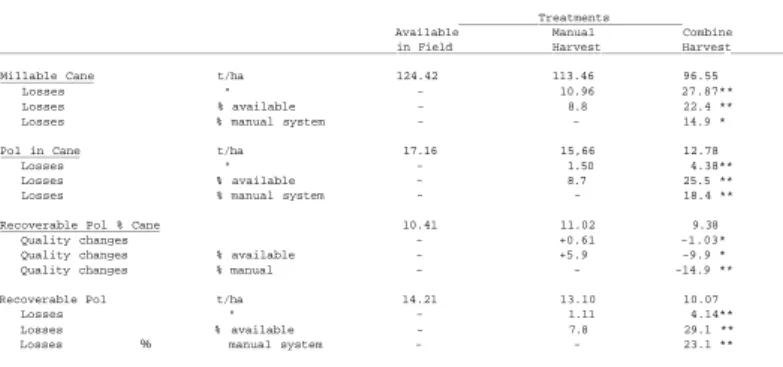
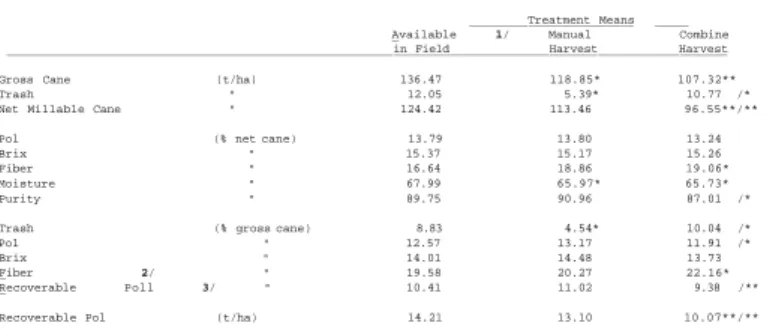
29 The Effect of Manual and Combine Harvesting Systems on Sugarcane Yield and Quality in the Sudan
C. H. Burleigh, I. A. Abu Sin and N. Le Poidevin
34 The Effects of Subsurface Draining Commerce Silt Loam Soil on Sugarcane Yields Cade E. Carter and Carl R. Camp
Other Agriculture Papers
40 Evaluation of Sugarcane Characteristics for Mechanical Harvesting in Florida J. E. Clayton, B. R. Eiland, J. D. Miller and P. Tai
47 Yield Effects of Ratoon Stunting and Sugarcane Mosaic Diseases on Some Sugarcane Varieties in Louisiana
H. Koike
Manufacture Papers 52 Ethanol From Sweet Sorghum
J. A. Polack and D. F. Day
57 Evaluating the Effectiveness of Cane Washing by the Ash Level in Bagasse James C. P. Chen
62 Possible Agricultural and Industrial Uses of Distillery Wastes in Puerto Rico George Samuels
68 The Double Magma System: A Report of its Performance and Experiences With it at United States Sugar Corporation
Blas M. Rodriguez
74 Ultrafiltration and the Sugar Industry D. F. Day
79 Recent Developments in the South African Sugar Milling Industry M. Matic
ii
Abstracts - Agriculture
85 Estimate of Irrigation Relative to Maximum Evapotranspiration and Probable Reduction of Vegetative Sugar Cane Production
Aicardo Roa E.
85 Bud Chips of Sugar Cane Varieties for Worldwide Transport R. D. Breaux
85 Equipment Development for Production of Narrow-Row Sugar Cane in Florida J, E. Clayton and B. R. Eiland
85 The Practical Application of the "Fors" (Round Saw) Method of Cane Sampling Alfonso L. Fors
86 Polado: A New Sugar Cane Ripener for Louisiana B. L. Legendre
86 Monitoring Fields for Effective Sugar Cane Borer Control Jerry Prewitt, T. E. Summers, Wayne Beardsley and Frank Polhill 86 Plant Spacing Experiments With Four Sugar Cane Varieties
S. A. Reeves, Jr.
86 A Comparison of Sugar Cane and Sweet Sorghum Using Various Planting Methods for the Production of Sugar, Biomass and Alcohol
R. Ricaud, B. Cochran, A. Arceneaux and G. Newton
87 Response of Several Sugar Cane Varieties to Polaris and MON 8000 in Commercial Tests During the 1979-1980 Harvest
E. R. Rice, D. G. Holder and R. P. DeStafano 87 Relationships Between Sugar Cane Stalk Length and Leaf Areas
S. F. Shih and Gary J. Gascho
87 The Pre-Emergence and Post-Emergence Herbicides Registered for Use in Louisiana Sugar Cane in 1980
Ernest R. Stamper
87 Aerated Steam Treatment of Seed Cane to Control Sugar Cane Diseases R. J. Steib
88 Differences Between Healthy Sugar Cane and That Naturally Infected by Mosaic Virus in Texas
B. Villalon
Abstracts - Manufacture 89 Two Approaches to Mill Grinding Controls
Carlos H. Alonso
89 Steam Vapor Side Cleaning and Heat Transfer Pedro R. Arellano, James C. P. Chen and James S. Rauh 89 Report on the Operation of the Lotus Roll, A Perforated Mill Roll
Jean Bouvet
89 Automation for Bagasse Feeding of Horseshoe Furnaces Emilio A. Perera and James H. Farinas 90 Editorial Policy
91 Author Index
iii
PRESIDENT'S MESSAGE—LOUISIANA DIVISION Dalton P. Landry County Agent, Lafourche Parish Louisiana Cooperative Extension Service
Thibodaux, Louisiana
Looking back in history, one can see that this great domestic United States sugar industry has seen good times and hard times; sugar personnel have variously been the "have's" or the "have-not's." The industry was almost wiped out in the 1920's by diseases, the most destructive being mosaic. Later, there were serious labor problems in the early 1940's. Meanwhile, the industry has been ravaged by storms, freezes, floods and a host of other ills; if it was bad, the domestic sugar industry experienced it. All this without mentioning the man-made problems inflicted on the industry.
In June, 1980, however, a new decade is starting and the domestic sugar industry is still extant, albeit slightly battered and scarred, and it will surely be here for years to come. Certainly, a look at history does not only show bad times, but also good times, for if such had not been the case, even the strongest could not have survived.
Since 1795, when Etienne de Bore developed a way to produce sugar from sugar cane on a commercial scale, people have eaten and enjoyed sugar and sugar products. Now, after 185 years, a government agency is implying that sugar is not good for the human body and should be restricted in the amount allowed in certain cereal products. In a recent article published in "The Sugar Bulletin," the U. S. Department of Agriculture proposes to restrict the amount of sugar in cereals used in its supplementary feeding programs for women, infants and children, although, according to the article, there is apparently no scientific justification for this proposal. Such a restriction could single out sugar as a bad food—one that should be avoided by all.
Admittedly, sugar consumption is a factor associated with tooth decay; however, it is only one of the causes of the multi-faceted problem. Certainly, there is no need for any program that will have the effect of tarnishing sugar as anything other than a safe food and one which can play a positive role in the diet when consumed in reasonable amounts. Your author has heard the aged cite many reasons for their longevity, but has yet to hear someone say they attributed their long life to not eating sugar on their cornflakes.
There have been, and presently are, suggestions that the Louisiana sugar industry change to alternate crops, such as growing vegetables. It seems unbelievable, however, that history will record the change of the "Louisiana sugar cane-growing area" to the "Louisiana vegetable-producing area." The parish in which the author resides had, for many years, a large vegetable-growing area in addition to its sugar cane area. In fact, over 125 commercial truck crop producers were reported in the parish in the mid-1960's.
Today, that number has dwindled to about 25.
In the mid-1960's, there were 56 commercial Irish potato producers in the parish; today, this number has dwindled to two or three. Farmers do not generally leave a thriving business, and none seem to die rich. High labor costs, lack of available labor, high production costs, extreme market competition and unfavorable weather conditions are just some of the problems that have forced commercial vegetable pro- ducers out of business. For these same reasons, these crops are a poor alternative to sugar cane.
In fact, there is apparently only one alternative to sugar cane to which growers could switch while continuing to utilize the specialized harvesting equipment now employed in the Louisiana sugar cane indus- try; sweet sorghum for alcohol production could be harvested with sugar cane harvesting equipment. With other crops usually mentioned as alternatives, farmers would have to junk or sell at a loss this specialized harvesting equipment and have to purchase additional harvesting equipment for the specific alternative crop.
Even if farmers could convert to other crops, the closing of sugar mills throughout the Louisiana sugar cane belt would have a very detrimental effect on the economy of the area. For instance, in 1979, the three sugar mills and one sugar refinery located in Lafourche Parish employed 289 full-time and 231 seasonal em- ployees (520 people), with an annual payroll of approximately US$5.6 million. The sugar industry is not only farmers and mill people, it is the people who service the industry, too, including the land owners who rent land to farmers. Put all these together throughout the Louisiana sugar cane belt, and the industry becomes quite sizeable, and of much importance to the area's total economy.
Since the demise of the Sugar Act, industry leaders have tried unsuccessfuly to pass legislation which would help stabilize sugar prices and set them at a level where growers could make a living in this industry, i.e., make a legitimate profit on their investment, while the price of sugar could be kept at a level commensurate with other foods consumers have to purchase. Needless to say, even with the tremendous time and effort put forth by industry leaders, they were not successful.
Today, the price of sugar is not dependent on the cost to produce it, but on the availability of sugar from foreign producers, who do not have to contend with regulations and laws that raise the cost of produc- ing sugar. Foreign producers are, in many cases, subsidized by their own governments, who do not employ U.S.
citizens or who purchase very few U.S.-made products, and these foreign producers do not pay taxes to keep this country strong and prosperous. To further complicate matters, there is increasing competition from other sweeteners for a share of the market restricted only to sugar at one time.
1
It appears that, under the present structure of the International Sugar Agreement, the price of sugar will vary widely, with ups and downs; the domestic sugar industry has already seen the high prices of 1974 sink to the low prices of 1976. The sages relate that there is a very definite sugar price cycle, trig- gered by supply and demand, and they say that only those who are good managers and who use good marketing skills will survive. Yet, it is certain that low sugar prices can create problems in all sugar-producing countries which will have an effect on how low the price can get. The International Sugar Organization producing countries have already asked for, and received, a $0.01 rise in the established price range, and they intend to renegotiate in November, 1980.
Production costs are constantly increasing, and the domestic sugar industry is no stranger to infla- tion, particularly since energy costs are climbing steadily, with no end in sight. Every section of this industry faces this problem.
The past is gone forever, however, although it is possible to use facts from the past to help insure that tomorrow's history and today's future will be kind to the domestic sugar cane industry. As techno- logists, members of this Society must apply the scientific and other information available to shape the destiny of this industry. There is a need to anticipate and prepare for situations, to guard against un- preparedness and to react positively to situations which confront this industry.
To shape this good future, efforts must be extended; among them are:
That the domestic industry continue as a total industry to strive for domestic sugar legislation that will stabilize sugar prices at a level which will permit members of the industry to better plan their businesses. At the same time, there is a need to provide needed information to pro- ducers, processors and others on market trends, sugar futures, long-range production and consump- tion information. On a national and international basis, marketing information is a must for the decision-making needed in today's sugar business.
With the price of fuel energy continuing to increase, the sugar cane industry needs to explore, and, if feasible, to take advantage of this situation to convert to alcohol production as an alternative sugar cane product.
Research should be continued at a faster pace on crops that could better fit in a fallow land and sugar cane rotation. Having one-fourth of the total land non-productive is costly to growers.
Crops should fit into the rotation, for alternative crops that decrease sugar cane acreage will also cut down on the cane available to mills that need that tonnage to operate efficiently and stay in business. Every acre now planted to sugar cane should be kept in production.
. Research on weed and insect control should continue, with added emphasis on application methods that would cut drift and be more environmentally acceptable.
. An information program should be developed to tell the story of sugar to the consumer and relate the importance of the domestic sugar industry to the general public, launched on a local, state- wide and national basis.
. A dialogue and working relationship with all facets of the sweetener industry must be developed.
The domestic sugar industry must strive to raise the production of sugar per hectare, either through added research or the adoption of already proven and recommended research. Although the Louisiana sugar cane industry has made tremendous improvement in mechanization and greater production per man-hour, the production of sugar cane per acre is still basically what it was 20 to 30 years ago. Those producers who have accepted mechanization and are making full use of available technology are producing up to 150 to 170 percent of the average. Greater production is a must for growers who expect to receive the maximum benefit of high prices and to stay in business during the lower-price years.
Inflation has caused production costs to rise. One of the more serious problems faced by growers is obtaining the added financing needed at acceptable interest rates. The restrictions placed on lending institutions and government agencies should be reevaluated and restructured to allow adequate farmer financing.
Entering the decade of the 1980's, the price of sugar looks good, and even some of those sages who said in 1974 that the domestic U.S. industry would see $1.00 per pound sugar in 1975 are predicting a few good price years. One must certainly hope that they are right this time. Ten years from now, the sugar industry can be exactly as herewith predicted, for it is in the power of the A.S.S.C.T. to make it so.
This depends on how well situations are anticipated, how wise plans are and the implementation of prudent action when circumstances are properly evaluated. Action such as this spells the future of a progressive and viable domestic sugar cane industry.
2
PRESIDENT'S MESSAGE—FLORIDA DIVISION Antonio Arvesu Chief Engineer and Assistant Superintent Sugar Cane Growers Cooperative of Florida
Belle Glade, Florida
The Florida Sugar Industry season began on October 19, 1979, when the Talisman Mill started grinding and finished on April 13th, when Okeelanta ended its crop. A total of 1,027,962 short tons (975,166 tonnes) of raw sugar and 68,394,148 gallons (260 million liters) of molasses were produced from 10,607,559 tons (954,680 tonnes) of sugar cane, grown on 315,000 acres (126,000 hectares) of land. The cane was harvested in 178 days. Yields averaged 33.67 tons of sugar cane and 3.26 tons of sugar per acre, or 75.76 tonnes of cane per hectare, and 7.3 tonnes of sugar per hectare.
These are not the highest figures in the history of Florida, but if one were to take into consider- ation the cold temperatures and the abnormal amount of rain experienced during the crop, together with the effects of hurricane "David", it is fair to say that it was one of the best crops on record.
This is the second largest crop in the history of the Florida Sugar Industry. The industry is proud of its accomplishments because it was demonstrated once more that the combined efforts made by producers, research workers, agriculture and factory personnel, as well as financing and marketing advisors, paid handsome dividends. The growers did their part by having confidence in the future and keeping up pro- duction; research workers contributed by looking for new varieties to meet the needed characteristics of early maturity, more resistance to cold weather and to different diseases as well as the adaptability to mechanical harvesting; agriculture personnel helped by developing their own methods of planting, cultivating and transporting the cane, and factory personnel by increasing grinding rate, extraction, recovery, and improving steam balance to save energy and minimize the use of fuel oil; finance men, in turn, did all that must be done to manage capital requirements, while those handling marketing were busy improving the flexibility of handling and storage capacity of sugar and molasses so that both could be sold under the best conditions. These factors are responsible for the well-deserved success of the sugar industry in Florida.
Growers were concerned with the impact of two diseases; smut and rust. Reports of damage done by these diseases from other sugar cane areas were of limited help because of the different conditions in those areas. The only way for growers to assess their problems was the hard way; they had to take the known precautions and then hope for the best. The damage from these diseases in the 1979-80 crop could not be determined on an industry-wide basis. Rust was very evident in many fields during the early Sum- mer of 1979, but did not persist strongly throughout the late Summer and Fall. Therefore, rust was difficult to assess, and it is safe to say that the damage was not great last crop, but in early 1980 Variety CL 41-223 has shown severe rust damage. At this writing, rust is also appearing on some other varieties but the extent of potential damage cannot be evaluated. Some financial losses are anticipated in the 1980-1981 harvest. Severe smut problems were again limited to the same geographical area in which it was discovered. It is generally agreed that the disease did not spread with the speed with which it was anticipated.
In the factory area, Florida is looking for its traditional goals such as improvement of grinding rate, extraction, quality of sugar, recovery, reduction of total losses, etc. But in the last years we have had two special concerns; air pollution control due to new regulations, and energy saving because the cost of fuel oil has skyrocketed from $0.06 a (U.S.) gallon to a probable $1.00 a gallon by next year. The price of oil will thus offset the savings in production cost if the industry doesn't eliminate or minimize its usage. For that reason, Florida's main efforts today are concentrated in reducing steam usage and improving bagasse reclaim facilities. The industry is spending large amounts of money for equip- ment to reduce the waste of energy. As to the air pollution, there is no question that the environment has been greatly improved, but the regulatory agencies are establishing new goals by reducing the present allowable emissions for new installations. All in Florida are in favor of stringent emission standards, but unfortunately one cannot do anything without cost. The more industry cleans the air, the more energy is used. Florida's sugar industry believes that the regulatory and enforcing bodies of the Federal, State and County agencies must keep this reality in mind in all their proposals, decisions and actions.
In order to keep costs competitive and to compensate for the rising cost of labor and materials, the production of ethanol for motor fuel is being considered. Tax rebates, grants, guaranteed investment loans, tax credits, etc., have been mentioned as ways to encourage industries to manufacture ethanol out of renew- able sources but it must be recognized, the production of ethanol has to be based on a raw material which is available throughout the year at relatively competitive prices, so that in the future, when the financial incentives expire, the industry will remain competitive. Besides the economic point of view, ethanol pro- duction brings with it another problem; the economic disposal of the stillage (vinasse). Up to now, the only method of disposal that has been found to be feasible is to concentrate the vinasse and to mix it with molasses as a molasses extender, but the market is very limited. As to other ideas of burning the concen- trated vinasse in special furnaces and operating the distillery with the steam obtained from its combustion, no case in which the vinasse is burned on a commercial basis is known by the Florida industry. In brief, one can say that economic utilization of the vinasse is the final key to economic justification of ethanol production.
3
For the first time in several years, world sugar consumption is estimated to exceed production; and, during the middle of 1979, prices began rising. They reached a high of 29 cents a pound during February 1980, but now they have settled back to about 20 cents a pound. Among the factors that created this situ- ation are weather and sugar cane disease problems that have hurt crops in the Soviet Union, Cuba, Thailand, Peru and Mexico. In addition, Brazil, due to its huge alcohol program, was not able to increase its sugar production.
High Fructose Corn Syrup continues to make inroads into the sugar market. After a 30 percent increase in 1979, the shipments during 1980 are expected to exceed 1,800,000 tonnes, dry basis; due in great part to the decision of a major soft drink producer to allow the use of up to 50 percent of H.F.C.S. in its cola drink. During 1979, the total deliveries of sugar to domestic users amounted to 9,685,000 tonnes or a decrease of 115,200 tonnes from 1978 deliveries.
About two and a half years ago, and due to the low price of sugar, the majority of the Florida sugar companies decided to increase raw sugar storage capacity. They also formed the Florida Sugar Marketing and Terminal Association to sell their sugars jointly and in an orderly manner. To increase flexibility in marketing, the Association built and is now operating a deep water loading and shipping terminal. Florida producers are now able to ship sugar by barge to Northeast refineries at competitive prices, something that they could not do before due to the prohibitive railroad freight rates. The Terminal has a 19,800 tonne warehouse and it is capable of loading vessels at an average rate of 540 tonnes per hour. This year, over 450,000 tonnes will probably be shipped.
There is no doubt that, without these decisions and facilities, the financial results of the last three Florida crops would have been entirely different. The Florida Sugar Marketing and Terminal Associ- ation is now selling and shipping sugars from both the 1978/79 and 1979/80 crops at very attractive prices.
4
THE USE OF TRICHLORFON TO IDENTIFY INSECTICIDE-RESISTANT SWEET SORGHUM CULTIVARS 1/
D. M. Broadhead, K. C. Freeman and N. Zummo2/
ABSTRACT
We routinely spray methyl parathion (0,0-dimethyl-O-p-nitrophenyl phosphorothioate) on sweet sorghum (Sorghum bicolor (L.) Moench) plants to select cultivars that are resistant to leaf injury from insecti- cides such as methyl parathion and toxaphene (chlorinated camphene). In an attempt to find a less toxic chemical that would identify insecticide-resistant sweet sorghum cultivars, a field experiment was con- ducted to compare methyl parathion and trichlorfon [Dimethyl (2, 2, 2-trichloro-l-hydroxyethyl) phosphon- ate] for leaf injury to young sweet sorghum plants. Methyl parathion and trichlorfon were equally effective for identifying insecticide-susceptible and resistant cultivars of sweet sorghum. However tri- chlorfon has much lower mammalian toxicity than does methyl parathion and is less hazardous to applicators and persons entering exposed areas.
The leaves of some sweet sorghum (Sorghum bicolor (L.) Moench), cultivars such as 'Brandes' and 'Honey', are severely injured by the drift of insecticides such as methyl parathion (0, O-dimethyl-0- p-nitrophenyl phosphorothioate) and toxaphene (chlorinated camphene) applied to other nearby crops (3, 6, 8 ) . Coleman and Dean (4) reported that resistance in sweet sorghum to methyl parathion is controlled by a single dominant gene. Sweet sorghum cultivars with resistance to leaf injury from several insecti- cides such as methyl parathion and toxaphene have been released to growers (1, 2, 5 ) . We use methyl para- thion to identify insecticide-resistant cultivars. However, methyl parathion is highly toxic and potent- ially hazardous to applicators and persons entering the exposed area for three days after application.
In an attempt to find a less toxic chemical that would identify insecticide-resistant sweet sorghum cultivars, we compared the effect of methyl parathion and trichlorfon [Dimethyl (2, 2, 2-trichloro-l-hydro- xyethyl) phosphonate] on young sweet sorghum plants.
MATERIALS AND METHODS
Eight cultivars of sweet sorghum were planted May 8, 1979 at Meridian, Mississippi in a randomized block design with split plots and four replications. The main plots (insecticides) were eight rows x 6.4 m long. Subplots (cultivars) were one row and were 6.4 m long. The seed were planted in hills 60 cm apart and after emergence the plants were thinned to four per hill. One month later, the plants were sprayed with trichlorfon (80 percent wettable powder) or methyl parathion (emulsifiable concentrate) at active ingredient rates of 0.93 and 0.56 kg/ha, respectively. Three border rows were planted between each insecticide treatment to reduce drift hazards. The insecticides were applied in water with a tractor mounted sprayer calibrated to apply 187 1/ha of the solution on a 52 cm width band over the plants. Three days after the insecticides were applied, the first 20 plants from each sub-plot were rated for insecticide leaf injury (9).
Data from the above experiment was evaluated by analyses of variance and where data is presented with more than two means, significance among means were determined by Duncan's multiple range test.
RESULTS AND DISCUSSION
Cultivars that receive an average leaf injury rating of three or more are considered to be highly susceptible to injury from insecticide and are usually discarded. The average leaf injury rating for all cultivars was similar for trichlorfon and methyl parathion (Table 1 ) . The highly susceptible cultivars, Brandes and Honey, received similar injury ratings of three or more with both insecticides. The insecti- cide treatment x cultivar interaction was highly significant. However, the highly resistant cultivars, 'Theis' and 'Wiley', received the lowest injury rating, whereas the highly susceptible cultivars, Brandes and Honey, received the highest leaf injury rating. The slight difference in cultivar response to the two insecticides did not affect the identification of susceptible and resistant cultivars.
These data show that trichlorfon can be successfully used to identify insecticide-susceptible sweet sorghum cultivars. Trichlorfon is considerably less toxic and hazardous to applicators and persons entering the exposed area than methyl parathion (7).
1/ Cooperative investigations of AR, SEA, USDA, Sugar Crops Field Station, Meridian, MS 39301 and Mississippi Agric. and Forestry Experiment Station, Mississippi State, MS 39762.
2 / Research agronomists and research plant pathologist, respectively, AR, SEA, USDA, Sugar Crops Field Station, Meridian, MS 39301.
5
Table 1. The reaction of sweet sorghum to trichlorfon and methyl parathion.
Treatment Rating**
Cultivar Trichlorfon Methyl
Theis 0.5 a+ 1.4 bcd
Wiley 1.1 b 1.3 bc Mer. 76-5 1.3 bc 1.8 cd Rio 1.3 bc 1.9 d MN 1500 1.5 bcde 2.0 e Dale 1.6 bcde 2.0 e Brandes 3.0 f 3.0 f Honey 3.5 f 3.0 f
+ Values with the same letter are not significantly different at the 1% level of probability by Duncan's multiple range test.
** Leaf injury rating scale:
0 = Evaluation not possible (no leaf injury).
1 = Resistant; leaf injury is hardlv apparent or present in certain plants only.
2 = Heavy attack; more than 50? of the plants show low intensity leaf injury; not of economic importance apparently.
3 = Severe attack;100% of the plants are affected; destroyed leaf area can be up to 25%; the disease seems to be of economic importance.
4 = Same as 3, but destroyed leaf area is more than 25%.
REFERENCES
1. Broadhead, D. M., 0. H. Coleman, K. C. Freeman and N. Zummo, 1974. Theis, a n e w variety of sweet sorghum for sirup production. Miss. Agric. and For. Exp. Stn. Research Highlights 37(5).
2. Broadhead, D. M., K. C. Freeman and N. Zummo, 1978. Wray, a new variety of sweet sorghum for sugar production. Miss. Agric. and For. Exp. Stn. Research Highlights 4(1).
3. Coleman, 0. H., J. L. Dean and D. M. Broadhead, 1961. Insecticide damage to sorgo. Sorghum News- letter 4:32-33.
4. Coleman, 0. H. and J. L. Dean, 1964. Inheritance of resistance to methyl parathion in sorgo. Crop Science 4:371-372.
5. Coleman, 0. H., W. R. Cowley, D. M. Broadhead, K. C. Freeman and I. E. Stokes, 1965. Rio, a new disease-resistant variety of sweet sorghum for southern U. S., ARS 34-72, 4 p.
6. Coleman, 0. H. and D. M. Broadhead, 1968. Brandes, a new variety of sweet sorghum for sirup production in Mississippi. Miss. Farm Res. 31(4).
7. Farm Chemicals Handbook, 1979. Meister Publishing Co., Willoughby, Ohio 44094.
8. Wiebe, G. A. and J. D. Hays, 1960. The role of genetics in the use of agricultural chemicals.
Agron. J. 52:685-686.
9. Zummo, N., 1971. Foliage diseases of sweet sorghum. 7th Biem. grain sorghum research and utilization conf. p r o c , Grain Sorghum Proc. A s s o c , Lubbock, TX, pp. 80-83.
6
LOSSES CAUSED BY DIATRAEA SACCHARALIS IN FLORIDA Modesto Ulloa1/, M. G. Bell2/ , and J. D. Miller2/
ABSTRACT
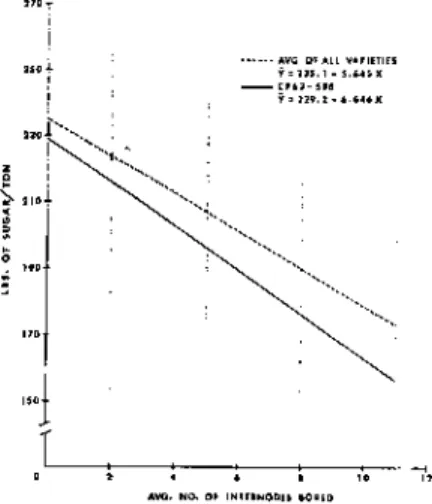
Losses due to the sugarcane borer, Diatraea saccharalis, (Fab), were measured in 5 varieties by splitting a total of 2200 cane stalks and classifying them for number of internodes bored. The samples with varying numbers of internodes bored were weighed, milled, and the juice analyzed. Data were collected on each sample for Brix, sucrose, purity, sugar per ton of cane, average stalk weight, and juice extraction. Linear regression analysis averaged over all varieties showed reductions in all characters studied as the number of internodes bored increased. An average of one bored internode per stalk reduced sugar per ton of cane by 5.645 pounds on the average of the 5 varieties tested and 6.646 pounds in CP 63-588. The amount of sugar lost varied among varieties with CP 56-59 and CP 65-357 having about half the loss of CP 63-588 and CL 59-1052.
INTRODUCTION
The sugarcane borer, Diatraea saccharalis, is one of the most important insects in the Florida sugar industry. Losses caused by sugarcane borer include dead hearts (8), that reduce the number of millable stalks per unit area, sucrose losses caused by the primary damage of the larvae boring the stalks, and secondary damage caused by microorganisms that enter the stalk through the borer hole. Sugarcane borer damage data usually has been expressed as percent loss in either sucrose or sugar per ton of cane per percentage increase in bored internodes. The percentage internode damage has been determined either by splitting the stalks longi- tudinally or by correlation between stalk infestations and percent joint infestation for a specific area by counting the number of borer entry holes (1). The later system could be useful in order to save labor for an area evaluation. Ellis et al (3) used the number of bored joints per unit weight of cane when working with varying productivity levels and different varieties. It was found that comparison studies based on percentage internodes bored were sometimes misleading because different portions of the stalks vary in sucrose level and borer damage was usually not randomly distributed up and down a stalk (13). Estimates of sugar losses due to the sugarcane borer varied from 30.3 lbs. of sugar per acre for each 1% increase in bored internodes (6), to 0.75% sugar per acre loss per 1% increase in bored internodes (13). In Cuba, Barreto (2) found a reduction of 0.02329% sucrose per 1% increase in bored internodes and in Mexico, Ruiz et al (9) estimated a loss of 1.68 lbs.
of sucrose per 1% increase in bored stalks. These values indicate that losses due to the sugarcane borer can vary enormously. These values are useful economic standards that are needed to evaluate the amount of borer damage that occurs in the Florida sugar industry.
The initial objective of this study was to try to correlate sucrose yields on a field basis with yields obtained from small samples, which had been analyzed for borer damage. After only a few samples were collected, the objective was changed to try to assess the effect of sugarcane borer damage on sucrose yields and to correlate other stalk characteristics with borer damage within and among varieties.
MATERIALS AND METHODS
Sampling procedures used for the initial samples were to collect 100 random whole stalks from each end of the field after it had been hand cut. Later, stalks were selected to insure a representative number of stalks in each damage class. The millable portion of the stalk was considered the sampling unit from which the comparisons were made. The one hundred stalk samples were brought to Canal Point where they were sectioned longitudinally. They were then classified into five classes. Class 1 contained no bored internodes, class 2 contained from one to three bored internodes, class 3 contained from four to six bored internodes, class 4 contained from seven to nine bored internodes and class 5 contained from ten to twelve bored internodes. An internode was classified as bored if a borer tunnel penetrated the area between the two nodes. Varieties sampled in this test were CP 56-59 three samples, CL 59-1052 four samples, CP 63-588 eleven samples, CP 65-357 three samples, and CP 70-1133 one sample. The data from CP 70-1133 are not shown except in the overall means.
The average numbers of internodes per stalk for varieties were determined and ranged from 19 to 22. CP 56-59, CP 63-588, and CP 70-1133 had an average of 19 internodes, CP 65-357 had an average of 21 internodes, and CL 59-1052 had an average of 22 internodes per stalk.
The characters studied in this test were average stalk weight, juice extraction (obtained by dividing juice weight by total sample weight), Brix (obtained by hydrometer), sucrose (obtained from Schmitz's table in Spencer and Meade (1)) with the use of Brix and pol), purity (obtained by dividing sucrose by Brix), and sugar per ton of cane that was obtained by applying the appropriate variety correction factors of .96 for CP 56-59 and CP 65-357, .98 for CP 70-1133 and 1.00 for CP 63-588. Variety, CL 59-1052 was assumed to have a 1.00 variety correction factor for this test. The data was analyzed by linear regression analysis as outlined in Steele and Torrie (11).
RESULTS AND DISCUSSION
The regression coefficients for the six characters studied regressed on the number of internodes bored by Diatraea saccharalis in four sugarcane varieties are presented in Table 1.
1/ New Hope Sugar Company, Pahokee, Florida
2/ USDA, ARS, Sugarcane Field Station, Canal Point, Florida 7
Table 1. Regression coefficients* (b-values) for 6 characters regressed on the number of internodes bored by Diatraea saccharalis in 4 sugarcane varieties.
Variety Mean Cp CL CP CP all
Character 56-59 59-1052 63-588 65-357 varieties
Brix (degrees) -0.199 -0.356 -0.323 -0.090 -0.274 Sucrose (%) -0.245 -0.424 -0.410 -0.140 -0.349 Purity (%) -0.333 -0.593 -0.794 -0.369 -0.656 Sugar/ton (lb/ton) -3.739 -6.744 -6.646 -2.300 -5.645 Stalk wt. (lb) +0.018 -0.036 -0.027 -0.022 -0.026 Extraction (%) -0.8 -0.5 -0.2 -0.3 -0.3
* The regression coefficient means that for each unit change in the number of bored internodes there would be a corresponding change in the character by the amount listed. For example an average of 2 bored internodes per stalk of CP 63-588 would reduce sugar yields by 13.3 lbs. per ton.
The regression coefficients are the best estimates to determine if differences exist among varieties in their response to the sugarcane borer. The performance of the four varieties fell into two groups. Varieties CL 59-1052 and CP 63-538 generally tended to have about the same performance with respect to most of the characters and CP 65-357 and CP 56-59 responded very similarly. The samples of CP 65-357 may not have been very representative of this variety due to the excessive number of broken stalks caused by hurricane David.
In the other varieties damage was less severe and whole stalks were selected in all cases.
Probably the most significant figures in Table 1 are the sugar losses in pounds per ton of cane. An increase of an average of one bored internode per stalk in CP 63-588 and CL 59-1052 cost the grower about 6.6 lbs. of sugar per ton of cane, whereas in CP 65-357 and CP 56-59 the values ranged from 2.3 to 3.7 pounds of sugar/ton of cane, respectively. Ruiz et al. (9) reported a loss of 1.68 lbs. of sugar/ton for each 1% increase in bored internodes which was higher than the values 1.13 lb. of sugar/ton that are reported here when figured on a 1% increase in bored joints. However, they had damage from four species of cane borers so damage might be expected to be higher under those conditions. Hensley and Long (4) also reported differences in cane yield among varieties but they did not examine the sucrose content of bored stalks. It was beyond the scope of this paper to examine the reasons for this difference in loss among varieties and this area needs addi- tional research. If losses are averaged over all varieties the figure to be used would be 5.645 pounds of sugar per ton of cane for each bored internode. Sugar losses defined as percent sucrose lost per 1% in- crease in bored internodes were reported by several workers (2,3,5,9) and ranged from .02329% in Cuba to .854% in the Dominican Republic. These values compare with a .0698% sucrose loss obtained in this experi-
Losses were not confined to reduced sugar per ton of cane but also showed up as reduced stalk weight.
Averaged over all varieties, one bored internode per stalk reduced the average stalk weight by 0.026 pound.
If you assume 20,000 stalks per acre that would be approximately one quarter ton of cane per acre loss due strickly to reduced stalk weight. Mathes et al. (7) reported that 40% of the losses due to borers in Loui- siana were due to reduced stalk weight.
Sugarcane borers also cause losses in the reduced extraction. On the average, extraction was reduced by .3 of one percent per bored internode per stalk. This could be caused by the cane simply drying out.
Ellis et al (3) also reported a decrease of 1.53% in juice extraction for each 1% increase in bored inter- nodes. They also reported increased fiber content in bored stalks which help account for the loss in ex- traction.
8
Figure 1. Pounds of sugar/ton of cane regressed on the average number of internodes bored per stalk for CP 63-588 and the regression line based on the average of all varieties.
Figure 1 shows the distribution of the individual data points that go into the making up the regres- sion line of pounds of sugar per ton of cane on number of internodes bored for all varieties. There was a wide distribution of sugar content within the samples evaluated. Within the variety, CP 63-588 sugar con- tent ranged from 214 lbs. per ton of cane to 268 lbs. of sugar per ton of cane for the clean samples. An- other very interesting point about the graph is the linear effect shown by the distribution pattern regard- less of the intitial sucrose levels in the samples. The amount of sucrose lost per bored joint was approxi- mately the same regardless of the sucrose content. An example of the goodness of fit of the regression line for CP 63-588 and for the regression line for the composite sample are the very high R2 values for each of the lines. For example, R2 values for the regression line for all of the varieties based on the mean of each class of bored joints accounted for 98.7% of the variation in sugar per ton of cane.
An example of how an individual farmer might utilize this data is given in Table 2.
Table 2. Expected sugar losses (lbs/acre) in CP 63-588 with varying levels of sugarcane borer infestation and cane yields.
Average number Expected yield of cane in tons/acre of bored
internodes/
stalk 20 40 60
1 133 266 399 3 399 793 1196 5 665 1329 1994 7 930 1861 2791
9
A grower could sample his fields to determine the average number of bored internodes per stalk and based on his expected yield from that field in tons of cane per acre go into the table and determine his losses on a per acre basis. For example, if a grower had a field that was expected to yield 20 tons of cane per acre and had an infestation of borers that averaged one internode per stalk he could expect to lose 133 pounds of sugar which amounts to $26.60 per acre based on a price of sugar of 20 cents per pound. The same amount of infes- tation in a 60 ton cane field would cost him $79.80 per acre. So the economic threshold for the damage caused by the sugarcane borer varies greatly as cane yield varies. This data indicates that it's much more economical to control borers in high tonnage fields at lower rates of infestation than in low tonnage fields at higher rates of infestation since the amount of chemicals utilized is the same regardless of the tonnage being pro- tected. One more example: if a 60 ton field had an average of three bored internodes per stalk it would cost that grower at least $239.00 per acre in sugar loss. Hopefully, no growers have that degree of damage in high tonnage fields. Summers et al. (12) also presented a method for determining economic losses to the sugar- cane borer, but more importantly, also discussed methods of field monitoring for the sugarcane borer.
The purpose of this study was not to promote insecticidal control of the sugarcane borer, but simply to quantify the amount of damage they are causing in bored stalks. Some mechanism is needed to obtain better information on losses caused by the sugarcane borer on a industry wide basis in Florida.
REFERENCES
1. Bangdiwala, I. S., L. F. Martorell, S. Medina-Gand, and A. C. Miret. 1953. Further studies in correlation between stalk and joint infestation by sugarcane moth-borer, Diatraea saccharalis (Fab) in Puerto Rico.
Proc. ISSCT 12:1373-1382.
2. Barreto, R. 1954. Perdidas da saccarosa en canas de azucar danadas por el borer, Diatraea saccharalis, Fab. Memoria Anual de la Asociacion de Tecnicos Azucareros de Cuba. 28:35-39.
3. Ellis, T. 0., P. E. Roorhig, and G. Arceneaux. 1959. Stalk borer damage as affecting available sucrose in mill cane. Proc. ISSCT 10:924-938.
4. Hensley, S. D., and W. H. Long. 1969. Differential yield responses of commercial sugarcane varieties to sugarcane borer damage. J. of Econ. Entomol. 62:620-622.
5. Martorell, L. F., and I. S. Bangdiwala. 1953. Sucrose content of sugarcane as affected by moth-borer (Diatraea saccharalis Fabricus) infestation. Proc. ISSCT 8:602-614.
6. Mathes, R., R. J. Baum, and L. J. Charpentier. 1965. A method of relating yields of sugar and sugarcane borer damage. Proc. ISSCT 12:1388-1396.
7. Mathes, R., W. J. McCormick, and L. J. Charpentier. 1968. Components of aggregate crop loss caused by the sugarcane borer. Proc. ISSCT 13:1296-1299.
8. McGuire, J. U., R. Mathes, and L. J. Charpentier. 1965. Sugarcane yields affected by borer infestation and position of injury on the stalk. Proc. ISSCT 12:1368-1372.
9. Ruiz, M. A., A. Martinez, and S. Flores. 1968. Statistical estimation of sugar losses due to borer attack. Proc. ISSCT 13:1292-1295.
10. Spencer, C. L., and C. P. Meade. 1945. Cane Sugar Handbook, 8th ed. John Wiley and Sons, Inc. New York. 843 p.
11. Steel, R. G. D., and J. H. Torrie. 1960. Principles and Procedures of Statistics. McGraw-Hill Book Company, Inc. New York. 481 p.
12. Summers, T. E., J. R. Orsenigo, and G. Kidder. 1977. Field monitoring to determine threshold of economic loss due to the sugarcane borer, Diatraea saccharalis. Proc. ASSCT 6:148-149.
13. William, J. R., J. R. Metcalfe, R. W. Mungomery, and R. Mathes. 1969. Pest of Sugar Cane. Elsevier Publishing Company. New York. 568 p.
10
SUGARCANE LAND VALUATION: A COMPUTERIZED APPROACH Jose Alvarez and Ben Abbitt1
ABSTRACT
Sugar cane operations are complex agricultural investments. The decision on whether or not to buy acreage requires an assessment of several forces which may change in the future. The presentation offers a flexible procedure for estimating the effect of such parameters as appreciation in land values, changes in the expected income from future sugar yields, the level of desired rates of return on investment, mortgage credit terms and income tax levels on the amount that can be paid for the acreage.
Potential buyers can use their own projections concerning an uncertain future to help them estimate the maximum payable. The estimated maximum bid price for sugar cane acreage may be higher or lower than the price at which it is being offered for sale. If the estimated price is higher than the asking price, and the buyer is content with his own estimates of the future returns in sugar cane, the purchase should be made. If, as frequently happens, the estimated bid is lower than the asking price, the input data may be changed until the model reproduces the asking price. This indirect procedure makes it plain what the con- ditions will have to be in the future if the asking price is to be paid.
INTRODUCTION
About 300 thousand acres of land in the 700,000-acre Everglades agricultural area (EAA) are devoted to sugarcane (Saccharum spp.) production. Historically, land ownership has been relatively stable in this industry. However, since the expiration of the Sugar Act in 1974, fluctating prices and unstable incomes have led to some tracts of sugarcane land being offered for sale in the open market.
An appraisal of the land for valuation is usually made by the buyer entering the market. The traditional approach for estimating land values is given by the formula:
V = 1/r,
V = estimated land value, I = expected net income to land; and r = desired rate of return.
The simplest application of the formula conveys the assumption of returns continuing into perpetuity (1).
In the case of land devoted to sugarcane, net income to land results from projected yields times the prices expected in the future, minus the expected costs. If for example, an acre of Everglades muck land planted to sugarcane is expected to net $200 per acre into the future, and the prospective buyer is willing to invest in this acreage if he can make 12 percent on his money, then he could afford to pay $1,667 per acre (200/12).
Prospective investors in sugarcane acreage would like to be able to measure the effect of several other variables not included in the traditional approach. Lee and Rask (2) have developed a formula that allows the inclusion of factors such as possible changes in net income over time. Possible future land appreciation, impact of financial terms, and income and capital gains taxes effects. The formula to account for these effects is much more complex but can be solved easily with a computer.
METHODOLOGY
The expanded approach for solving the land purchase decision is expressed with the following formula:2
n = buyer's planning horizon (years income from the land is expected);
ANI = expected annual net incomes per acre (gross income minus total costs) before taxes;
GNI = expected annual rate of growth in net returns per acre;
MTR = buyer's marginal income tax rate (federal tax rate based on estimated taxable income after the parcel is purchased);
DP = proportion of the purchase price paid down on the mortgage;
IR = nominal rate of interest charged on the mortgage;
t = amortization period on the loan;
INF = expected annual rate of inflation in land values; and
T* = tax rate that will apply to capital gains income in year n when the parcel is sold.
In this approach annual net incomes (ANI) are estimated for the future, modified by any trends (GNI), and discounted back to the present at the rate of return (CC) that the buyer desires. The effect of income taxes (MTR) is taken into account, as is the rate of interest (IR) on borrowed money over the period of the loan(t). The asking price (average price per acre from recent sales of comparable parcels) for the acreage (P) becomes the base upon which any land appreciation (INF) is calculated. The land is assumed to be sold at the end of the planning period (n), and taxed at the capital gains rate (T*). The solution is the maximum price that could be paid for the land, with the values as specified for the eleven different variables.
Some words of caution are in order. First, the reliability of the answer depends on the reliability of the figures provided by the user. Unrealistic projections about the future generate invalid answers. Second, although net income per acre (ANI) is assumed to be stable, reality has shown it highly variable in recent years due to changing sugar prices. This fact may lead to an over-estimation of mortgage repayment ability.
Finally, the model requires that the amortization period of the loan (t) be equal or less than the buyer's planning horizon (n).
A Purchase Decision Example for the EAA
Assume a prospective buyer is considering the purchase of Everglades muck land suitable for sugarcane production. His current financial standing and per acre expectations are represented by:
p = $l,500/acre DP = 29%
CC 12% IR 12%
n 15 years t 10 years ANI = $200/acre INF = 0%
GNI 0% T* 20%
MTR 30%
If these conditions hold, he could pay $1,429 per acre (P*) and still realize a 12 percent after-tax return on his investment over the 15 year period. The buyer can not afford to pay $1,500 per acre (P) if he is going to achieve his 12 percent desired after-tax rate of return (CC). The traditional approach produced an answer of $1,667, which overvalues the land and therefore exacerbates the problem.
Sensitivity Analysis
Since the estimated bid price ($1,429) is relatively close to the asking price ($1,500), the prospective buyer may want to examine how changes in the assumptions regarding the input variables effect the maximum bid price. The values used in the purchase decision example were fixed at the specified levels while the variable being examined was changed to values within a reasonable range. Although this procedure adds great flexibility to the model, it must be recognized that changing any variable will either almost certainly induce endogenous changes in others (e.g., ANI and MTR), or external circumstances which change a variable will probably alter others at the same time (e.g., INF, IR, CC, etc.). The prospective buyer should incorporate these changes according to his situation and predictions since the model can handle variations in several variables at the same time.
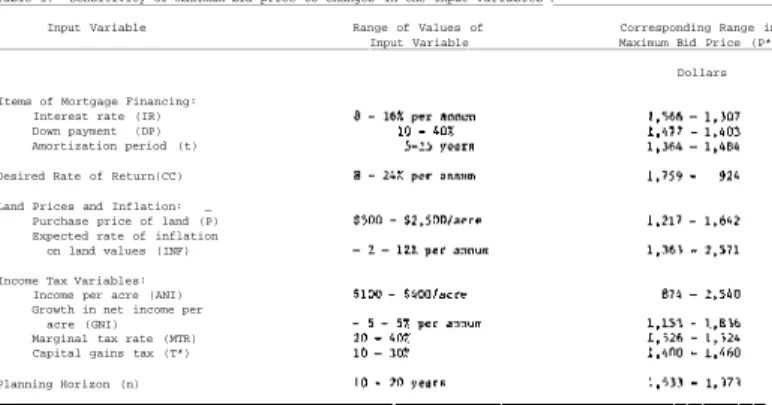
Table 1 shows P* values over the range for which each variable was examined. They provide some insights about the power of a particular variable to influence the amount that could be paid for the sugarcane acreage under consideration. For example, variables like DP and T* exert a minimum influence on the bid price while ANI and CC appear to be responsible for the greatest responses. However, since three units of measurement
(dollars, percentages, and years) are involved, further examination of the results is needed to avoid mis- interpretation.
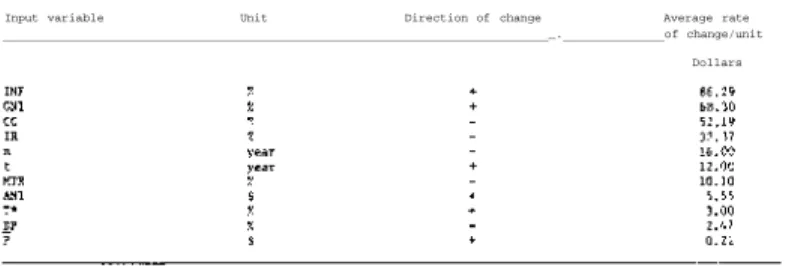
To aid in the interpretation of results, the average rate of change in the maximum bid price due to per unit changes in the input variables were computed (Table 2 ) . Five variables (INF, GNI, CC, IR, and n) exert the greatest effect on p*. For example, for every 1 percent increase in INF, the maximum bid price increases by $86.29. A one percent increase in the expected rate of growth in net returns per acre (GNI) results in a positive S68.30 change in the maximum bid price. A one percent increase in the desired rate of return (CC) brings about a decrease of $52.19 in P* while a similar change in the interest rate (IR) results in a $32.37 decrease in the bid price. An increase in the planning horizon (n) produces a decrease of $16.00 in the maxi- mum bid price for each one year change3.
Five other variables (t, MTR, ANI, T*, and DP) have some effect on the maximum bid price. For every year that the amortization period of the loan (t) increase, P* increases by $12.00 per acre. Per unit changes in MTR, ANI, T* and DP cause a negative $10.00, a positive $5.55, a positive $3.00 and a negative $2.47 change in P*. respectively. The variable P exerts a minimal influence on the maximum bid price.
The above analysis should provide helpful insights to the prospective, buyer. Since the difference 12
between the asking price and the maximum bid price is small ($1,500-$1,429 = S71), he may want to reconsider some of his assumptions. For example, the buyer might want to change his expectations about the future annual growth in net income per acre (GNI). If a 1.04 percent is assumed, the bid price will equal the asking price (1.04 x $68.30 = $71; $1,429 + 71 = $1,500). Other alternatives would include a decrease of 1.36 points in his desired rate of return (CC) - from 12 percent to 10.64 percent; or changing the expected rate of in- flation in land values from zero to .8 percent.
Table 1. Sensitivity of maximum bid price to changes in the input variablesa.
Input Variable Range of Values of Corresponding Range in Input Variable Maximum Bid Price (P*)
Dollars Items of Mortgage Financing:
Interest rate (IR) Down payment (DP) Amortization period (t) Desired Rate of Return(CC) Land Prices and Inflation: _
Purchase price of land (P) Expected rate of inflation
on land values (INF) Income Tax Variables:
Income per acre (ANI) Growth in net income per
acre (GNI) Marginal tax rate (MTR) Capital gains tax (T*) Planning Horizon (n)
Table 2. Sensitivity of maximum bid price to per unit changes in the input variables.
Input variable Unit Direction of change Average rate _. of change/unit
Dollars
However, it should be kept in mind that most of these variables are not independent of each other. The solutions provided by the sensitivity analysis should be considered as good approximations. In the case of a prospective buyer using data portraying his situation and assuming concurrent variable changes, the model provides the best available alternative for analyzing a land purchase decision.
Conclusion
Evaluating a land investment by assigning values to a range of important variables allows the prospective buyer to more carefully analyze his purchase decision than singular use of the traditional valuation approach.
3This negative relationship occurs because of the values assumed for the variables. If we assume, for example GNI = 5 percent and INF = 10 percent, P* goes from $3,551 to S3.591 when n is increased from 10 to 20 years.
13
Maximum bid prices for sugarcane acreages obtained with this model are highly sensitive to assumptions about present arid future annual returns and to land appreciation. Therefore, careful consideration should be given
The Lee-Rask approach only indicates if the investment is profitable or unprofitable. The financial feasibility of the operation is not considered. That is, no analysis of debt repayment capacity is made.
Sugarcane returns have been highly variable over time, so potential investors who determine that a sugarcane land investment would be profitable should also analyze their ability to make mortgage payments in the event of such things as a yield-destroying freeze or a depression in world sugar markets.
14 LITERATURE CITED
(1) Holt, John. 1978. "An old and new approach to the land purchase decision." Paper presented at national extension workshop dealing with risk in farm decision making. Denver, Colorado.
(2) Lee, Warren F. and Norman Rask. 1976. "Inflation and crop profitability: Row much can farmers pay for land?" Amer. J. Agr. F.con. 58:984-989.
PERFORMANCE AND ENERGY CONSIDERATIONS IN MECHANICAL SUGARCANE HARVESTING WITHOUT PREHARVEST BURNING—FLORIDA PROGRESS REPORT
B. R. Eiland and J. E. Clayton-1/
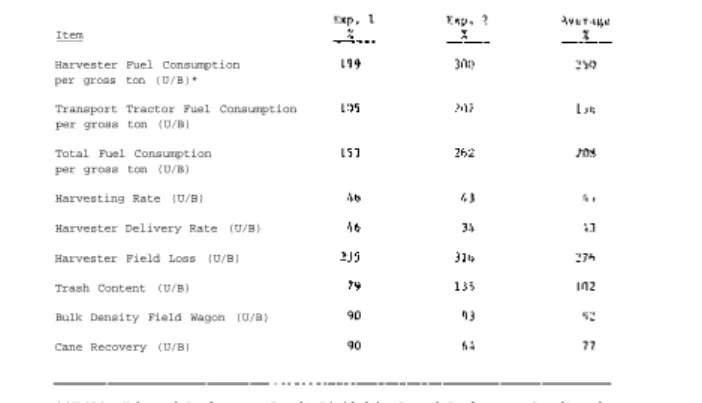
Fuel consumption and performance results of two mechanical harvesting systems were determined in burned and unburned sugarcane in Florida. Two fields with a total of 32 acres were harvested during two experiments. Both fields contained recumbent plant cane and were estimated to yield about 50 gross tons per acre. Approximately one-third of each field was harvested unburned and the remaining two-thirds was burned before harvesting as in normal practice. Harvester operations, hours of operation, and fuel con- sumption of the harvesters and accompanying transport tractors were monitored during harvest. Cane weights, sucrose contents, trash contents,harvesting losses, the number of loaded field wagons and the number of loaded highway trailers or rail cars were determined. Sugarcane bulk densities in field wagons, highway trailers and rail cars, harvesting rates, and harvester delivery rates were calculated from the data. Harvester fuel con- sumption per gross ton of cane averaged 150 percent higher in unburned cane than in burned cane. Harvesting losses averaged 176 percent higher in unburned cane than in burned cane. Transport tractor fuel consumption per gross ton of cane averaged 56 percent higher in unburned cane than in burned cane. Sugarcane bulk density in field wagons in unburned cane was 8 percent less than that in burned cane. Most important, cane recovery per acre in unburned cane was 23 percent less than that in burned cane.
During the past decade, the sugar industry has been criticized for burning sugarcane before harvesting.
Preharvest burning of fields and related harvesting activities were regarded as the prime source of parti- culate pollution in Palm Beach County in 1968 (3). Field burning, which was previously unregulated, is now regulated by restriction to certain daylight hours and by air quality restraints. Field burning is now esti- mated to cause 6,000 tons of particulate pollution per year in Palm Beach County, or about 40 pounds per acre burned (4) .
Industry personnel who are associated with harvesting operations are familiar with problems associated with harvesting unburned cane in Florida. Orsenigo (2) reported on problems in hand harvesting unburned cane and determined production rates for unburned and burned cane. He concluded that 50 percent more workers, 200 percent more continuous loaders, and 50 percent more transport capacity would be needed to harvest unburned cane than to harvest burned cane. Orsenigo also predicted that the additional equipment and transport capacity would increase overall fuel consumption, engine emissions, and maintenance which would require additional oper- ating and maintenance personnel. Mechanical chopper harvesters are used to cut about 30 percent of the sugar- cane crop in Florida. Currently used chopper harvesters are not designed to cut unburned recumbent sugarcane, and data on their performance in harvesting unburned Florida sugarcane have not been reported.
The objective of this study was to determine the performance results and the fuel consumption of two sugarcane harvesting systems operating in unburned and burned cane.
Materials and Methods
Two experiments were conducted on a total of 32.1 acres of recumbent cane in two fields. One field was 0.25 mile long and contained 18.2 acres, and the other was 0.5 mile long and contained 35 acres. However, our mechanical harvesting work was conducted on only 13.9 acres of the large field. In experiment 1, 6.9 acres of cane was harvested unburned, and the remaining 11.3 acres was burned before harvesting. In experiment 2, 5.1 acres of cane was harvested unburned, then the remaining portion of the field on which our mechanical harvesting work was conducted (8.8 acres) was burned before harvesting.
In experiment 1, harvester A was used to cut the cane, and three transport tractors, each towing two cane wagons (515 ft3 each) hauled the cane to a rail siding for transfer into rail cars. There were two sizes of rail cars (2575 and 3224 f t3 each). Harvester A was a single-row, wide-throat harvester mounted on half-tracks and powered by a 190 horsepower engine. In experiment 2, harvester B was used to cut the cane, and three transport tractors, each towing three cane wagons (478 ftJ each), hauled the cane to a transfer station where it was conveyed into highway trailers (2578 f t3 each). Harvester B was a single-row, gathering- type harvester powered by 250-horsepower engine. In both experiments, the towing distance was about 0.75 mile
— B. R. Eiland and J. E. Clayton, Agricultural Engineers, Agricultural Research, Science and Education Administration, USDA, Belle Glade, FL
15
from the field to the transfer station. The horsepower of transport tractors ranged from 100 to 130 but each hauled about the same quantity of cane on each trip to the transfer station. The volume of wagons, rail cars, and highway trailers were determined using their width, effective length and average height. Bulk densities for each type of transport were determined using the total cane weights and the number of units required to carry the cane. This information is necessary to determine the additional number of transport trips required- cant portion of harvesting costs.
For each experiment, fuel tanks of the harvester and each transport tractor were filled before harvesting the unburned cane. They were refilled after harvesting the unburned cane and again after harvesting the burned cane to determine fuel consumption. Hour meters on the transport tractors were read at the beginning and end of each part of each experiment. These hour meters operate on engine revolutions where 1 hour represents the engine operating at 2400 revolutions per minute. (Slower engine speeds take proportionately longer than 1 hour to advance the meter 1 hour). The tractors operate at low engine speeds during much of the transport operation.
As a result, tractor hours are not identical to harvester hours which are from the time study.
Recoveries of unburned and burned cane in each experiment were determined from gross cane weights measured at the sugar mill for the area harvested. The sucrose content was determined from routine samples taken and analyzed at the sugar mill. Preharvest burning has been reported to lower the sucrose content of cane.
Two hundred pound samples of cane for trash determinations were taken from the harvester at random locations in the field. The samples were weighed and hand stripped, and then the resulting trash was weighed. The trash content was calculated from the trash weight and gross sample weight. The trash content in the unburned and burned cane was determined four times each in experiment 1 and three times each in experiment 2. Unrecovered cane was picked up from a randomly selected row area 50 feet long and 5 feet wide outside the opening area.
This cane was weighed and the harvester loss per acre was calculated from the cane weight and the size of the area sampled. During each experiment, harvester losses were determined four times during unburned cane harvesting and four times during burned cane harvesting.
A time study was conducted on the operation of the cane harvester during each experiment. The time for each operation such as cutting, turning, waiting for wagons, changing wagons, stopping for unclogging, reversing, maintenance and miscellaneous causes was recorded. Miscellaneous causes were assigned for instructions, for operator breaks other than lunch, and for sampling interference with normal harvesting.
Based on data from the time studies and from cane recoveries, harvester delivery rates and actual harvest- ing rates were determined for unburned cane and burned cane in each experiment.
An adjacent field of similar cane in experiment 1 and the remaining part of the field in experiment 2 were burned and cut by hand. The resulting yields and sucrose contents are reported to compare with those obtained in these experiments.
Results and Discussion
In experiment 1, cane recovery from the 6.9 acres of cane harvested unburned was 46.9 gross tons per acre and the recovered cane contained 6.56 percent trash. A total of 52.3 gross tons per acre was recovered from the 11.3 acres of cane harvested burned, and the recovered cane contained 8.26 percent trash. Assuming that the field was uniform in yield over the entire area harvested, this difference represented a loss of 4.2 net tons of cane per acre when the cane was cut unburned. Harvester losses of 6.1 tons per acre in unburned cane and 2.6 tons per acre in burned cane accounted for most of the difference between cane recovered from unburned and from burned cane. The hand-cut adjacent field of the same sugarcane variety had a recovery of 53.4 tons of cane per acre. Sucrose content was 14.25 percent in the mechanically cut cane and 15.26 percent in the hand-cut cane. These results show that mechanical harvesters can recover almost the same amount of cane as in hand-cut operations but the sucrose content is lower in the mechanically harvested cane when compared to the
Harvester A in experiment 1 consumed 0.223 gallon of diesel fuel per gross ton of unburned cane and 0.112 gallon of diesel fuel per gross ton of burned cane. It operated 11.5 hours in unburned cane and 9.6 hours in burned cane. The transport tractors consumed 0.115 gallon of diesel fuel per gross ton of unburned cane and 0.109 gallon of diesel fuel per gross ton of burned cane. Hour meters on the transport tractors showed 20 hours of operation in unburned cane and 22.8 hours of operation in burned cane. Total fuel consumption per net ton of cane by harvester A and the transport tractors was 0.362 gallon in unburned cane and 0.242 gallon in
Results of the time study for experiment 1 (Table 1) revealed that approximately the same percentage of time was spent in cutting cane, waiting for wagons, changing wagons, and for miscellaneous causes in both the unburned and burned cane. Turning required a higher percentage of time in harvesting burned cane than in harvesting unburned cane because the harvester traversed the field twice as fast in burned cane as in unburned cane. Peversing and stopping (indications of clogging) required a total of 7 percent of the time in unburned cane, whereas practically no reversing and stopping was necessary in burned cane. The harvester reversed 10.3
16
times per acre in unburned cane and only 0.2 times per acre in burned cane. Clogging is the accumulation of material within the harvester that prevents normal delivery of cane by the harvester. An additional 6 percent of the operating time was used for operator maintenance (unclogging and replacing shearbolts) in harvesting unburned cane, but only 1 percent was used for operator maintenance in harvesting burned cane. The cutting of both unburned and burned cane utilized two-thirds of the available field time, exceeding that of commercial practice. Little time was spent waiting for wagons, indicating that the field transport and transfer system had sufficient capacity for the harvester. Mired tractors caused downtime during field opening. Field opening occurs when the harvester makes the initial pass through the field and field transport must run down standing/
cane. Usually a field is opened for each 60 rows. After several passes by the harvester, the field is con- sidered opened for harvesting. The field transport tractors could not pull as effectively during field opening of the unburned cane as in field opening of the burned cane. While harvesting unburned cane, a hydraulic pump on harvester A worked loose and added to the downtime.
Table 1: Amount and percentage of Time for Various Operations During Harvesting of Unburned and Burned Sugarcane, Experiment 1, Belle Glade, Florida
Cutting Turning Waiting for Wagons Reversing
Stopping for Unclogging Changing Wagons Operator Maintenance Miscellaneous
Total
Downtime Lunch Breaks Burning
Harvester A in experiment 1 had a harvesting rate of 28.2 gross tons per hour in unburned cane and 61.1 gross tons per hour in burned cane. The harvesting rate in unburned cane was 46 percent of that in burned cane. The delivery rate, based on actual cutting time and on cane recovered, was 41.5 tons per hour in un- burned cane and 89.8 gross tons per hour in burned cane. The delivery rate for unburned cane was also 46 per- cent of that of burned cane. The harvester loaded 60 field wagons with unburned cane that averaged 5.43 tons each and had a bulk density of 21.0 pounds per cubic foot. It also loaded 98 field wagons with burned cane that averaged 6.01 tons each and had a bulk density of 23.4 pounds per cubic foot. Seven large rail cars were loaded with unburned cane that averaged 35.6 tons each and had a bulk density of 22.1 pounds per cubic foot.
Twelve large rail cars were loaded with burned cane that averaged 37.4 tons each and had a bulk density of 23.2 pounds per cubic foot. Three small rail cars were loaded with unburned cane that averaged 27.8 tons each and had a bulk density of 21.6 pounds per cubic foot. Seven small rail cars were loaded with burned cane that averaged 27.5 tons each and had a bulk density of 21.4 pounds per cubic foot.
In experiment 2, 29.6 gross tons of cane was recovered from the 5.1 acres harvested unburned, and the recovered cane contained 11.18 percent trash. A total of 49.0 gross tons per acre was recovered from the 8.8 acres harvested burned, and the recovered cane contained 8.97 percent trash. The difference between the trash contents (5) in unburned and burned cane was more typical of chopper harvesters than that in experiment 1.
Assuming that the field was uniform over the area harvested, this difference represented a loss of 18.3 net tons of cane per acre when the cane was cut unburned. Harvester losses of 4.4 tons per acre in unburned cane and 1,4 tons per acre in burned cane did not account for the tremendous difference between cane recovered from unburned cane and from burned cane. Harvester loss measured in the approximately 1-acre area where the field was opened Lndicated a loss rate of 30 tons per acre. Therefore if the losses in the opening area were summed with those from the remainder of the unburned field and averaged for the entire 5.1 acres, the total harvester loss would be 9.4 tons per acre, or 5 tons more per acre than originally calculated. Then the unburned cane
17