Application of Big Data: Yield Estimation of Some Major Crops in Bangladesh Utilizing Data Mining and Machine Learning Techniques
BY
Abdullah Al Mamun ID: 172-15-10167
Rifat Jahan Sochy ID: 172-15-10204
This Report Presented in Partial Fulfillment of the Requirements for The Degree of Bachelor of Science in Computer Science and Engineering
Supervised By
Sharmin Akter
LecturerDepartment of Computer Science and Engineering Daffodil International University
DAFFODIL INTERNATIONAL UNIVERSITY
DHAKA, BANGLADESHMay 2021
APPROVAL
This Project titled “Application of Big Data: Yield Estimation of Some Major Crops in Bangladesh Utilizing Data Mining and Machine Learning Techniques”, submitted by Abdullah Al Mamun and Rifat Jahan Sochy to the Department of Computer Science and Engineering, Daffodil International University, has been accepted as satisfactory for the partial fulfillment of the requirements for the degree of B.Sc. in Computer Science and Engineering (BSc) and approved as to its style and contents. The presentation has been held on May 2021.
BOARD OF EXAMINERS
_______________________
Dr. Touhid Bhuiyan Professor and Head
Department of Computer Science and Engineering Faculty of Science & Information Technology Daffodil International University
Chairman
____________________________
Gazi Zahirul Islam Assistant Professor
Department of Computer Science and Engineering Faculty of Science & Information Technology Daffodil International University
Internal Examiner
____________________________
Raja Tariqul Hasan Tusher Senior Lecturer
Department of Computer Science and Engineering Faculty of Science & Information Technology Daffodil International University
Internal Examiner
________________________
Dr. Dewan Md. Farid Associate Professor
Department of Computer Science and Engineering United International University
External Examiner
DECLARATION
We hereby declare that, this thesis has been done by us under the supervision of Sharmin Akter, Lecturer, Department of CSE Daffodil International University. We also declare that neither this thesis nor any part of this thesis has been submitted elsewhere for award of any degree or diploma.
Supervised by:
Sharmin Akter
Lecturer
Department of CSE
Daffodil International University
Submitted by:
Abdullah Al Mamun ID: 172-15-10167 Department of CSE
Daffodil International University
Rifat Jahan Sochy ID: 172-15-10204 Department of CSE
Daffodil International University
ACKNOWLEDGEMENT
First, we express our sincere thanks and appreciation to Almighty God for His divine blessing, allowing us to successfully complete the final thesis.
We really grateful and wish our profound our indebtedness to Sharmin Akter, Lecturer, Department of CSE Daffodil International University, Dhaka. Deep Knowledge & keen interest of our supervisor in the field of “Machine Learning Algorithms” to carry out this thesis. Her endless patience, scholarly guidance, continual encouragement, constant and energetic supervision, constructive criticism, valuable advice, reading many inferior drafts and correcting them at all stage have made it possible to complete this thesis.
Besides, we are also giving Thanks to Mr. Masud Rabbani, Lecturer, Department of CSE, Daffodil International University, His kind interest and profound knowledge in the field of
“Machine learning” helps us a lot to stay focused in this research.
We would like to express our heartiest gratitude to Professor Dr. Touhid Bhuiyan, Professor, and Head, Department of CSE, for his kind help to finish our thesis and also to other faculty members and the staff of CSE department of Daffodil International University.
We would like to thank our entire course mate in Daffodil International University, who took part in this discuss while completing the course work.
Finally, with proper respect, we must appreciate our parents' relentless support and passion.
ABSTRACT
Rice is the staple food of Bangladesh's 135 million people. It accounts for nearly half of all rural jobs, two-thirds of the total calorie supply, and one-half of total protein intake for the average person in the region. In Bangladesh, the rice sector accounts for half of the agricultural GDP and one-sixth of national income. Rice is grown by nearly all of the country's 13 million farm families.
Rice is grown on approximately 10.5 million hectares, a figure that has remained nearly constant over the last three decades. Rice is cultivated on about 75% of the total cropped area and over 80%
of the total irrigated area. As a result, rice is critical to the Bangladeshi people's survival. In our paper, we have worked on different types of rice. They are- Aus, Aman and Boro. We also worked with potatoes. Potato is a major tuber crop in Bangladesh. Potatoes can lower the risk of hypertension, stroke, increases antioxidant activity and prevent diseases. During the winter, potato is widely grown in all of Bangladesh's districts. During 1997-98, 1,36,332 ha of land were used for potato cultivation. To feed its 135 million inhabitants of Bangladesh, it is important to predict the yield of these major crops accurately. There are some weather parameters including humidity, temperature, sunshine, cloud coverage influences the yield of crops. Thus, in our study we aim to predict yield of rice (Aus, Aman, Boro) and potato utilizing Data mining and Machine learning techniques.
We applied 6 regression algorithms to predict the Yield of these crops. We have used- Gradient Boosting Regression, Neural Network Regression, Decision Tree Regression, Random Forest Regression, SVM, Linear Regression and Lasso Regression. Our study also shows that Gradient boosting Regression algorithm performs better than the other six algorithms used in this study to predict the yield of Rice and Potato. Our study will be a baseline study for future work to predict the yield of cereal crops (e.g., rice, and wheat) and potato in Bangladesh.
TABLE OF CONTENTS
CONTENTS
PAGE
Board of examiners i
Declaration ii
Acknowledgements iii
Abstract iv
CHAPTER
CHAPTER 1: INTRODUCTION 1-3
1.1 Introduction1.2 Motivation 1.3 Problem Definition
1.4 Research Question 1.5 Research Methodology 1.6 Research Objective
01-02
02
03
03
03
03
CHAPTER 2: BACKGROUND 4-8
2.1 Introduction 042.2 Related work 04-08
CHAPTER 3: RESEARCH METHODOLOGY 9-17
3.1 Introduction 093.2Data Collection 10
3.3 Preprocessing 11
3.4 Dataset 11-12 3.5 Algorithm Selection 12-13 3.6 Algorithm Implementation 13
3.7 Statistical Analysis 14-17
3.8 Evaluation 17
CHAPTER 4: RESULT COMPARISON AND DISCUSSION 18-26
4.1 Introduction 18 4.2 Result, Comparison and Analysis 18-26CHAPTER 5: CONCLUSION AND FUTURE WORK 27-28
5.1 Conclusion 27 5.2 Future Work 27 5.3 Limitation 28APPENDIX 29
a. Data collected from Agricultural website 29REFERENCES 20-31
PLAGIARISM 32
LIST OF FIGURES
FIGURES PAGE NO.
Figure 3.1.1 Methodology diagram
9
Figure 3.3.1 Most significant Parameter 11
Figure 3.7.1 Aman Real vs. Aman Predicted 14 Figure 3.7.2 Aus Real vs. Aus Predicted
15
Figure 3.7.3 Boro Real vs. Boro Predicted 16
Figure 3.7.4 Potato Real vs. Potato Predicted 17 Figure 4.2.1 Aus, Aman, Boro vs. Year 23 Figure 4.2.2 Potato vs. Year 24
Fig. 4.2.3. Humidity vs. Year 25
Figure 4.2.4. Real vs. Prediction for mixed 26
LIST OF TABLES
TABLE NO. Page No.
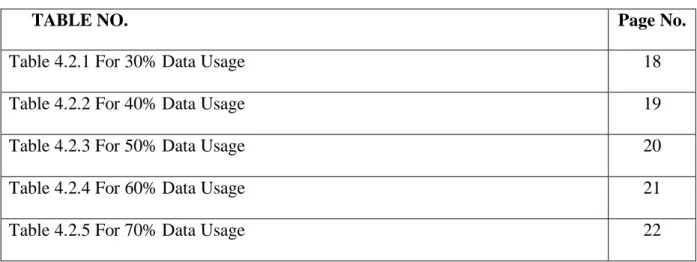
Table 4.2.1 For 30% Data Usage 18
Table 4.2.2 For 40% Data Usage 19
Table 4.2.3 For 50% Data Usage 20
Table 4.2.4 For 60% Data Usage 21
Table 4.2.5 For 70% Data Usage 22
CHAPTER 1 INTRODUCTION 1.1 Introduction
Bangladesh is primarily an agricultural country, and the agriculture sector is critical to the country's economic development. To ensure long-term food security for citizens, it is crucial to have a profitable, safe, and environmentally friendly agricultural system. Rice, jute, fish, fruits, and vegetables are the main foods. In recent years, wheat yield has increased. The poultry industry is growing, which has led to an increase in yield of maize. Textiles, leather and leather goods, ceramics, and ready-made garments are among the other products produced in the country. There are different types of paddies in Bangladesh. The most common paddies are- Aus, Aman, and Boro. Along with rice and wheat, potato is one of Bangladesh's most important crops. In Bangladesh, it is primarily consumed as a vegetable. Due to its nutrient importance and yield, it is Bangladesh's fourth most important crop. So, it is very important to take great care of agricultural sides to increase the productivity of every crop.
According to BBS numbers, Boro produced 54 percent of the 3.64 crore tons of rice produced in the country in 2018-19, Aman 38 percent, and Aus just 8%. The DAE anticipates two crore tones of Boro from 47.54 lakh hectares of land and 34 lakh tons of Aus from about 14 lakh hectares of land this year [1]. Bangladesh produces the fourth most rice in the world. Despite a decline in arable land since the country's independence in 1971, rice harvesting has increased from nearly 10 million ha in 1995 to nearly 12 million ha in 2010. Rice yields have also increased in the last decade, increasing from 2.7 t/ha in 1995 to nearly 4.3 t/ha in 2010.Yield of Rice nearly doubled from over 26 million t in 1995 to over 50 million t in 2010, thanks to these increases in yield and harvested area [2]. Rice is the most common food in Bangladesh, which has a population of 149 million people. In 2009, the average annual milled rice consumption was 173.3 kg. Rice consumption per capita has declined over time, from 74.8 percent of total calories in 1995 to 69.6 percent in 2009. In the same period, rice's contribution to per capita protein intake dropped from 65.3 percent to 56.2 percent.
Bangladesh has been growing rice yield for several years and is now relatively rice self-sufficient.
Rice imports in the country dropped from about 1 million t in 1995 to just 0.017 million ton in
2009 but rose to 0.66 million t in 2010. Rice exports started in the 2000s. However, some rice is still imported, mostly to keep domestic prices in check. The government has introduced major rice policies to increase yield and minimize imports. Subsidies are issued to rice farmers on a variety of agricultural inputs to maintain their prices within the rice farmers' purchasing power. Subsidy aid was distributed to the tune of $712 million in 2010. Small and marginal farmers received cash subsidies from the government via an input distribution card, which could be used to acquire cash subsidies for electricity and fuel for irrigation, fertilizer, and other government assistance.
Potato is an excellent crop for countries with tropical and subtropical agroclimatic conditions, since it can be cultivated in multiple cropping systems. After maize, wheat, and rice, Bangladesh's potato exports hit a record high of over 100,000 tons in 2013-14, before plummeting to 53,000 tons the following year 2015. Until April of this year (2021) it was 27,811.6 tons. Growers have harvested 5, 02,370 tons of potato from 21,108 hectares so far. Potatoes were cultivated on 9,810 hectares of soil, yielding 2, 21,019 tons.
The key rice habitats in Bangladesh are the upland (direct-seeded pre-monsoon aus), irrigated (primarily dry season boro), rain dependent lowland (primarily monsoon season transplanted aman, 0-50cm), stagnant medium deep water (50-100), salty and tidal non-saline. In between months of premonsoon (March-May) Bangladesh receives around 400mm of rain, helps farmers to produce a drought-resistant crop for a short time.
1.2 Motivation
Rice is one of the main foods of our country. There is a saying that fish and rice make a Bengali.
We are dependent on rice and rice comes from rice. If we can forecast the yield prediction of crops like rice, we can fulfill our needs. Also, Potato is mostly used as vegetable in Bangladesh, while it is the staple crop in many countries and accounts for more than 90% of the source of food carbohydrate. It contributes about 63 percent of Bangladesh's overall annual vegetable yield/production (BBS 2014). Millions of tons of potatoes are refined into starch, beer, potato food, flour, dextrose and other items each year in Europe. By using the intelligent technologies, we can predict the future yield of these foods. As a result, we considered using a machine learning method to solve the issues.
1.3 Problem Definition
The term "machine learning" is extremely important in today’s modern ICT environment. The growth of our agricultural sector will be aided by machine learning. In order to provide an effective solution, it is necessary to define the challenges and related requirements in this field. Besides implementing machine learning in the agricultural sector, it's also necessary to understand governmental policies, as well as technology industry standards and instructional alternatives.
1.4 Research Questions
The following are the main questions that this research focuses on:
▪ What are the weather parameters to consider for yield estimation?
▪ Which variety of Rice would show higher yield?
▪ What algorithms would be used?
1.5 Research Methodology
We collected data, preprocessed it, categorized the data from the data collection, selected algorithms, implemented them, and then tested them in the methodology part of our research article. The suggested model's output will be defined at the end of this section.
1.6 Research Objective
Our aim is to estimate yield of some major crops – Aus, Aman, Boro and Potato in Bangladesh by using Data Mining and Machine Learning Techniques.
CHAPTER 2 BACKGROUND 2.1 Introduction
In our region, no work or technology can correctly determine crop yield and provide a solution.
As a consequence, the background is the present incarnation of yield reduction in Bangladesh's agricultural sector, as well as the use of Machine Learning. Machine learning is an artificial intelligence branch (AI), which enables computers to learn and evolve independently without the need of special programming. The creation of computer programming which can access data and learn by themselves is a matter of machine learning. Machine learning algorithms learn, but finding a clear definition for the term learning can be difficult since various methods for extracting knowledge from data exist depending on how the machine learning algorithm is constructed. In general, the learning process necessitates a large number of data that provides a predictable response in response to specific inputs. Each input/response pair is an example, and the algorithm learns faster when there are more examples. This is because each input/response pair is contained within a problem domain defined by a line, cluster, or other statistical representation. We have used these algorithms to get the best outcome.
2.2 Related Works
Machine learning is often used to solve forecasting problems. A lot of thought went into using machine learning to take steps against yield prediction. This technique has been made a lot simpler thanks to machine learning.
Sung-Ju Jang et. al. [3] identified manufacturing efficiency in the semiconductor industry as a significant aspect when judging a company's competitiveness. The evaluation of the wafer maps' productivity before output and the optimization of wafer maps are one of the most essential tactics for enhancing productivity. The productivity of wafer maps can be determined by a range of criteria which impact wafer productivity such as gross dies, shot counts, lithographic performance rates, MFO, cost etc. They present in this work a new model of yield prediction based on profound learning algorithms. Their method uses spatial correlations between wafer positions and die-level
yield changes from a wafer test without process parameters. By modeling these spatial factors, the accuracy of the yield prediction has been greatly enhanced. In addition, testing results have shown that it is possible to create wafer maps with productivity increases up to 8.59 percent utilizing the proposed return model and technique.
Niketa Gandhi et. al. [4] this paper provides an overview of the application of such machine learning techniques to rice cropping areas in India. Cereal crops such as rice, wheat, and various pulses account for the majority of India's food production. Rice-growing areas' long-term viability and productivity are dependent on favorable climatic conditions. This article evaluates the research findings obtained by applying the SMO classifier to a dataset of 27 districts in Maharashtra, India, using the WEKA method. The dataset used to forecast rice crop yields was obtained from publicly accessible Indian government documents. Precipitation, minimum temperature, average temperature, maximum temperature, and reference crop evapotranspiration, location, production, and yield were all considered in the study for the Kharif season (June to November) from 1998 to 2002. For the current study, the mean absolute error (MAE), root relative squared error (RRSE), relative absolute error (RAE), and root mean square error of approximation (RMSE) were calculated. And as per the results of the tests, several techniques worked much better along with the same dataset than SMO.
Rakesh Kumar et. al. [5] conversed about agriculture planning is critical for agro-based countries' economic growth and food security. It is determined by a number of factors, including production rate, market price, and government policies. Many researchers used statistics or machine learning techniques to study crop yield rate prediction, weather prediction, soil classification, and crop classification for agriculture planning. When there are several choices for planting a crop at the same time with limited land resources, crop selection becomes a puzzle. This paper proposed the Crop Selection Method (CSM) to solve the crop selection problem and optimize crop net yield rate over the season, resulting in the country's maximum economic growth. The proposed method has the potential to increase crop net yield rates.
Anshal Savla et. al. [6] showed precision agriculture is the application of cutting-edge agricultural technology. They addressed various algorithms related to data mining classification techniques in
this paper. These algorithms are applied to a data set that has been compiled over time in order to predict soybean crop yields. In addition, a comparison of classification algorithms is performed to show which algorithm is best suited for predicting yield when compared to classification techniques.
Yogesh Gandge et. al. [7] Agriculture is the country's main source of revenue. India is also one of the countries affected by major natural disasters such as drought and flooding, which cause crop damage. Predicting a crop in advance necessitates a comprehensive analysis of vast quantities of data extracted from various variables such as soil quality, pH, EC, N, P, K, and so on. Since crop prediction requires a large number of databases, this prediction method is an ideal candidate for data mining. They derive information from massive amounts of data using data mining. This paper explores the numerous data mining techniques that have been used to predict crop yield. The precision in which features are extracted and how well classifiers are used are critical factors in the performance of any crop yield prediction system. This paper summarizes the results of various algorithms for crop yield prediction that have been used by various authors, along with their accuracy and recommendations.
Monali Paul et. al. [8] yield prediction is very common by many growers these days, and it helps them choose the right crops to sow. As a result, the issue of predicting crop yields is an intriguing task. Previously, achieve successful outcomes was done by taking into account the farmer's experience with a specific field and crop. This paper describes a method for predicting the type of analyzed soil datasets using data mining techniques. The yielding of crops will be indicated by the category as predicted. The dilemma of crop yield prediction is formally recognized as a classification law, with the Naïve Bayes classifier and K-Nearest Neighbor techniques being used.
Mohammad Motiur Rahman et. al. [9] these limestone features have a significant impact on environmental metrics such as erosion, wind direction, and humidity. Bangladesh, which lies on the Himalayan foothills, does not have a uniform topography. Over the years, the human occupation has resulted in the creation of micro-regions. Each of these areas has its own microclimate. As just a result, a food entrepreneur must carefully select regions of land that will provide him or her with the desired production. A research attempt has been made in this analysis
to forecast crop yields using machine learning methods. The simulations were initially trained on the relationship involving recent environmental trends and crop yield. The simulations will then be measured to see how efficient they are at predicting unidentified climatic parameters.
S. Bhanumathi et. al. [10] discussed crop yield evaluation, data mining is a new area of research.
In agriculture, crop productivity is a critical topic. Any farmer wants to know however much he can expect in terms of yield. Evaluate the various associated attributes such as location and pH value, which are used to assess the alkalinity of the soil. Additionally, percentages of nutrients such as Nitrogen (N), Phosphorous (P), and Potassium (K) are calculated using third-party techniques such as APIs for atmosphere and temperatures, type of soil, the nutritional content of the soil in that area, amount of moisture in that region, and soil conditions. Many of these observed variables will be analyzed, and the data will also be trained using different machine learning methods to construct a model. The module utilizes a model that is accurate and reliable in calculating crop yield and providing the average consumer with reasonable fertilizer proportion customers depending on the atmosphere and land variables of the field, thereby increasing agricultural productivity and farmer revenues.
Ratchaphum Jaikla et. al. [11] crop yields forecasting is a tool for estimating the number of rice grains. Most authors have attempted to determine the exact outcomes of rice yield prediction, but the conventional approaches are challenging and one-of-a-kind. As a result, the objective of this essay is to establish a rice yield predictor process using the Support Vector Regression model (SVR), which is one of the most common image predictive models. Soil nitrogen estimation, mosaic virus weight measurement, and rice weight prognostication are the three phases of the prediction process used in this article. They compare the findings to commercial applications, such as the DSSAT4 program for Crop Yield Model implementation (CSM-Rice simulation model).
According to the findings, their approach is similar to the CSM-Rice simulation model. Their model's error is also within appropriate bounds.
The rice price fluctuations in Bangladesh are defined by M. M. Hasan et. al. [12]. They attempted to forecast the future rice price in order to minimize the fluctuation rate. They use conventional classification machines such as KNN, Naïve Bayes, Decision Tree, SVM and Random Forest
algorithms for this purpose. Their best precision was 98.17% that the Random Forest algorithm achieves.
Based on our knowledge and considering the research gap in previous studies our work is a baseline work that use regression algorithms to predict yield estimation of aus, aman, boro and potato considering common yield influencing parameters.
CHAPTER 3
RESEARCH METHODOLOGY 3.1 Introduction
We know, Data mining is a technique for extracting and discovering patterns in large data sets that combines machine learning, statistics, and database systems.
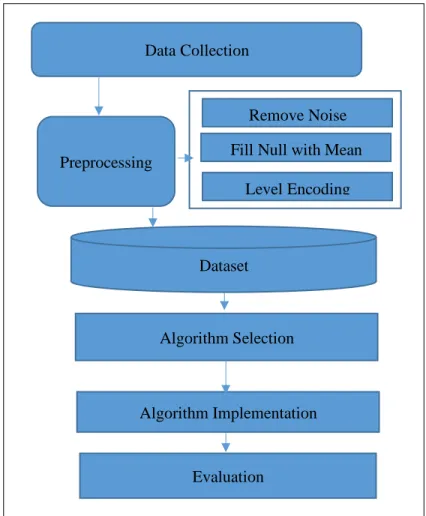
So, we followed six steps of Data Mining in order to finish our research project. First of all, we have collected our data from websites, then we have preprocessed them and followed three steps (Remove Noise, Fill the null with mean, Level Encoding) while preprocessing the data. After that we have made our dataset, then we have selected our seven Machine Learning Regression algorithms which need to be applied. Then we have implemented our selected algorithms and finally evaluated them. Below we have described all of them briefly.
Fig. 3.1. The steps of Data Mining are the following:
Figure 3.1.1 Methodology diagram Data Collection
Preprocessing
Remove Noise Fill Null with Mean
Level Encoding
Dataset
Algorithm Selection
Algorithm Implementation
Evaluation
3.2 Data Collection
Data collection is often a daunting task in any research project. We gathered our information from Bangladesh's Agricultural Research Council website (http://www.barc.gov.bd/). Our data is split into two parts. The first section was used for training and research purposes. Another part was used to make forecasts.
3.3 Preprocessing
We have followed three steps with Data Mining while preprocessing. Steps are given below:
Remove Noise:
In our dataset we had Area, production, Yield and Production. But we have taken yield only. So, we eliminated the production.
Fill Null with Mean:
Calculate average all selected attributes of each division. We have some district data of each division. There is an algorithm which has some steps to fill null value.
Algorithm Steps are written below:
Top:
1. Categorized each district.
2. Find out missing district of each division.
3. Find out available district of each division.
4. Calculate average of available district based on each year.
5. Put average value of each district of specific division of this year.
6. Continue Top until 2018.
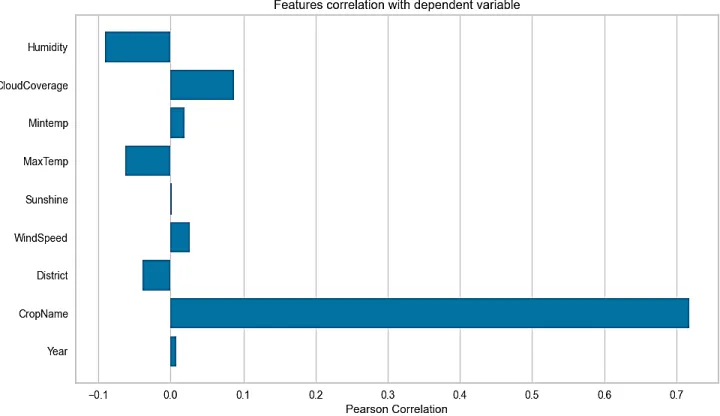
This figure below represents the correlation analysis of our dataset. From this graph we can see that most significant value is Cropname that can affect dependent variable than other variable.
Here humidity, Maxtemperature and District are negatively correlated with our dependent variable.
Cloud coverage, Minimum temperature, sunshine, wind speed and Year are positively correlated and they are very close to each other. as a result, we did not remove any attribute from our dataset.
Figure 3.3.1 Most significant Parameter
Level Encoding:
We have taken 64 districts of our country. We know that the computer doesn’t know string.
That is why we converted them into number which is 0 – 63. We also encoded crop name by 1,2,3, and 4 which is represented by Aus, Aman, Boro, and Potato.
3.4 Dataset
We have taken rice and potato yield data of the years from 2012 to 2018. We also taken Aus, Aman, Boro and Potato as crop name. There encoding is 1 for Aus, 2 for Aman, 3 for Boro and 4 for Potato. We have taken average wind speed of all station during year 2000 to 2018. We have calculated average wind speed by using Wind Speed (m/s). Sunshine (Hour) of all station during year 2012 to 2018. We have calculated average sunshine by using Sunshine (Hours). Maximum
Temperature of all station during year 2012 to 2018. We used the annual maximum temperature to measure the average maximum temperature by using Temperature (Deg.Cel) of all station during year 2012 to 2018. For minimum average temperature we have used Temperature (Deg.Cel) of all station during year 2012 to 2018. For average cloud coverage used Cloud Coverage (Octs) of all station during year 2012 to 2018. We can get the average humidity by using Humidity (percent).
3.5 Algorithm Selection
We based our efforts on the regression algorithm, which is yield dependent. To obtain initial accuracy, we used seven common machine learning algorithms: Gradient Boosting, Decision tree, Lasso, Linear, Neural network, Random Forest, and SVM. We obtained the best algorithm with the highest accuracy of all algorithms using this technique.
a. Gradient Boosting: Gradient boosting is a type of boosting that is used in machine learning. It is based on the concept that the average prediction error is minimized when the next best available model is combined with prior model. The principal principle is to specify the target results for the next model to mitigate errors.
b. Decision Tree: A decision tree is a decision-making aid based on a tree-like decision model and its various outcomes, including the occurrences, resource costs and utility results. This is one way of showing an algorithm consisting entirely of conditions of control.
c. Linear Regression: A linear approach is also called linear regression in statistics. It represents the connection between a scalar response and one or more explanatory factors.
Easy linear regression is utilized when only one explanatory variable is present; when more than one explanation exists, multiple linear regression is employed.
d. Lasso: Lasso is a statistical and machine learning regression analysis tool used in variable selection and regularization, which improves the predictability of the resulting statistical model and improves its interpretability.
e. Neural Network (MLP Regression): Artificial neural networks, often referred to as
"neural networks," are computational structures that are based on the biological neural networks that make up animal brains. Artificial neurons are a series of linked units or nodes in an ANN that loosely model the neurons in a biological brain.
f. Random Forest: Random forests are a group learning method to classify, regression and work through the building of large numbers of decision-making trees during training and then class production, the average forecast for individual trees.
g. SVM: Support vector machines are supervised learning models that utilize learning algorithms to examine data for machine learning classification and regression analysis.
3.6 Algorithm Implementation
With a 30% data consumption rate, we were able to achieve the highest accuracy with Gradient Boosting after implementing algorithms. The other six algorithms performed admirably as well.
We decided to use Gradient Boosting to forecast the yield because it was the most efficient algorithm.
3.7 Statistical Analysis
We attempted to determine the causes of poor yield of crops in this section and compared between real and predicted value in the form of graphical representation.
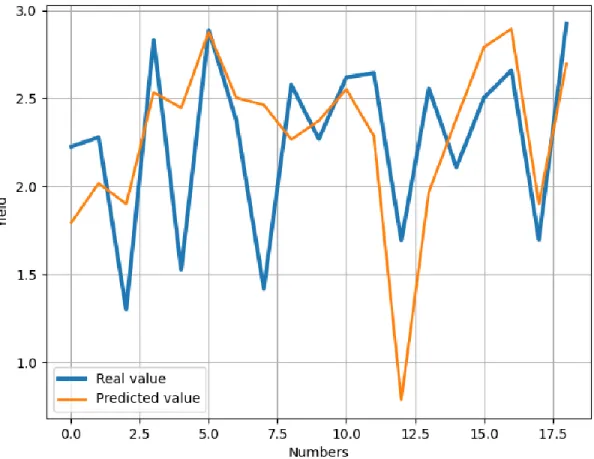
3.7.1 Aman Real vs. Aman Predicted
Fig. 3.7.1. Aman Real vs. Aman Predicted
The graph depicts the relation between Aman's actual and expected value (rice). Real values are shown in blue, while expected values are shown in orange. Most of the data are almost same. There are only few errors which are negligible.
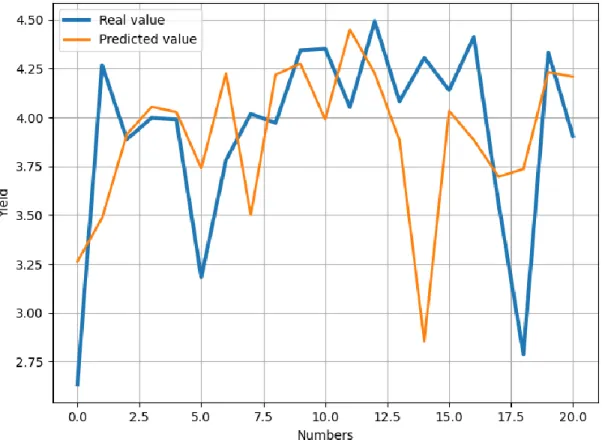
3.7.2 Aus Real vs. Aus Predicted
Fig. 3.7.2. Aus Real vs. Aus Predicted
The graph represents, the comparison between the real value and predicted value of Aus (rice).
Here, the blue color is for real values, and orange is for predicted value. We can see there are 3 errors with the real data and predicted data.
3.7.3 Boro Real vs. Boro Predicted
Fig. 3.7.3. Boro Real vs. Boro Predicted
The graph represents, the comparison between the real value and predicted value of Boro (rice).
Here, the blue color is for real values, and orange is for predicted value. We can see in the graph, both of the lines are almost similar, except some of the points it is faded.
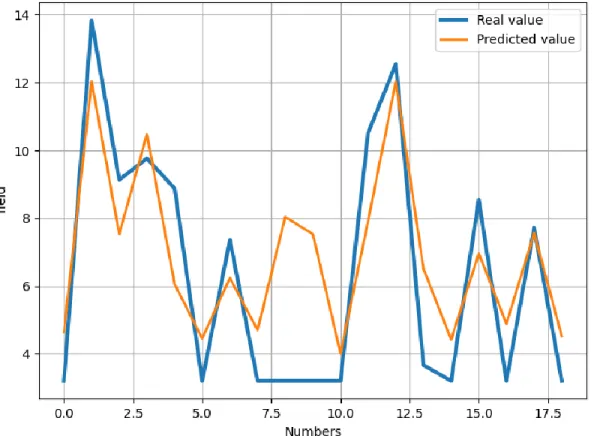
3.7.4 Potato Real vs. Potato Predicted
Fig. 3.7.4. Potato Real vs. Potato Predicted
Here, the graph shows the comparison between real and predicted data for potato yield. The blue color indicating the real value and orange color is showing the predicted value. Most of the cases are same like real value. Only in 2 places it has been distorted, among so many data it is negligible.
3.8 Evaluation
Initially, we gathered our data from a convenient source for our study. Then we used seven machine learning algorithms to estimate our data to see which one was the most effective.
CHAPTER 4
RESULT, COMPARISON AND ANALYSIS 4.1 Introduction
Here, we have generated results using different Machine learning regression algorithms using different types of parameters or variables e.g., independent variables and Dependent variables, compared them with each other and then we have analyzed the results in terms of their Mean squared Error and R2 Score.
4.2 Result, Comparison and Analysis
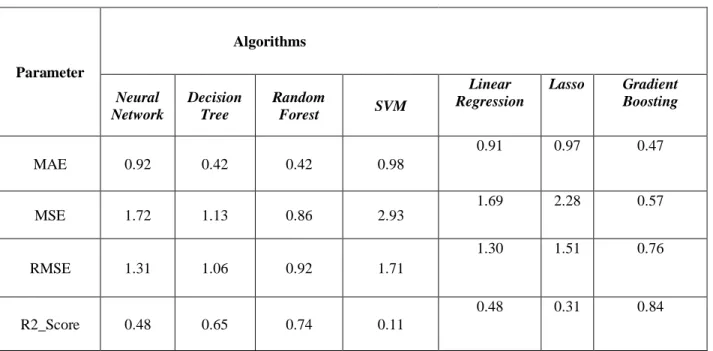
Here, Table 4.2.1 For 30% data usage rate, we can see the best value for MSE (Mean Squared Error) is 0.57 which is given by Gradient Boosting Regression and the value of R2 score for the Gradient Boosting is 0.84. So, the Gradient Boosting Regression is the best algorithm for 30% data usage rate.
Table 4.2.1 For 30% Data Usage
Parameter
Algorithms
Neural Network
Decision Tree
Random
Forest SVM
Linear Regression
Lasso Gradient Boosting
MAE 0.92 0.42 0.42 0.98
0.91 0.97 0.47
MSE 1.72 1.13 0.86 2.93 1.69 2.28 0.57
RMSE 1.31 1.06 0.92 1.71
1.30 1.51 0.76
R2_Score 0.48 0.65 0.74 0.11
0.48 0.31 0.84
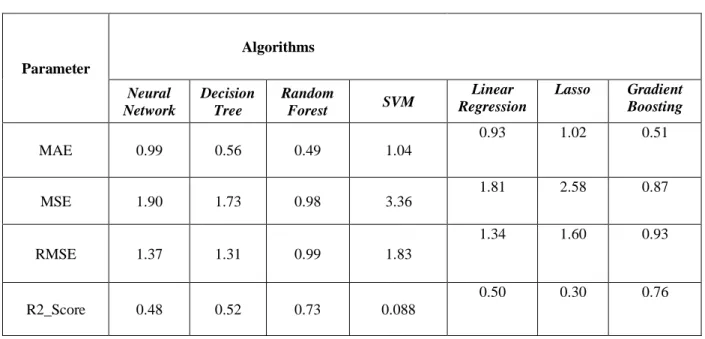
Table 4.2.2 For a data use rate of 40%, we can see that the best MSE (Mean Squared Error) value is 0.87, which is given by Gradient Boosting Regression, and the R2 score for Gradient Boosting is 0.76. As a result, the Gradient Boosting Regression is the best algorithm for a data use rate of 40%.
Table 4.2.2. For 40% Data Usage
Parameter
Algorithms
Neural Network
Decision Tree
Random
Forest SVM Linear
Regression
Lasso Gradient Boosting
MAE 0.99 0.56 0.49 1.04
0.93 1.02 0.51
MSE 1.90 1.73 0.98 3.36
1.81 2.58 0.87
RMSE 1.37 1.31 0.99 1.83
1.34 1.60 0.93
R2_Score 0.48 0.52 0.73 0.088
0.50 0.30 0.76
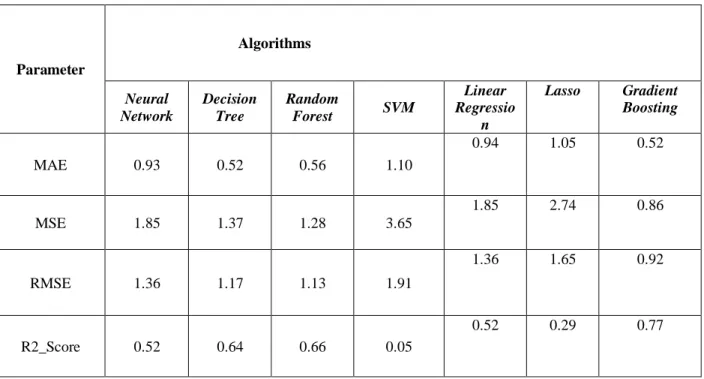
Table 4.2.3 the best value for MSE (Mean Squared Error) is 0.85, which is given by Gradient Boosting Regression, and the R2 score for Gradient Boosting is 0.77. As a result, for a data use rate of 50%, the Gradient Boosting Regression algorithm is the best choice.
Table 4.2.3. For 50% Data Usage
Parameter
Algorithms
Neural Network
Decision Tree
Random
Forest SVM
Linear Regressio
n
Lasso Gradient Boosting
MAE 0.93 0.52 0.56 1.10
0.94 1.05 0.52
MSE 1.85 1.37 1.28 3.65
1.85 2.74 0.86
RMSE 1.36 1.17 1.13 1.91
1.36 1.65 0.92
R2_Score 0.52 0.64 0.66 0.05
0.52 0.29 0.77
Table 4.2.4 for a data use rate of 60%, the best MSE (Mean Squared Error) value is 0.86, which is given by Gradient Boosting Regression, and the R2 score for Gradient Boosting is 0.77. So, for a 60 percent data use rate, Gradient Boosting Regression is the best algorithm.
Table 4.2.4. For 60% Data Usage
Parameter
Algorithms
Neural Network
Decision Tree
Random
Forest SVM
Linear Regression
Lasso Gradient Boosting
MAE 0.96 0.60 0.57 1.12
0.93 1.05 0.52
MSE 1.96 1.36 1.22 3.70
1.84 2.73 0.86
RMSE 1.40 1.31 1.10 1.92
1.35 1.65 0.92
R2_Score 0.49 0.56 0.68 0.04
0.52 0.29 0.77
Table 4.2.5 the best MSE (Mean Squared Error) value for a data usage rate of 70% is 0.98, which is given by Gradient Boosting Regression, and the R2 score for Gradient Boosting is 0.75. As a consequence, Gradient Boosting Regression is the best algorithm for a 70% data use rate.
Table 4.2.5. For 70% Data Usage
Here, 7 types of regression algorithms have been used. They are- Gradient Boosting, Neural Network, Decision Tree, Random Forest, SVM, Linear and Lasso. Almost every algorithm has provided good prediction but the values given by Gradient Boosting are the best for both MSE and R2 score.
Parameter
Algorithms
Neural Network
Decision Tree
Random
Forest SVM Linear
Regression
Lasso Gradient Boosting
MAE 0.97 0.72 0.59 1.14
0.95 1.05 0.57
MSE 1.94 2.25 1.23 3.87
1.89 2.79 0.98
RMSE 1.39 1.50 1.11 1.96
1.37 1.67 0.99
R2_Score 0.50 0.42 0.68 0.02
0.51 0.28 0.75
Fig. 4.2.1. Aus, Aman, Boro vs. Year
Fig. 4.2.1 here, the graph showing results from year 2012 to 2018. Here, the blue color is for Aus, orange is for Aman and green is for Boro.
Here we can see, the yield rate of Aus is reducing every year. From 2012 to 2018 the rate has been decreased. It’s still been produced but the rate is very low.
For Aman, it’s almost like Aus. The Yield rate is very low and almost same in every year from 2012 to 2018.
For boro, if we see the graph the Yield is very high from 2012 to 2018. Even, the yield rate has been increased vastly if we compare the year 2012 with 2018.
Fig. 4.2.2. Potato vs. Year
Fig. 4.2.2 here the graph representing in which Years how the yield rate was for potato.
We can see, in 2014 the yield was the lowest in whole country in average. But the yield increased rapidly from 2018 and it was the highest yield in our graph. The yield rate was almost same in 2015, 2016 and 2017.
Fig. 4.2.3. Humidity vs. Year
Fig 4.2.3 here, the graph shows the maximum and minimum Humidity (in percentage) of each year from 2012 to 2018.The blue color represents Maximum temperature and the orange color represents the minimum temperature.
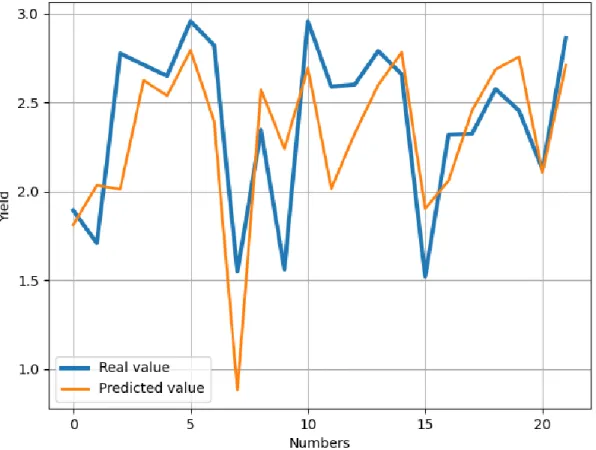
4.2.4. Real vs. Prediction for mixed
Fig. 4.2.4. Real vs. Prediction for mixed
Fig. 4.2.4 here, we have worked with 4 types of crops. They are- Aus, Aman, Boro (3 types of rice) and potato. When we started working, there were mixture of data for every crops. Here, the blue color indicates the real value or real yield and orange shows the predicted value. The prediction was executed with 80 data. Here, the values were being tested if the real value is coping with the predicted value or not. It’s been also observed that the best performance algorithm is also working or not. It’s comparing between the real and the predicted value. Most of the cases are same for both real and predicted data. Only few data have been distorted. Even if we predicted all the 4 crops together, it’s still performing very well.
CHAPTER 5
CONCLUSION AND FUTURE WORK
5.1 Conclusion
Rice and potato are two major crops in Bangladesh. In Bangladesh, the rice industry accounts for half of the agricultural Gross domestic product and one-sixth of government revenue. For the year 2020, Bangladesh will need approximately 27.26 million tons of rice. The total rice area would diminish to 10.28 million hectares during this period. As a result, the current rice yield of 2.74 t/ha needs to be increased to 3.74 t/ha. Our study shows that weather parameters (Monthly Humidity, Maximum and Minimum Temperature, Sunshine, Cloud coverage, Wind speed) from different regions can successfully predict yield of rice (Aus, Aman, Boro) and potato. Our study also shows that Gradient boosting Regression algorithm performs better than the other six algorithms used in this study to predict the yield of Rice and Potato. We also found out that Among other Rice varieties, Boro shows Higher yield. So, Our Suggestion is to cultivate Boro more for getting higher yield. This study will enable people working in the agricultural sector to make informed guesses about weather variables in order to reduce their losses in the coming years. This will allow us to think about some of the more precise results in a smarter manner. To solve all the problems we need to increase the yield. For that, we can increase the yield by predicting the yield before using the machine learning approach. At present, machine learning is being used a lot in the agricultural sector. We would also have proved successful if we can build a system that could increase land productivity. To reach its objectives, we exploited seven popular regression Machine learning in our proposed model.
5.2 Future Work
We have worked with three types of rice and potato in our research. In future we will work with wheat, oil seeds, maize, pulses, etc. We will try to boost our collection of data mostly in the future by collecting data from all years and creating an Android application that will be simple to use for everyone.
5.3 Limitation
We explored how to get the best possible outcome, but there are still a few stumbling blocks in our path. The limitations were data unavailability (i.e., soil data) regarding covid-19 situations.
We could have collected more data but because of lockdown it was hard to collect more data.
APPENDIX
Appendix A: Data collected from Agricultural Website.
The first challenge we faced while performing the research was deciding the methodological methods for our report. It wasn't standard work, and nothing had been accomplished in this area previously. As a result, we weren't able to get much support from any source. After a long period of hard work, we might be able to do it.
We have collected our data from this website. (http://www.barc.gov.bd/)
REFERENCE
[1] Anwar Ali, 'Save Boro first, then Aush', https://www.thedailystar.net/frontpage/news/save-boro-first-then- aush-1893349, April 16, 2020.
[2] Ricepedia, 'Recent developments in the rice sector', http://ricepedia.org/bangladesh, September 2012.
[3] S. Jang, J. Kim, T. Kim, H. Lee and S. Ko, "A Wafer Map Yield Prediction Based on Machine Learning for Productivity Enhancement," in IEEE Transactions on Semiconductor Manufacturing, vol. 32, no. 4, pp. 400-407, Nov. 2019, doi: 10.1109/TSM.2019.2945482.
[4] N. Gandhi, L. J. Armstrong, O. Petkar and A. K. Tripathy, "Rice crop yield prediction in India using support vector machines," 2016 13th International Joint Conference on Computer Science and Software Engineering (JCSSE), Khon Kaen, Thailand, 2016, pp. 1-5, doi: 10.1109/JCSSE.2016.7748856.
[5] R. Kumar, M. P. Singh, P. Kumar and J. P. Singh, "Crop Selection Method to maximize crop yield rate using machine learning technique," 2015 International Conference on Smart Technologies and Management for Computing, Communication, Controls, Energy and Materials (ICSTM), Avadi, India, 2015, pp. 138-145, doi:
10.1109/ICSTM.2015.7225403.
[6] A. Savla, N. Israni, P. Dhawan, A. Mandholia, H. Bhadada and S. Bhardwaj, "Survey of classification algorithms for formulating yield prediction accuracy in precision agriculture," 2015 International Conference on Innovations in Information, Embedded and Communication Systems (ICIIECS), Coimbatore, India, 2015, pp. 1-7, doi: 10.1109/ICIIECS.2015.7193120.
[7] Y. Gandge and Sandhya, "A study on various data mining techniques for crop yield prediction," 2017 International Conference on Electrical, Electronics, Communication, Computer, and Optimization Techniques (ICEECCOT), Mysuru, India, 2017, pp. 420-423, doi: 10.1109/ICEECCOT.2017.8284541.
[8] M. Paul, S. K. Vishwakarma and A. Verma, "Analysis of Soil Behaviour and Prediction of Crop Yield Using Data Mining Approach," 2015 International Conference on Computational Intelligence and Communication Networks (CICN), Jabalpur, India, 2015, pp. 766-771, doi: 10.1109/CICN.2015.156.
[9] M. M. Rahman, N. Haq and R. M. Rahman, "Machine Learning Facilitated Rice Prediction in Bangladesh,"
2014 Annual Global Online Conference on Information and Computer Technology, Louisville, KY, USA, 2014, pp.
1-4, doi: 10.1109/GOCICT.2014.9.
[10] S. Bhanumathi, M. Vineeth and N. Rohit, "Crop Yield Prediction and Efficient use of Fertilizers," 2019 International Conference on Communication and Signal Processing (ICCSP), Chennai, India, 2019, pp. 0769-0773, doi: 10.1109/ICCSP.2019.8698087.
[11] R. Jaikla, S. Auephanwiriyakul and A. Jintrawet, "Rice yield prediction using a Support Vector Regression method," 2008 5th International Conference on Electrical Engineering/Electronics, Computer, Telecommunications and Information Technology, Krabi, Thailand, 2008, pp. 29-32, doi: 10.1109/ECTICON.2008.4600365.
[12] M. M. Hasan, M. T. Zahara, M. M. Sykot, A. U. Nur, M. Saifuzzaman and R. Hafiz, "Ascertaining the Fluctuation of Rice Price in Bangladesh Using Machine Learning Approach," 2020 11th International Conference on Computing, Communication and Networking Technologies (ICCCNT), Kharagpur, India, 2020, pp. 1-5, doi:
10.1109/ICCCNT49239.2020.9225468.