BY
SHUKANTA DEY ID: 161-15-7259 FAZLE RABBI KHAN
ID: 161-15-6917 AND H. M. NASIM ID: 161-15-7365
This Report Presented in Partial Fulfillment of the Requirements for the Degree of Bachelor of Science in Computer Science and Engineering
Supervised by Md. Abbas Ali Khan
Senior Lecturer Department of CSE
Daffodil International University
Co-supervised by Ms. Rubaiya Hafiz
Senior Lecturer Department of CSE
Daffodil International University
DAFFODIL INTERNATIONAL UNIVERSITY DHAKA, BANGLADESH
JUNE, 2020
APPROVAL
This Project/internship titled “Symptom Wise Myocardial Infarction Prediction Using Machine Learning”, submitted by Shukanta Dey, ID No: 161-15-7259, Fazle Rabbi Khan, ID No: 161-15-6917 and H.M. Nasim, ID No: 161-15-7365 to the Department of Computer Science and Engineering, Daffodil International University has been accepted as satisfactory for the partial fulfillment of the requirements for the degree of B.Sc. in Computer Science and Engineering and approved as to its style and contents. The presentation has been held on 08-07-2020.
BOARD OF EXAMINERS
Dr. Syed Akhter Hossain Chairman
Professor and Head
Department of Computer Science and Engineering Faculty of Science & Information Technology Daffodil International University
Dr. Sheak Rashed Haider Noori Internal Examiner
Associate professor &Associate Head
Department of Computer Science and Engineering Faculty of Science & Information Technology Daffodil International University
Md. Zahid Hasan Internal Examiner Assistant Professor
Department of Computer Science and Engineering Faculty of Science & Information Technology Daffodil International University
Dr. Md. Motaharul Islam External Examiner
Professor
Department of Computer Science and Engineering United International University
DECLARATION
We hereby declare that, this project has been done by us under the supervisor of Mr. Md. Abbas Ali Khan, Sr. Lecturer, Department of CSE Daffodil International University. We also declare that neither this project nor any part of this project has been submitted elsewhere for award of any degree or diploma.
Supervised by:
Md. Abbas Ali Khan Senior Lecturer
Department of CSE
Daffodil International University
Co-supervised by:
Ms. Rubaiya Hafiz Senior Lecturer Department of CSE
Daffodil International University
Submitted by:
Shukanta Dey ID: 161-15-7259 Department of CSE
Daffodil International University
Fazle Rabbi Khan ID: 161-15-6917 Department of CSE
Daffodil International University
H. M. Nasim ID: 161-15-7365 Department of CSE
Daffodil International University
ACKNOWLEDGEMENT
First, we express our heartiest thanks and gratefulness to Almighty for his divine blessing made me possible to complete the final thesis successfully.
We really grateful and wish my profound my indebtedness to Mr. Md. Abbas Ali Khan, Department of CSE, Daffodil International University, Dhaka. Deep Knowledge & keen interest of my supervisor in the field of “Data Mining, System Analysis and Machine learning” to carry out this thesis. His endless patience, scholarly guidance, continual encouragement, constant and energetic supervision, constructive criticism, valuable advice, reading many inferior draft and correcting them at all stage have made it possible to complete this thesis.
We would like to express our heartiest gratitude to Dr. Syed Akhter Hossain, Head, Department of CSE, for his kind help to finish my project and also to other faculty member and the staff of CSE department of Daffodil International University.
We would like to thank our entire course mate in Daffodil International University, who took part in this discuss while completing the course work.
Finally, we must acknowledge with due respect the constant support and patients of my parents and brother.
ABSTRACT
Cardiovascular diseases especially Myocardial Infarction (MI) (Heart Attack) is among the leading causes of death across the world. Early designation of this illness typically will increase the possibilities for productive treatment by that specialize in detecting symptomatic patients as early as potential. In this paper, we are trying to concentrate on symptom-wise heart attack prediction through machine learning approaches. Here, input data are collected from medical hospitals with a number of attributes like blood pressure, serum cholesterol, heart rate, BMI, troponin, diabetes, smoking etc. Finally, these features are modelled for prediction using some algorithms like Naive Bayes Classifier, Decision Tree, K-Nearest Neighbors, Linear Regression and Logistic Regression. Among all above mentioned algorithms, K- Nearest Neighbor gives the best prediction with 90% accuracy.
TABLE OF CONTENTS
CONTENTS PAGE
Approval i-ii
Declaration iii-iv
Acknowledgement v
Abstract vi
CHAPTERS
CHAPTER 1: INTRODUCTION
1-31.1 Introduction 1-2
1.2 Objective 2
1.3 Motivation 2
1.4 Expected Outcome 3
1. Report Layout 3
Chapter 2: BACKGROUND
4-52.1 Background 4
2.2 Related Works 4-5
2.3 Research Summary 5
2.4 Scope of the Problem 5
2.5 Challenges 5
Chapter 3: RESEARCH METHODOLOGY
6-183.1 Introduction 6
3.2 Research Subject and Instrumentation 6
3.3 Data Collection Procedure 7
3.4 Implementation Requirement 7
3.4.1 Indicating the pre-processing steps of research procedure 7
3.4.2 Data pre-processing 8
3.4.3 Data Analysis 9-14
3.4.4 Feature Selection 14
3.4.4.1 Correlation Matrix with Heatmap 14-15
3.4.4.2 Classification 15
3.4.4.2.1 K-Nearest Neighbours 15-16
3.4.4.2.2 Naive Bayes Classifier 16
3.4.4.2.3 Decision Tree 17
3.4.4.2.4 Linear Regression 17
3.4.4.2.5 Logistic Regression 18
CHAPTER 4: EXPERIMENTAL RESULTS AND DISCUSSION
19-264.1 Introduction 19
4.2 Performance Evaluation Methods 19
4.3 Outcome of Algorithms 20
4.3.1 K-Nearest Neighbours 21
4.3.2 Decision Tree 22
4.3.3 Linear Regression 23
4.3.4 Logistic Regression 23
4.3.5 Naive Bayes Classifier 24
4.3.6 Features Importance 24-25
4.4 Accuracy Model 25
4.5 The probability of MI 25-26
CHAPTER 5: FURTHER STUDY
275.1 Summary of the Study 27
5.2 Future work 27
CONCLUSION 28
REFERENCES 29
LIST OF FIGURES
FIGURES PAGE
Fig. 1: Stages of Working Procedure 7
Fig. 2: Dataset Range of Values 8
Fig. 3: Frequency for Ages 9
Fig. 4: Age Statistics 9
Fig. 5: Frequency for Sex 10
Fig. 6: Percentage of Sex 10
Fig. 7: Percentage of Target 10
Fig. 8: Histogram Graph 11
Fig. 9: Target Data Bar Chart 11
Fig. 10: Age vs Troponin – I 12
Fig. 11: Age vs History of MI 12
Fig. 12: Age vs Blood Pressure 13
Fig. 13: Heart Disease Patients According to Diabetes 13
Fig. 14: Correlation Matrix 14
Fig. 15: Feature Selection 15
Fig. 16: Decision Tree Classification 17
Fig. 17: Logistic Regression 18
Fig. 18: Accuracy Table of Model 20
Fig. 19: K-Nearest Neighbours Output 21
Fig. 20: Decision Tree Output 22
Fig. 21: Decision Tree Result 22
Fig. 22: Linear Regression Result 23
Fig. 23: Logistic Regression Result 23
Fig. 24: Naive Bayes Classifier Result 24
Fig. 25: Features Importance Result 24
Fig. 26: Accuracy Model Bar Chart 25
CHAPTER 1 INTRODUCTION
1.1 Introduction
In Bangladesh, the quantity of Heart diseases passing's arrived at 112,791 (14.31% of complete passing's) as indicated by the most recent WHO information distributed in 2017. Bangladesh is positioned #104 by the age balanced demise rate is 108.99 per 100,000 of populace [1]. The focal piece of human body's cardiovascular system is the heart. The system additionally contains lungs.
Heart is a strong organ by which blood is siphoned into the body. A system of veins like corridors, veins and vessels are contained into the cardiovascular system. Blood is conveyed everywhere throughout the body through these veins. Various kinds of heart sicknesses that are normally alluded to as Cardiovascular infections (CVDs) are brought about by the irregularities of blood be expected the heart. 17.5 million all out passing's all around happen due to coronary failures and strokes as indicated by the overview of the World Wellbeing Association (WHO). Over 75% of passing's from Heart diseases happen in those nations whose pay is medium or low. Likewise, 80%
of the passing's that happen as a result of cardiovascular disorders are because of stroke and respiratory failure [2].
Various estimations of heartbeat rate and pulse is claimed by every individual. It is medicinally demonstrated that the circulatory strain must be in the scope of 120/80 to 140/90 and the beat rate must be somewhere in the range of 60 and 100 beats for each moment [3].
The quantity of people covered with Heart ailments will build paying little heed to age in every man and women anyway elective components like sexual orientation, diabetes, BMI moreover add to the present ailment. Cardio implies that heart subsequently all heart maladies are encased into the class of cardiovascular ailments. The different sorts of cardiopathy are: coronary heart maladies, cardiopathy, manifestation heart condition, heart condition, inborn heart ailments [4].
Myocardial Infarction (Heart Attack) is the most widely recognized among all the kinds of heart illnesses. Various significant side effects of coronary disappointment are: chest snugness, brevity of breath, sickness, manifestation, indigestion, or mid-region torment, perspiring and weariness, pressure inside the higher back torment that spreads to the arm.
In this paper we have attempted forecast and investigation of Heart attack by considering the parameters like pulse, serum cholesterol, pulse, BMI, troponin, diabetes, smoking, etc.
1.2 Objective
The objectives of our work are:
• To provide a machine learning based system for the automatic detection of heart disease.
• To predict attack considerably eighteen attributes are selected for Data collection.
• Utilizing the data such as blood pressure, serum cholesterol, heart rate, BMI, troponin, diabetes, smoking and so on to predict the chance of Myocardial Infarction (heart attack) in future.
1.3 Motivation
The rate of coronary heart disease is growing at an exponential extent. The busy lifestyle of humans in this period with all the fast food in the lunch break and getting returned to sitting and operating has driven as over the edge. Along with this human being these days have a scarcity of exercising and are less active. For maximum of them undertaking is simply another film in bed or anything technology based. Physical activities have reduced drastically. These factors boosted the extent of heart diseases to an unfortunately excessive percentage. In a developing country like ours the rate of heart diseases has the identical effect. The annual mortality rate consistent with 100,000 human beings from cardiovascular diseases in Bangladesh has increased via 128.9% in view that 1990, a mean of 5.6% a year [5].
1.4 Expected Outcome
By considering facts such as blood pressure, serum cholesterol, heart rate, BMI, troponin, diabetes, smoking and so on we will be able to predict the chances of a patient to get heart attack. We will be able to find out the algorithm with the highest accuracy & also the algorithm with the lowest accuracy. The data that are used in our project can be used to future use. New algorithms can be applied later.
1.5 Report Layout
Chapter 1: There is introduction, objective and expected outcome of the project work we have done is written here and the report layout.
Chapter 2: This is about background. This chapter is all about the background situation of our work that we have done.
Chapter 3: There is methodology. Data collection procedure, data pre-processing, data analysis etc have been discussed there.
Chapter 4: There are experimental results and discussion. Results from each machine learning approaches have been shown; the probability is shown also.
Chapter 5: There are conclusion and further study. Future work has been discussed there also.
CHAPTER 2 BACKGROUND
2.1 Background
A huge number of individuals are encountering a coronary illness consistently. Heart Diseases is the greatest executioner for the both men and women in the world over. Around twelve million passing happen worldwide because of Heart infections, broke down by The World Wellbeing Association (WHO). The Heart Diseases murders one individual on the world in pretty much at regular intervals. Clinical determination assumes significant job but it is an entangled errand which should be executed effectively, cautiously and precisely. To diminish cost for getting clinical tests a legitimate Computer based data and choice help ought to be supported. AI is the utilization of programming strategies for discovering designs, it likewise discovers the consistency in sets of information. With the approach of AI over the most recent two decades, there is an enormous chance to permit computers to build and order the various qualities or classes straightforwardly.
Thinking about the hazard parts associated with different coronary illness typically causes therapeutic administrations specialists to distinguish patients who are at high danger of getting a coronary illness. Measurable examination has recognized hazard factors that are connected with coronary illness to be age, pulse, absolute cholesterol, diabetes, hyper strain, family ancestry of coronary illness, stoutness and absence of physical exercise, fasting glucose and so on.
Scientists have been working with various AI procedures to help restorative administrations specialists with advanced precision to pass judgment on coronary illness. Neural network, Naïve Bayes, Decision Tree etc. are some of the techniques that are used for the diagnosis of heart disease.
2.2 Related Work
Data mining is extensively used for prediction in many fields, medical being considered one of them. The extra the documented statistics the greater it is able to be manipulated in predictions.
Many illnesses are being predicted by data mining techniques with excessive efficiency. A review
on prediction of breast cancer shows that it can be predicted with excessive accuracy the usage of different techniques [6]. Imagers of cancer cells at distinctive tiers help to show the patients situations or even see if any specific drug works on the person. Heart disease prediction have additionally been studied in lots of cases.
2.3 Research Summary
On this research purpose, we had to learn different machine learning algorithms such as Naive Bayes Classifier, Decision Tree, K-Nearest Neighbors, Linear Regression and Logistic Regression. We had to learn these very well as we applied these algorithms to find out the probabilities of heart attack. We have collected more than 350 data from Chittagong Medical College & National Heart Foundation, Bangladesh. There are many algorithms which could be applied for our work. But we have chosen those five algorithms according to our understanding from study that these approaches might be good enough.
2.4 Scope of the Problem
The scope of our research is really broad. Our dataset was new, those weren't used for any other project as well. So, we had a big opportunity for a new experience. We could face new problems and then solve those. We could increase our knowledge about the algorithms that we choose for our project.
2.5 Challenges
Collecting more than 500 data from Chittagong Medical College & National Heart Foundation, Bangladesh wasn't easy. We had to travel a lot, waited a lot to get those real data. It's really a good amount of data that led us to work on this project. Model selection, pre-processing of data & then Feature Selection were also challenging. Considering our model, we choose the Correlation Matrix with Heatmap as our Feature Selection. Applying those algorithms & calculating accuracy for each were important challenges.
CHAPTER 3
RESEARCH METHODOLOGY
3.1 Introduction
Machine Learning is used across several spheres around the world. The tending trade isn't any exception. Machine Learning will play a vital role in predicting presence/absence of Heart diseases and a lot of. Such data, if expected well in advance, will give necessary insights to doctors who can then adapt their designation and treatment per patient basis.
According to the world Health Organization Associate in Nursing estimation of 31% of world deaths are caused by Heart Diseases [7]. Over 3 quarters of that crop up in low- and middle-income countries. cardiopathy kills one in each thirty-two seconds within the u. s. of America [8]. The prediction of heart diseases could be a terribly delicate issue and risky additionally. If done properly it are often utilized by the medical body. This analysis is finished to see the potency of certain data processing techniques on some chosen attributes as represented later.
Here, we’ll discuss our project wherever we tend to worked on predicting potential Heart Diseases in people using Machine Learning algorithms. We have tried to predict and analyses heart attack by considering the parameters like blood pressure, serum cholesterol, heart rate, BMI, troponin, diabetes, smoking and so on. We also build up a website where patient can also easily predict their percentage of Heart attack and Heart Failure.
3.2 Research Subject and Instrumentation
Our research aim could be very unique. We have done a work where no one work before in Bangladesh. So, it’s very difference concept for all of us. We collect data for the patient from different kind of Medical institution. The dataset was taken from the database of Chittagong Medical College and National Heart Foundation. From this database, out of 521 records, 180 belong to healthy category and the rest 341 belong to Myocardial Infarction.
But here we have normally used the different kind of algorithms from our dataset. I have analyzed more than five hundred data for my task.
3.3 Data Collection Procedure
Data collection was very hard challenging task of our research studies. Firstly, we gathered data from different type Medical Institution and different type of age’s patient manually. Then we collect data from Chittagong Medical College and then Heart foundation. This database consists of 521 records that include age, sex, style of chest pain, blood pressure, cholesterol, ECG, maximum heart rate, BMI, exercise induced angina, Troponin-I, family history, history of diabetes, smoking respectively.
3.4 Implementation Requirement
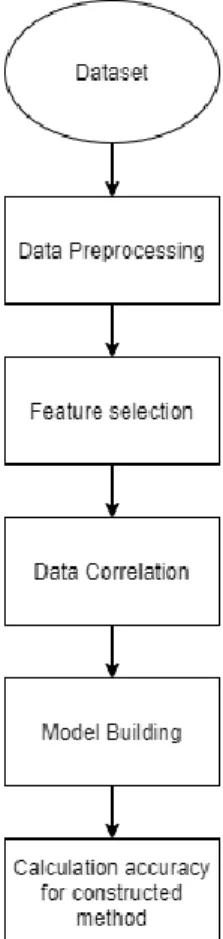
For archiving our target aim, we have maintained a few steps. Those all are very related with each other. Describe Figure is given below:
3.4.1 Indicating the Pre-processing Steps of Research Procedure
Fig. 1: Stages of Working Procedure
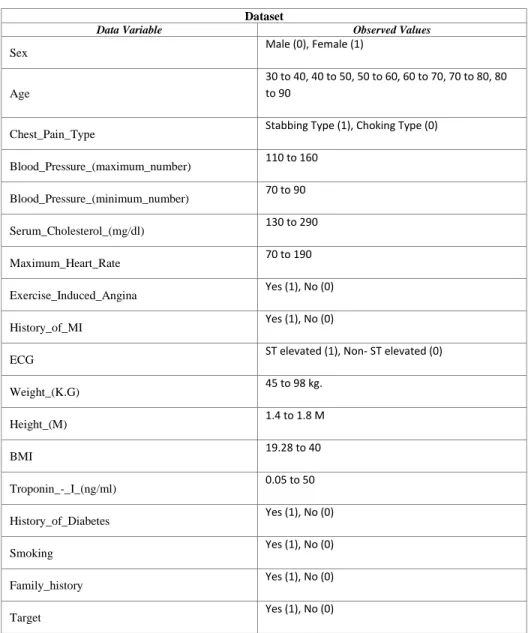
3.4.2 Data Pre-processing
At the very beginning, we made our dataset. We have selected the Training dataset on the basis of the quality of the data. We found different types of Text Data. We converted them which are meaningful numerical number like “Sex” to “Male (0), Female (1)”, “Target” to “No (0), Yes (1)”
and so on. Then we arranged it in such a way that a good classification result may come. To stand the cause, we introduced the data of patients who had negative results on whether they got heart disease or not. We mixed up those data with our existing data of patients with heart disease as positive.
Dataset
Data Variable Observed Values
Sex Male (0), Female (1)
Age
30 to 40, 40 to 50, 50 to 60, 60 to 70, 70 to 80, 80 to 90
Chest_Pain_Type Stabbing Type (1), Choking Type (0) Blood_Pressure_(maximum_number) 110 to 160
Blood_Pressure_(minimum_number) 70 to 90 Serum_Cholesterol_(mg/dl) 130 to 290
Maximum_Heart_Rate 70 to 190
Exercise_Induced_Angina Yes (1), No (0)
History_of_MI Yes (1), No (0)
ECG ST elevated (1), Non- ST elevated (0)
Weight_(K.G) 45 to 98 kg.
Height_(M) 1.4 to 1.8 M
BMI 19.28 to 40
Troponin_-_I_(ng/ml) 0.05 to 50
History_of_Diabetes Yes (1), No (0)
Smoking Yes (1), No (0)
Family_history Yes (1), No (0)
Target Yes (1), No (0)
Fig. 2: Dataset Range of Values
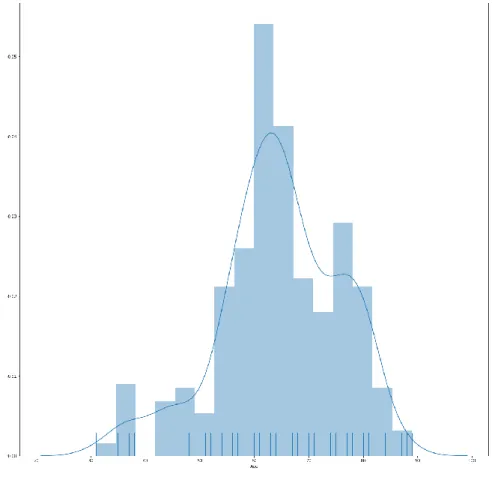
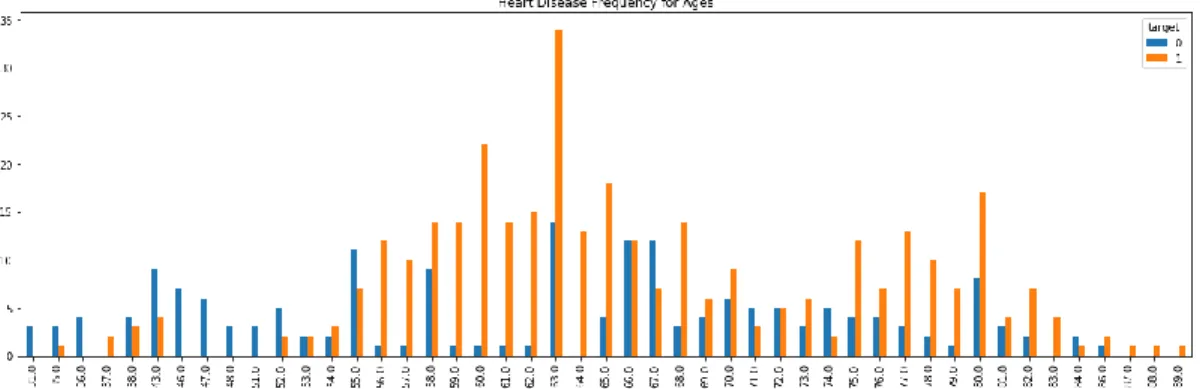
3.4.3 Data Analysis
For this our research purpose, we have taken data different type of Gender and different type Age (Fig. 3). In this feasibility research, we have able to find out Heart diseases patient according to age. We also show Age statistics of Myocardial patient (Fig. 4).
Fig. 3: Frequency for Ages
Fig. 4: Age Statistics
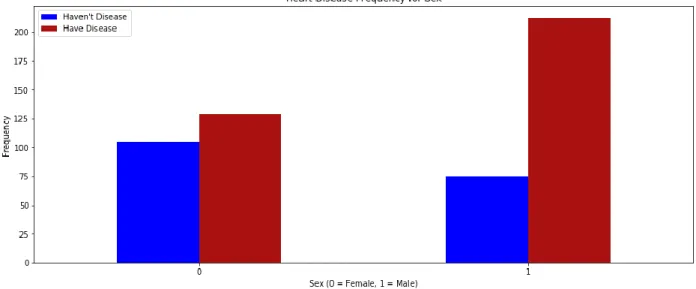
We found out a result which gender are mostly affected with Myocardial Infarction in our country (Fig. 5).
Fig. 5: Frequency for Sex
We also calculated the percentage of Male and Female patient from our Dataset (Fig. 6):
Fig. 6: Percentage of Sex
We also calculated the percentage of Have Diseases and Haven’t Diseases patient from our Dataset (Fig. 7):
Fig. 7: Percentage of Target
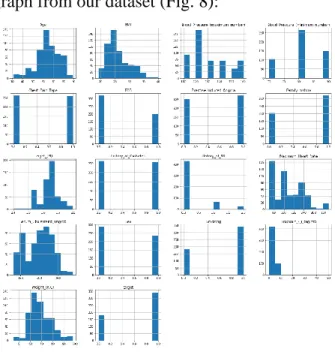
We can show a Histogram graph from our dataset (Fig. 8):
Fig. 8: Histogram Graph
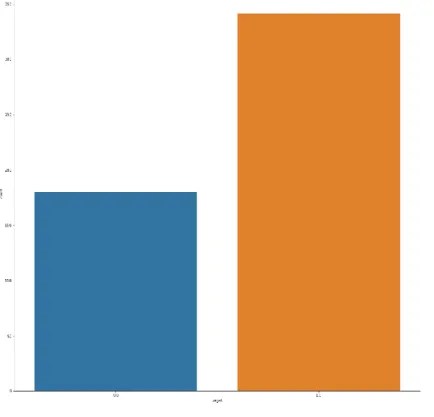
We can show our Target data graph which is declared “No (0), Yes (1)” from our dataset (Fig. 9):
Fig. 9: Target Data Bar Chart
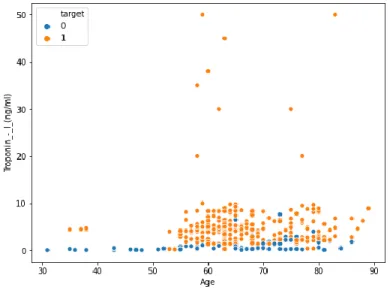
We showed here relation between Age vs Troponin – I from our dataset (Fig. 10):
Fig. 10: Age vs Troponin – I
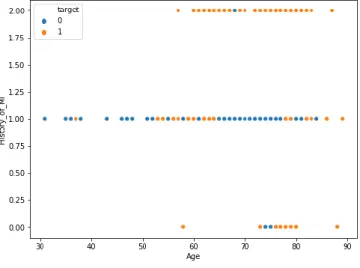
We showed here relation between Age vs History of MI from our dataset (Fig. 11):
Fig. 11: Age vs History of MI
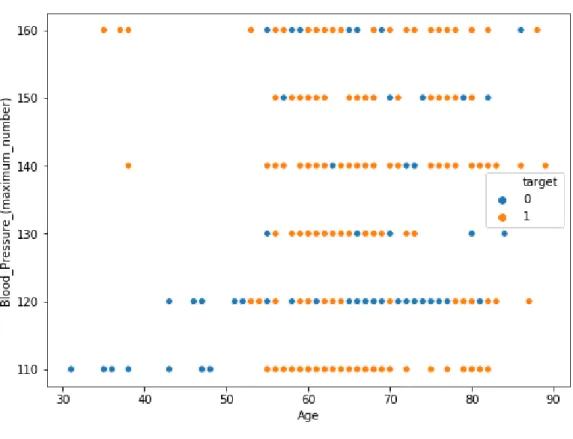
We showed here relation between Age vs Blood Pressure from our dataset (Fig. 12):
Fig. 12: Age vs Blood Pressure
History of Diabetes which is also a major reason for Myocardial infarction. Most of the time, if any patient has diabetes, Myocardial infarction possibility will be high. We show here Heart disease patient according to Diabetes from our dataset (Fig. 13):
Fig. 13: Heart Disease Patients According to Diabetes
We showed here Correlation Matrix understand the degree of association between the features from our dataset (Fig. 14):
Fig. 14: Correlation Matrix
3.4.4 Feature Selection
As a core concept in machine learning, Feature Selection hugely impacts the performance of the model. Irrelevant or partially relevant features can have negative impact on performance. There are several feature selection ways like Univariate Selection, Feature Importance and Correlation Matrix with Heatmap. We have used the Correlation Matrix.
3.4.4.1 Correlation Matrix with Heatmap
This one states how the highlights are related with each other or the objective variable. Correlation are certain (increment in one worth of highlight will build the estimation of the objective variable) or negative (increment in one estimation of highlight diminishes the value of the objective variable) Heatmap makes it simple to spot which highlights are most connected with the objective variable, we'll plot heatmap of associated highlights utilizing the seaborn library. The feature selection is shown in Fig.15:
Fig. 15: Feature Selection
3.4.4.2 Classification
We applied some algorithms. They are K-Nearest Neighbours, Decision Tree, Linear Regression, Logistic Regression, Naive Bayes Classifier.
3.4.4.2.1 K-Nearest Neighbours
KNN is a non-parametric AI information on calculation. The KNN calculation is a regulated contemplating strategy. This ability that all the records is named and the calculation figures out how to foresee the yield from the information. It performs well regardless of whether the preparation data is gigantic and noisy values. The realities are partitioned into preparing and test sets. The train set is utilized for model developing and preparing. Ak-esteem is concluded which is every now and again the rectangular foundation of the assortment of perceptions. Presently the investigate information is normal on the model fabricated. There are unique separation measures.
For relentless factors, Euclidean separation, Manhattan separation and Minkowski separation measures can be utilized. Be that as it may, the in numerous cases utilized measure is Euclidean separation [9]. The formula for Euclidean distance is as follows:
𝐝 = ∑𝒌𝒊=𝟏(𝒙𝒊− 𝒚𝒊) (1)
3.4.4.2.2 Naive Bayes Classifier
Naive Bayes Classifier is an arrangement of directed learning calculations dependent on applying Bayes‟ hypothesis with the naive presumption of freedom between each match of highlights. This is a classification algorithmic rule that is employed once the spatial property of the input is extremely high. It is based on Bayes theorem.The Naive Bayes (NB) algorithm is an arrangement strategy dependent on Bayes' theorem with the presumption that all highlights are free of one another.
Bayes’ theorem is represented by the following equation:
P(Y/X) = P(X/Y) P(X) (2)
This computes the likelihood of Y given X where X is the prior event and Y is the reliance event.
It needs less preparing information. It tends to be utilized for paired grouping issues and is extremely straightforward.
Where A and B are features
• P(B|A) is the probability of B given A.
• P(A|B) is the probability of A given B.
• P(B) is the prior probability of B.
• P(A) is the prior probability of B.
The NB equation can be written as follows:
P(B|A) =P(a1|B) P(a2|B) ……. P(an|B) P(B) (3)
3.4.4.2.3 Decision Tree
Decision Tree is one of the strategies to show a calculation. It is a customary AI calculation. In coronary illness, there are various factors, for example, cigarette, BP, Hypertension, age and so on. The endeavor of the Decision tree lies in the choice of the root hub. This issue used in root hub need to positively characterize the data. We tend to fabricate utilize matured because of the reality the root hub. The Decision tree is easy to decipher. They are non-parametric and they implicitly do characteristic selection.
Fig. 16: Decision Tree Classification
3.4.4.2.4 Linear Regression
Linear regression makes an endeavor to display the connection between 2 factors by fitting a condition to found out data. One variable is considered to be an informative variable, and furthermore the option is considered to be a variable amount. For instance, a model maker would potentially need to relate the loads of individuals to their statures utilizing a relapse model. A linear regression line has a condition of the structure:
Y = a + bX (4)
3.4.4.2.5 Logistic Regression
Logistic regression is the satisfactory multi-variate examination to direct once the needy variable is separated (binary) [10]. Like all the regression strategic Logistic regression prognostic analysis.
Logistic regression is utilized to disclose data and to clarify the association between one ward parallel variable and one or a great deal of ostensible, ordinal, stretch, or radio level independent factors. The logistic regression model uses the logistical to perform to squeeze the output of the linear equation between zero and one [11].
Below is an example logistic regression equation:
y = 𝒆(𝐛𝟎 + 𝐛𝟏∗𝐱) / (1 + 𝒆(𝒃𝟎 + 𝒃𝟏∗𝒙)) (5)
Fig. 17: Logistic Regression
CHAPTER 4
EXPERIMENTAL RESULTS AND DISCUSSION
4.1 Introduction
For gaining a good result, our research project depends on analysis and the perfect model. To find the prediction, we took the train data and trained the machine. Then we took the test data for test. After that we find out accuracy. For building a model by using data and finding proper result is very necessary.
4.2 Performance Evaluation Methods
The system to predict the heart attack is implemented in Jupyter Notebook. The database is split randomly into 2 sets, those are training set and testing set. 80% records are used for training and the rest 20% are used for testing. The evaluation of performance is completed by computing the share value of several parameters like Accuracy, Specificity and Sensitivity by using following equations:
Sensitivity = 𝑇𝑃
𝑇𝑃+𝐹𝑁 *100 (6)
Specificity = 𝑇𝑁
𝑇𝑁+𝐹𝑃*100 (7)
Accuracy = 𝑇𝑃+𝑇𝑁
𝑇𝑃+𝑇𝑁+𝐹𝑃+𝐹𝑁*100 (8)
True Positive (TP): The accuracy is fully positive.
True Negative (TN): The accuracy is slightly positive.
False Positive (FP): The accuracy is slightly negative.
False Negative (FN): The accuracy is fully negative.
4.3 Outcome of Algorithms
Different machine learning algorithms is used for the classification method. Five completely different machine learning algorithms are utilized in this work, all of them offer completely different accuracies. The algorithms used K-Nearest Neighbours Neighbors, Decision Tree, Linear Regression, Logistic Regression, Naive Bayes Classifier. The accuracy scores of the algorithms are shown in the Table below:
Model Name Accuracy
K-Nearest Neighbours 90%
Decision Tree 86.66%
Linear Regression 49%
Logistic Regression 87%
Naive Bayes Classifier 87.61%
Fig. 18: Accuracy Table of Model
4.3.1 K-Nearest Neighbours
The outcome of K-Nearest Neighbours:
Fig. 19: K-Nearest Neighbours Output
4.3.2 Decision Tree
The outcome of Decision Tree:
Fig. 20: Decision Tree Output
Fig. 21: Decision Tree Result
(Fig. 21) We see that the accuracy rate in this model is 86.66% .
4.3.3 Linear Regression
The outcome of Linear Regression:
Fig. 22: Linear Regression Result
(Fig. 22) We see that the accuracy rate in this model is 49%.
4.3.4 Logistic Regression
The outcome of Logistic Regression:
Fig. 23: Logistic Regression Result
(Fig. 23) We see that the accuracy rate in this model is 87%.
4.3.5 Naive Bayes Classifier
The outcome of Naive Bayes Classifier Classifier:
Fig. 24: Naive Bayes Classifier Result
(Fig. 24) We see that the accuracy rate in this model is 87.61%.
4.3.6 Features Importance The full feature of this project is:
Fig. 25: Features Importance Result
Coefficient vs Attributes are shown in this feature (Fig. 25).
4.4 Accuracy Model
Fig. 26: Accuracy Model Bar chart
(Fig. 18) We see that K-Nearest Neighbours has the highest accuracy rate which is 90% and Linear Regression has the lowest accuracy rate which is 49%.
4.5 The Probability of MI
The probability of MI relies on various rich factors. We have made different combinations of those rich factors resulting in a percentage which predicts the possibility of someone to get affected by heart attack.
Troponin-I is a major factor. An average person having no heart disease have troponin level of 0.04- 0.4 mg/ml. Above this, the risk becomes really high to get affected by heart attack.
Now let's have a look at those combinations. Let's say in general, 1 = Yes. The factors are combined through summation mark (+). Then there is a percentage for each combination consisting all those factors being positive at a time. In case of History of MI (2) denotes that the patient had it twice already. And in case of ECG (1) denotes ST elevated. We also calculated the percentages of particular factors later.
• Family history (1) + History of Diabetes (1) + ECG (1) + History of MI (2) + Exercise Induced Angina (1) = 100%
• Family history (1) + History of Diabetes (1) +ECG (1) + History of MI (1) + Exercise Induced Angina (1) = 98%
• Family history (1) + History of Diabetes (1) +ECG (1) + History of MI (1) + Troponin (>0.4)
= 95%
• History of Diabetes (1) + ECG (1) + History of MI (1) + Exercise Induced Angina (1) = 95%
• History of Diabetes (1) + ECG (1) + Exercise Induced Angina (1) = 90%
• ECG (1) + History of MI (1) + Family history (1) = 88%
• History of Diabetes (1) + ECG (1) + Family history (1) = 85%
• ECG (1) + Family history (1) = 84%
• ECG (1) + History of MI (1) = 83%
• History of Diabetes (1) + Family history (1) + Troponin (>0.4) = 82%
• History of Diabetes (1) = 80%
• Exercise Induced Angina (1) = 79%
• ECG (1) = 78%
• History of Diabetes (1) = 70%
• Smoking (1) = 30%
Otherwise = 10%, this one is separated from all of those combinations & particulars mentions above.
CHAPTER 5 FURTHER STUDY
5.1 Summary of the Study
Machine learning is associate application of computing (AI) that gives systems the flexibility to mechanically learn and improve from expertise without being expressly programmed. Machine learning focuses on the event of Computer programs that may access information and use it learn for themselves.
To complete our analysis work, we've studied however the Machine learning techniques are used for obtaining the solution of various kinds of machine learning problem. There are 2 sorts of Machine learning method that's supervised Machine Learning and unsupervised Machine learning.
This Study notable us that our analysis is concerning supervised Machine learning and it's additionally a Classification Model problem.
We studied about prototype, clustering, correlation of data, classification task, classification method, different types of algorithm and data testing also.
5.2 Future Work
In today’s world most of the data is processed, the data is distributed but it's not being utilized properly. By Analyzing the offered information, we are able to find out unknown patterns. The primary motive of this analysis is that the prediction of heart diseases with high rate of accuracy.
For predicting the heart disease, we are able to use Naive Bayes Classifier, Decision Tree, K- Nearest Neighbors, Linear Regression and Logistic Regression in machine learning. The long run scope of the paper is that the prediction of heart diseases by applying advanced techniques and algorithms within less time with better quality.
We are also making a website where anyone can check the probability of heart diseases. I think it will be helpful for all the CVDs patients.
CONCLUSION
Now a days, machine plays a key role in many health-related realms such as the development of new medical procedures, the handling of patient data and records as well as the treatment of heart diseases. Most of the information in today's world is processed, these are sometimes scattered and not properly used. These knowledges if analyzed for hidden patterns may be place to smart use.
Therefore, it's become a good space for analysis with increasing importance and facilities.In the above paper we've studied numerous classification algorithms that may be used for classification of Myocardial infarction databases additionally we've seen completely different techniques that may be used for classification and also the accuracy obtained by them.
Myocardial infarction has become one in every of the main concern because of the leading mortality. Major components of the world are hit by Myocardial infarction diseases. With of these major factors prediction of heart diseases becomes terribly important and therefore the models that predict CVDs would bring a major impact in reducing the mortality.
The objective of our work is to provide a machine learning based system for the automatic detection of heart disease. For predicting attack considerably eighteen attributes are selected for Data collection. It utilizes the data such as blood pressure, serum cholesterol, heart rate, BMI, troponin, diabetes, smoking and so on to predict the chance of Myocardial Infarction (heart attack) in future. Our experimental result shows that the classification accuracy is found to be higher exploitation K-Nearest Neighbors algorithmic rule compare to alternative algorithms.
REFERENCES
[1] “BANGLADESH: CORONARY HEART DISEASE”. Available:
https://www.worldlifeexpectancy.com/bangladesh-coronary-heart-disease [Accessed: March 8th, 2020].
[2] Hazra, Animesh, et al. "Heart Disease Diagnosis and Prediction Using Machine Learning and Data Mining Techniques: A Review", Advances in Computational Sciences and Technology 10.7 (2017): 2137-2159.
[3] Benjamin EJ et al. Heart Disease and Stroke Statistics 2018 At-a-Glance (2018).
[4] Ramandeep Kaur et al. "Review - Heart Disease Forecasting Pattern using Various Data Mining Techniques", International Journal of Computer Science and Mobile Computing 5.6 (2016): 350-354.
[5] Health Grove, “Cardiovascular Diseases in Bangladesh”, by Graphiq. [Online]. Available:
http://global-disease-burden.healthgrove.com/l/41188/Cardiovascular-Diseases-in- Bangladesh#Overview&s=3D2kvJ [Accessed: March 8th, 2020].
[6] Y. E. Shao, C.-D. Hou, and C.-C. Chiu, “Hybrid intelligent modelling schemes for heart disease classification”, Applied Soft Computing,vol. 14, pp. 47–52, 2014.
[7] S. Gupta, D. Kumar, and A. Sharma, “DATA MINING CLASSIFICATION TECHNIQUES APPLIED FOR”, vol. 2, no. 2, pp. 188–195, 2011.1.
[8] WHO, “Cardiovascular diseases (CVDs)”, Published by WHO, 2013 [Online]. Available:
http://www.who.int/mediacentre/factsheets/fs317/en/ [Accessed: March 8th, 2020].
[9] V. Manikantan and S. Latha, “Predicting the Analysis of Heart Disease Symptoms Using Medicinal Data Mining Methods”, Int. J. Adv. Comput. Theory Eng., vol. 2, no. 2, pp. 5–10, 2013.
[10] “What is Logistic Regression?”. Available: https://www.statisticssolutions.com/what-is- logistic-regression/ [Accessed: March 8th, 2020].
[11] “Logistic Regression”. Available: https://christophm.github.io/interpretable-ml- book/logistic.html. [Accessed: March 8th, 2020].
1 1
1
ORIGINALITY REPORT
14 %
SIMILARITY INDEX
%
INTERNET SOURCES
%
PUBLICATIONS
14 %
STUDENT PAPERS
PRIMARY SOURCES
Submitted to National Institute of Technology, Raipur
Student Paper
Submitted to Visvesvaraya Technological University, Belagavi
Student Paper
Submitted to Jaypee University of Information Technology
Student Paper
Submitted to TAFE NSW Higher Education
Student Paper
%
Submitted to Strayer University
Student Paper
%
Submitted to October University for Modern Sciences and Arts (MSA)
Student Paper
Submitted to Fiji National University
Student Paper
%
1
2
3
4
5
6
7
3 % 2 % 1 %
1 %
Submitted to Texas A & M University, Kingville
Student Paper
Submitted to University of Sydney
Student Paper
Submitted to Daffodil International University
Student Paper
Submitted to Institute of Technology, Nirma University
Student Paper
Submitted to Vels University
Student Paper
Submitted to 64577
Student Paper
Submitted to Indian Institute of Technology- Bhubaneswar
Student Paper
Submitted to University of Maryland, University College
Student Paper
Submitted to Middle East Technical University
Student Paper
Submitted to Sheffield Hallam University
1 %
< 1 %
< 1 %
< 1 %
< 1 %
< 1 %
< 1 %
< 1 %
< 1 %
< 1 % 1
9
10
11
12
13
14
15
16
17
Technology and Medicine
Student Paper
Submitted to Delhi Technological University
Student Paper
Submitted to Leeds Metropolitan University
Student Paper
Submitted to Victorian Institute of Technology
Student Paper
Submitted to Bahcesehir University
Student Paper
Submitted to Universiti Sains Malaysia
Student Paper
Submitted to National College of Ireland
Student Paper
Submitted to CSU, Fullerton
Student Paper
Submitted to The University of Manchester
Student Paper
Submitted to Auckland University of Technology
Student Paper
Submitted to University of Warwick
1
< 1 %
< 1 %
< 1 %
< 1 %
< 1 %
< 1 %
< 1 %
< 1 %
< 1 %
< 1
20
21
22
23
24
25
26
27
28
29
1
Exclude quotes Off Exclude bibliography Off
Exclude matches Off