©Daffodil International University i A DEEP LEARNING-BASED APPROACH FOR EDIBLE, INEDIBLE AND
POISONOUS MUSHROOM CLASSIFICATION
BY
NUSRAT ZAHAN ID: 172-15-9716
This Report Presented in Partial Fulfillment of the Requirements for the Degree of Bachelor of Science in Computer Science and Engineering
Supervised By Md Zahid Hasan Assistant Professor Department of CSE
Daffodil International University
DAFFODIL INTERNATIONAL UNIVERSITY
DHAKA, BANGLADESH
MAY 2021
©Daffodil International University ii APPROVAL
This Project/internship titled “A Deep Learning-Based Approach for Edible, inedible and Poisonous Mushroom Classification”, submitted by Nusrat Zahan, ID No: 172-15-9716 to the Department of Computer Science and Engineering, Daffodil International University has been accepted as satisfactory for the partial fulfillment of the requirements for the degree of B.Sc. in Computer Science and Engineering and approved as to its style and contents. The presentation has been held on 02-06-2021.
BOARD OF EXAMINERS
Dr. Touhid Bhuiyan Professor and Head
Department of Computer Science and Engineering Faculty of Science & Information Technology Daffodil International University
Chairman
Md. Sadekur Rahman Assistant Professor
Department of Computer Science and Engineering Faculty of Science & Information Technology Daffodil International University
Internal Examiner
Dr. Fizar Ahmed Assistant Professor
Department of Computer Science and Engineering Faculty of Science & Information Technology Daffodil International University
Internal Examiner
Dr. Shamim H Ripon Professor
Department of Computer Science and Engineering East West University
External Examiner
©Daffodil International University iii
DECLARATION
I hereby declare that, this project has been done by me under the supervision of Md Zahid Hasan, Assistant professor, Department of CSE, Daffodil International University. I also declare that neither this project nor any part of this project has been submitted elsewhere for award of any degree or diploma.
Supervised by:
Md Zahid Hasan Assistant Professor Department of CSE
Daffodil International University
Submitted by:
Nusrat Zahan ID: 172-15-9716 Department of CSE
Daffodil International University
©Daffodil International University iv
ACKNOWLEDGEMENT
First I express my heartiest thanks and gratefulness to Almighty Allah for His divine blessing which makes me possible to complete the final year project/internship successfully.
I really grateful and wish my profound indebtedness to Md Zahid Hasan, Assistant professor, Department of CSE, Daffodil International University, Dhaka, deep knowledge
& keen interest of my supervisor in the field of Machine Learning to carry out this project.
His endless patience, scholarly guidance ,continual encouragement , constant and energetic supervision, constructive criticism , valuable advice ,reading many inferior draft and correcting them at all stage have made it possible to complete this project.
I would like to express my heartiest gratitude to Dr. Touhid Bhuiyan, Head, Department of CSE, for his kind help to finish our project and also to other faculty members and the staffs of CSE department of Daffodil International University.
Finally, I must acknowledge with due respect the constant support and patients of my parents.
©Daffodil International University v
ABSTRACT
Mushroom is one of the fungi types' foods that has the most powerful nutrients on the plant.
However, there are as yet different mushroom species that have not been identified.
Nevertheless, the identification of edible, non-edible, and poisonous mushrooms among its existing species is a must due to its high demand for peoples’ everyday meals and major advantage on medical science. For this purpose, we applied InceptionV3, VGG16, and Resnet50 on 8190 mushrooms images where the ratio of training and testing data was 8:2.
Contrast Limited Adaptive Histogram Equalization (CLAHE) method was used along with InceptionV3 to obtain the highest test accuracy. CLAHE is a variant of Adaptive Histogram Equalization (AHE) which improves the local contrast-enhancing of images and the definitions of edges in each area of an image by limiting over amplify noise is moderately similar regions of an image. We show a comparison between contrast-enhanced and without contrast-enhanced methods. Finally, InceptionV3 has achieved 88.40% accuracy which is the highest among the rest implemented algorithms.
©Daffodil International University vi
LIST OF FIGURES
FIGURES PAGE NO
Figure 1: Working process of the proposed model 7
Figure 2: Different Classes of Edible Mushroom 8
Figure 3: Different Classes of Inedible Mushroom 9
Figure 4: Different Classes of Poisonous Mushroom 9
Figure 5: (a) Original low contrast image (b) Converted the image BGR to greyscale and (c) Apply Contrast-enhanced technique CLAHE (CL=0.1, BS=8x8)
11
Figure 6: Basic Structure of ANN Architecture 12
Figure 7: Architecture of Convolutional Neural Network. 14 Figure 8: A 5x5x1 image convolved with a 3x3x1 kernel to become a 3x3x1
convolved feature
15
Figure 9: Representation of Max Pooling Layer with Hyperparameters 2 X 2 filters and Stride size 2
16
Figure 10: Schematic Representation of InceptionV3 18 Figure 11: Test Accuracy of different Transfer Learning Architecture 20 Figure 12: Feature map of the raw image without contrast-enhanced
technique
23
Figure 13: Feature map of the contrast-enhanced image 24
©Daffodil International University vii
LIST OF TABLES
TABLES PAGE NO
Table 1: Confusion matrix of CNN architectures using contrast-enhanced image
22
Table 2: Performance matrices of CNN architectures using raw image 22 Table 3: Performance matrices of CNN architectures using contrast-enhanced
image
23
Table 4: Comparative analysis 25
©Daffodil International University 1
CHAPTER 1 Introduction
1.1 Introduction
Mushroom is the fleshy fruit body of different classes of fungus which is adherent to Basidiomycetes growing on a ground surface. About 14000 species of mushrooms are defined but it is agreed by scientists that many more mushroom species are still undiscovered. Among the discovered mushroom species there are 25% edible, 50%
inedible, 20% can make anyone sick, 4% may test good, and the rest 1% can let anyone die [1]. Some of the edible mushrooms may not taste good but there are some reasons to eat them. Edible mushrooms have significant points of interest like they can kill cancer cells, infections as well as improving the human immune system. Inedible mushrooms are too extreme to even think about chewing, similar to some woody rack mushrooms. It is also indigestible and can expel the human digestive tract. Furthermore, lack of knowledge about poisonous mushrooms, a huge number of people die from eating them. Probably, mushrooms with unblemished cells, splendid tones as well as the absence of birds and insects communicating with them are poisonous.
Mushrooms are in rich of an unassuming measure of fiber and over twelve minerals and nutrients with copper, potassium, magnesium, zinc, and vitamin B nutrients. It is cholesterol-free along with low in calories and fat. Mushrooms are additionally high in antioxidants such as selenium and glutathione. It can keep anyone fit and protect the brain from aging along with boosting memory power. It is very much helpful for people having heart problems and diabetes. It can also assist in strengthening bones. Despite being a testy food itself as well as healthy, mushroom increases the test of other Thai and Chinese food which is the reason behind its huge demand in almost every five-star restaurant. Moreover, the mushroom is used for making medicine.
Mushrooms should never be eaten without distinguishing precisely and the edibility of the species is known. Toxic mushrooms denote less than 1% of the world's identified mushrooms hence comprise the hazardous and sometimes deadly species. It is very much
©Daffodil International University 2 needed to correctly identify edible mushrooms from non-edible and poisonous. The purpose of this study is to classify edible, inedible, and poisonous mushrooms using a deep learning approach along with computer vision. Deep learning is a subset of machine learning in artificial intelligence that impersonates the human brain to behave similarly while processing data and producing patterns. Unlabeled and unstructured data to be used in deep learning which is a network having the skill of learning from data. This study aims to classify mushroom type through Convolutional Neural Network. CNN is considered to be the most powerful visual model in computer vision for empowering accurate segmentation by yielding hierarchies of features. They are likewise known to perform estimates comparatively quicker than different algorithms while keeping up reasonable performance simultaneously [2].
1.2 Problem Statement
Approximate 20% of the national GDP in Bangladesh depends on agriculture as well as this sector has a major contribution to the economy in Bangladesh. However, Mushroom is a very well-known crop and severe demand in the business sector. It also has different nutrients and medical ingredients which protects people from different kinds of diseases.
On the other hand, due to the availability of different types of mushrooms in the world and the similar structure of some mushrooms, it is very difficult to distinguish them with the naked eye. If we consume poisonous or inedible mushrooms instead of edible mushrooms then it can cause harmful effects in our body. Therefore, Identifying mushrooms correctly in their own classes at the right time is also crucial to avoid detrimental impacts from the consumption of poisonous constituents existing in a mushroom. As well as, how a system correctly classifies the categories of mushrooms along with computer vision and machine learning techniques.
©Daffodil International University 3
1.3 Research Objectives
a) To investigate research gaps of the existing machine vision-based systems to correctly classify different categories of mushrooms in their classes.
b) To apply a straightforward machine vision-based approach for improving the accuracy for separating them in their class.
1.4 Research Questions
a) How can we investigate the gaps of the existing machine vision-based systems that can correctly classify different categories of mushrooms?
b) How can we develop a machine vision-based approach for improving the accuracy of differentiating different kinds of mushrooms correctly in their class?
1.5 Report Layout
Chapter 1 presents the research introduction, objectives, and key research questions.
Chapter 2 highlights a detailed review of the related literature.
Chapter 3 describes the proposed methodology with a detailed description.
Chapter 4 explains the result analysis and comparison with existing work.
Chapter 5 concludes the present research along with a direction for future work.
©Daffodil International University 4
CHAPTER 2 Literature Review
2.1 Related works
Previously several researchers have made several attempts by applying different techniques for the classification of mushrooms but didn't get a satisfactory result. Humans have been recognizing poisonous mushrooms considering the shape, color, odor, and secretion skins by experience for many years [3]. But the accuracy of this intuitive method is very low and the annual poisoning events have proven it. Thus, it's not a solid technique for recognizing whether mushrooms are toxic. Besides, this technique depends on background knowledge procured by people. Individuals get a great deal of background knowledge and capabilities with the goal that the acknowledgment precision rate is high. Otherwise, the exactness rate is low.
LaBarge [4] proposed a Mushroom Diagnosis Assistance System (MDAS) which is mainly a mobile phone device involving three mechanisms of web application (server), unified database, and mobile phone application. In this work, they mainly focused on the classification rate between the Naive Bays and Decision Tree classifiers. Their suggested system at first selected the attributes of mostly known mushrooms and then specified their types. Another mobile-based application had been developed by Al-mejibli et. al [5] titled Mushroom Diagnosis Assistance System to realizing safety while collecting mushrooms.
In this work, they only reliant on the most known mushroom attributes for recognizing its type. They also did a comparison among decision tree and naïve bayes classifiers and shows the decision tree was better on error measurements, correctly classified samples as well as incorrectly classified samples.
Besides distinguishing mushroom diseases, Chowdhury et.al [6] acknowledged a manner based on data mining techniques as Naïve Bayes, RIDOR, and SMO algorithms. They
©Daffodil International University 5 focused on detecting most appeared symptoms of mushrooms for discovering mushroom diseases. They also performed a comparison of the mentioned algorithms and found Naïve Bayes giving better accuracy in classification. Different machine learning techniques had been applied by Mohammad et al. [7] for classifying mushroom fungi based on mushroom images. Their study represents that though they extracted features from images of both with backgrounds and without backgrounds but got a better result with background images exclusively while applying KNN algorithms along with and with Eigen features extraction and real dimensions of mushroom. They got 94% accuracy while extracting features from images along with real dimensions and 87% accuracy only when extracting features from images. But other researchers Pranjal et al. [8] had claimed in their study that removing background from the images can give better accuracy. They developed a classification method focusing on a feature-based machine learning approach to differentiating edible and poisonous mushrooms. Their performed approach achieved only 76.6% accuracy which is not satisfactory enough.
According to the work [9], Yingying et al. focused only recognize the mushroom toxicity using visual features of mushrooms. Cap shape and color of mushrooms were used as the features of this research and logistic regression, support vector machine, and multi-grained cascade forest were the three pattern-recognition methods used for extracting the features.
They got 98% classification accuracy for the multi-grained cascade forest classifier which was better compared with the other two classifiers.
As several studies had been made in the past by several researchers but most of the studies had made a comparison or just classified mushroom types as well as distinguishing mushroom diseases rather than identifying which mushroom is edible, non-edible, and poisonous. The main purpose of our study is to fill this gap and correctly classify the edible, non-edible, and poisonous mushroom types.
©Daffodil International University 6
2.2 Scope of the Problem
Researchers tried for many years in several ways to identify mushrooms based on their shape, color, odor, and secretion skins by experience but they didn’t reach a satisfactory result. There are more than 100 different types of mushrooms are available in the world as known as edible, inedible, and poisonous. Some of the studies mentioned that for identifying a mushroom, the system depends on background knowledge which is obtained by people and it is a very time inefficient process. Some of the works mentioned the mobile or web-based application where they didn’t have sufficient data to correctly classify the mushroom in their types. Some researchers talked about the recognition of toxicity levels in different mushrooms using machine learning techniques. Some of the works focused on classifying different mushroom diseases using machine learning methodology and some were identifying the separate classes’ prediction like edible and poisonous where their accuracy level was very low.
2.3 Challenges
There are some researches challenges focused on this study which are following:
a) Data Collection: There is no benchmark dataset available online for classifying.
Therefore, it was very arduous work to accumulate the image data from the mushroom’s field.
b) Raw Image Processing: Images collected from different sources were sometimes low or high contrast or noisy. So, the challenge is to prepare the images perfectly for classification which will be contrast-enhanced and noise-free.
c) Select Machine Learning Approach: Several researchers use different machine learning techniques to complete the tasks effortlessly. So, the selection of optimum machine learning technique which can correctly classify different categories of mushroom.
d) Accuracy Improvement
:
Another challenging issue is to improve the accuracy of the machine learning model as well as selecting the optimum model.©Daffodil International University 7
CHAPTER 3 Materials and Methods
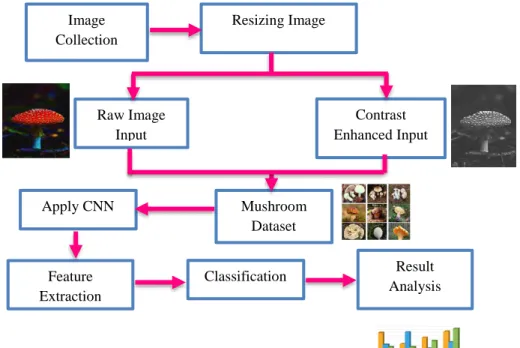
3.1 Working Process
There are five different stages to accomplish the entire work. These are the following:
a) Image Acquisition and prepared dataset b) Image Pre-processing
c) Apply Machine Learning Algorithm d) Classify Mushroom
e) Result Analysis
The total working process starting from image collection to result in the analysis is presented in figure 1 and explains elaborately in the following sections.
Figure 1: Working process of the proposed model Mushroom
Dataset Image
Collection
Resizing Image
Raw Image Input
Contrast Enhanced Input
Apply CNN
Feature Extraction
Classification Result
Analysis
©Daffodil International University 8
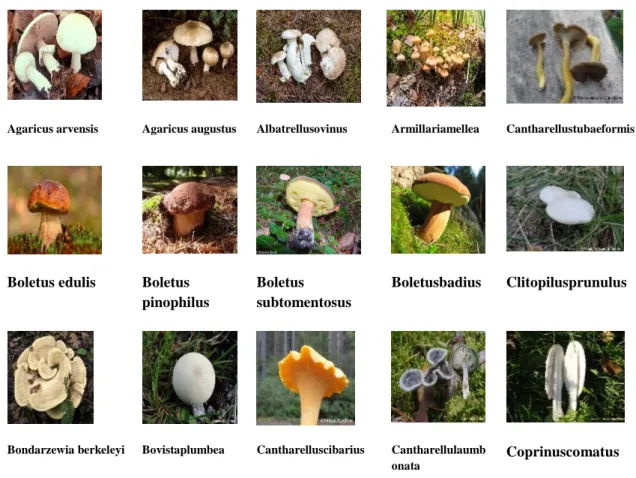
3.2 Dataset Preparation
In this study, a dataset is used containing 8190 images of 45 types of mushroom species.
Among them, one-third are edible, one-third are inedible and the rest of them are poisonous. Images are collected from different mushroom centers as well as the internet [10].
Agaricus arvensis Agaricus augustus Albatrellusovinus Armillariamellea Cantharellustubaeformis
Boletus edulis Boletus pinophilus
Boletus subtomentosus
Boletusbadius Clitopilusprunulus
Bondarzewia berkeleyi Bovistaplumbea Cantharelluscibarius Cantharellulaumb onata
Coprinuscomatus
Figure 2: Different Classes of Edible Mushroom
©Daffodil International University 9 Figure 3: Different Classes of Inedible Mushroom
Amanita muscaria Amanita arginate Amanita phalloides Amanita porphyria Amanita regalis
Amanita rubescens
Amanita virosa Boletus satanas Coprinopsis atramentaria
Cortinarius orellanus
Cortinarius rubellus
Cortinarius semisanguineus
Galerina 9arginate Gyromitra esculenta
Hebeloma crustuliniforme Figure 4: Different Classes of Poisonous Mushroom
Albatrellus confluens
Amanita ceciliae Amanita fulva Bankera fuligineoalba
Calocera viscosa
Chalciporus piperatus
Clitocybe nebularis Clitocybe gibba Collybia dryophila Coltricia perennis
Coprinus plicatilis Cortinarius alboviolaceus
Cortinarius armillatus
Cortinarius collinitus
Cortinarius croceus
©Daffodil International University 10 The collected images are not suitable in size and color and some are noisy. A contrast- enhanced method CLAHE was applied to improve the image quality. A large number of the dataset was needed to train the model but the collected data was insufficient. For this reason, the overfitting problem arises and to overcome it, various data augmentation techniques like rotation, translation, scaling and shearing were applied. Figure 2-4 shows 45 types of different mushroom species randomly.
3.3 Image Pre-processing
Pre-processing is a known phenomenon for procedures with images on the minimum stage of reflection where input and output are equally penetrating images. The original data which is seized through the sensor containing a predominance image typically embodied via an image matrix function values (brightness’s) is impersonated by the output images.
Enhancement of the image data along with covering of contortions through upgrading more or less image features significant for additional processing. Even though mathematical changes of images (for example rotation, scaling, translation) are sorted among pre- processing strategies, comparative methods are utilized here.
3.3.1 Image Enhancement Technique
The histogram equalization technique is known as a grayscale transformation for contrast enhancement. This technique can consistently disperse the penetrating stages over the entire penetrating measure. Histogram adjustment may create an outcome that is more awful than the first picture since the histogram of the subsequent picture turns out to be roughly level. Enormous tops in the histogram can be brought about by a tedious region.
In this way, histogram balance may prompt an expanded deceivability of undesirable image noises. This implies that it doesn't adjust to neighborhood contrast prerequisite; minor differentiation contrasts can be altogether squandered once the quantity of pixels dwindling in a specific dark reach is generally little. In this strategy, a picture is isolated into sub- pictures or squares, and histogram equalization is achieved to individually sub-pictures or
©Daffodil International University 11 squares. At that point, obstructing antiquities among adjoining blocks is limited by separating or bilinear interruption.
3.3.2 Contrast Limited Adaptive Histogram Equalization
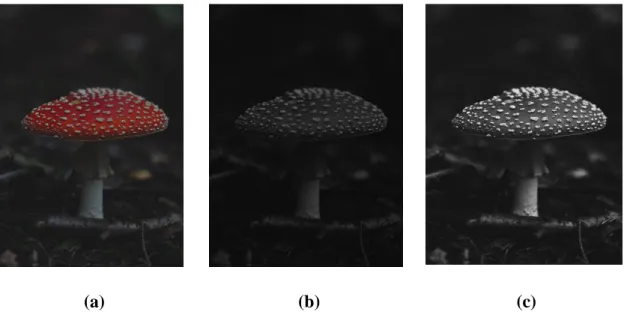
The CLAHE method is used to overcome the noise problem by using a clip limit. As far as possible, the intensification by snipping the histogram at predefined esteem before figuring the cumulative distribution function (CDF). The CLAHE bounds the intensification by extracting the histogram at a predefined significance formerly calculating the CDF. This bounds the gradient of the CDF and consequently of the conversion function. The clip limit, or the value on which the histogram is trimmed, is defined by the normalization of the histogram and, as a result, by the size of the neighborhood area. The CLAHE consumes dual crucial factors: block size as well as clip limit. The image quality is controlled by these two parameters. Figure 5 shows the low contrast image which is taken by the user and then converted the image from BGR to greyscale and then the CLAHE method has been applied with clip limit 0.1 and block size is 8X8.
(a) (b) (c)
Figure 5. (a) Original low contrast image (b) Converted the image BGR to greyscale and (c) Apply Contrast-enhanced technique CLAHE (CL=0.1, BS=8x8)
©Daffodil International University 12
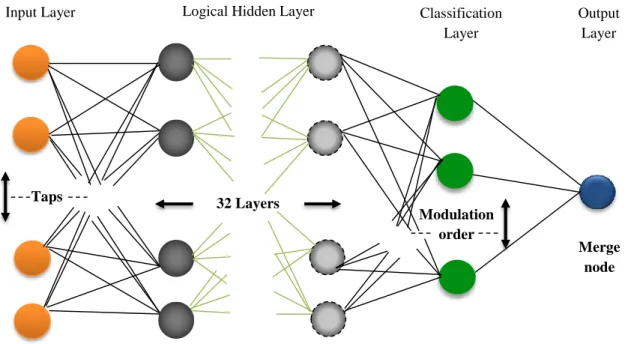
3.4 Artificial Neural Network
Artificial Neural Networks (ANNs) are mainly considered as computational dispensation structures that are highly enlivened by the way biological nervous structures (for example the human brain) activate. ANNs are mostly included a great amount of consistent computational nodes (indicated to as neurons)of that employ interweave in a disseminated manner towards cooperatively gain from the input to improve its final output. The fundamental architecture of the ANN model is shown in figure 6.
We would weigh the input to the input layer typically as a multidimensional vector that will disperse it to the hidden layers. The hidden layers will at that point settle on verdicts from the preceding layer and weigh up in what way a stochastic variation inside itself hindrances or develops the final output which is alluded to as the way towards learning.
Consuming numerous hidden layers weighted upon one another is frequently titled deep learning.
Figure 6: Basic Structure of ANN Architecture
Input Layer Logical Hidden Layer Classification
Layer
Output Layer
Merge node
Taps 32 Layers
Modulation order
©Daffodil International University 13 Supervised learning and unsupervised learning are the two main crucial learning models in image processing techniques. Supervised learning will be learning over pre-marked inputs, which go about as goals. A bunch of input esteems (vectors) and at least one related assigned output esteems are required for every training example. This type of training is performed to reduce the whole classification error of the model via calculating the training output value through training.
On the other hand in unsupervised learning, there are no labels in the training set which differs this learning from previous. Success is normally dictated through if the network can lessen or increment a connected cost function. In any case, it is critical to take note that maximum image-intensive pattern recognition operations for the most part rely upon classification utilizing supervised learning.
3.5 Convolutional Neural Network
CNN is considered as one of the utmost ordinarily used forms of artificial neural networks [17]. Theoretically, a CNN is similar to a multilayer perceptron (MLP). An activation function is used in the MLP which maps the weighted input to the output. An MLP is working as a deep neural network when the network has more than one hidden layer.
Correspondingly, the CNN is reflected as MLP with a different architecture. This exceptional organization permits it to be translation and rotation invariant due to the model’s architecture [18]. The convolutional layer, pooling layer, and fully connected layer [19] are considered as the basic layers with a rectified linear activation (ReLU) function in CNN structures [20]. CNN's are encompassed of three forms of layers such as convolutional layers, pooling layers a well as fully-connected layers.
©Daffodil International University 14 Figure 7: Architecture of Convolutional Neural Network.
3.5.1 Convolutional Layer
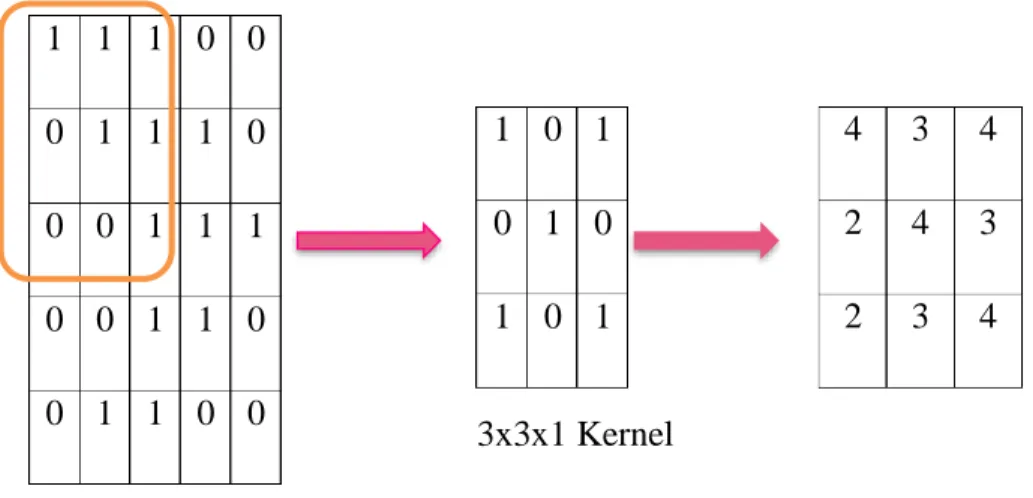
The convolutional layer plays an important role in CNN's operation As the name implies.
The layers' boundaries base on the usage of learnable kernels. Even though these kernels are typically minor however they range along with the whole depth of the input. The layer convolves each channel across the spatial dimensionality of the input to deliver a 2D enactment map exactly when data smashes a convolutional layer. As we float via the input, the calculation of scalar artifact for every value is performed in the kernel. When a specific feature on an assumed spatial position is seen, the network will absorb kernels that ’fire’
which are normally acknowledged as activations. Each kernel owns an equivalent activation plot that will be weighted alongside the complexity measurement to shape the complete output dimensions from the convolutional layer. Convolutional layers are equally able to essentially reduce the intricacy of the archetypal via the advancement of its output.
These are improved via three hyperparameters, the depth, the stride, and setting zero- padding.
The depth of the output size distributed through the convolutional layers can be materially set by the number of neurons privileged the layer to the equivalent area of the input.
We are additionally ready to characterize the stride in that we set the depth around the spatial dimensionality of the input to request on the way to put the open field. For instance, if we were to set a stride as 1, at that point we would take an intensely covered responsive
©Daffodil International University 15 field creating incredibly huge activations. Also, locating the stride towards a more prominent amount will lessen the degree of overlapping along with producing an output of lower spatial dimensions.
Zero-padding is considered as the simple process of padding the input border as well as an effective method for further controlling the dimensionality of the output dimensions. These methods help to modify the spatial dimensionality of the output of the convolutional layer.
The following equation is used for this calculation:
(𝑉 − 𝑅) + 2𝑍 𝑆 + 1
Here, V stands for e input size of the volume such as height×width×depth, R and Z stand for the accessible field size, and the volume of zero padding set separately. S denoting to the stride. If the premeditated outcome from this equation isn't equivalent to an entire number formerly the stride has been inaccurately fixed, since the neurons will be not able to fix perfectly through the prearranged input.
Figure 8: A 5x5x1 image convolved with a 3x3x1 kernel to become a 3x3x1 convolved feature.
3.5.2 Maxpool Layer
The main objective of the pooling layer is to progressively lessen the dimensionality of the demonstration along with additional reducing the number of parameters as well as computational intricacy of the archetypal.
4 3 4 2 4 3 2 3 4 1 1 1 0 0
0 1 1 1 0 0 0 1 1 1 0 0 1 1 0 0 1 1 0 0
1 0 1 0 1 0 1 0 1
3x3x1 Kernel
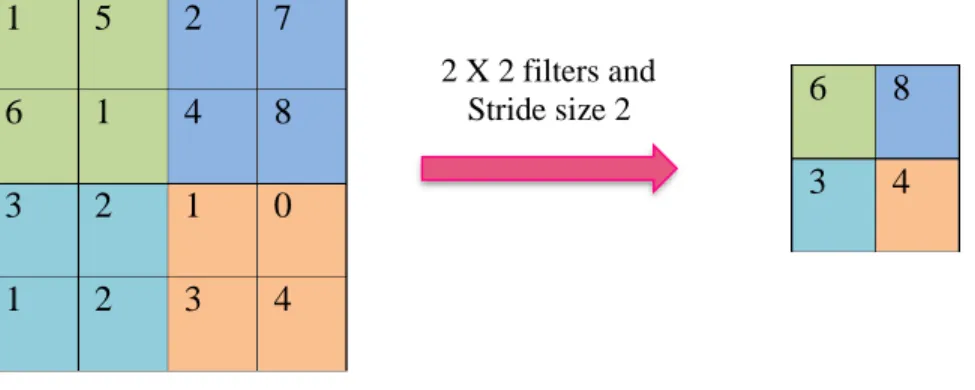
©Daffodil International University 16 The pooling layer activates over every activation plot in the input and measures its dimensionality consuming the “MAX” function. In maximum CNNs, these originate in the procedure of max-pooling layers along with kernels of dimensionality of 2 × 2 smeared with a stride of 2 laterally the spatial dimensions of the input. This measures the activation plot despondent to 25% of the unique size - at the same time as sustaining the depth size to its customary size.
Figure 9: Representation of Max Pooling Layer with Hyperparameters 2 X 2 filters and Stride size 2
Because of the destructive behavior of the pooling layer, around only two mostly noticed techniques for max-pooling. Typically, the stride and filters of the pooling layers are together fixed to 2 × 2, which will permit the layer to spread out over the total of the spatial dimensionality of the input. Besides overlapping pooling need to be utilized, wherever the stride is fixed to 2 through a kernel size fix to 3. Due to the destructive behavior of pooling, consuming a kernel over 3 will normally significantly decline the performance of the archetypal.
It is furthermore critical to understand that beyond max-pooling, CNN structures might comprise general-pooling. General pooling layers are included pooling neurons that can play out a large number of normal procedures containing L1/L2-normalisation, and average pooling.
6 8 3 4
1 5 2 7
6 1 4 8
3 2 1 0
1 2 3 4
2 X 2 filters and Stride size 2
©Daffodil International University 17
3.5.3 Fully Connected Layer
The fully-connected layer comprises neurons that are unswervingly associated with the neurons in the two neighboring layers, deprived of being associated with any layers inside them. This is undifferentiated from the way that neurons are orchestrated in conventional types of ANN.
3.6 Transfer Learning
Transfer learning is mainly a machine learning technique that uses the knowledge enlarged from an archetypal established to solve a problem and reused as a preliminary fact for solving a diverse problem. The present study is finely tuned using a pretentious CNN model based on transfer learning. The main purpose for using pre-trained CNN models is that they are faster and easier than training CNN models with randomly introduced weights. Also, the fine-tuning process is based on our classification task of transferring new layers instead of the last three layers of predefined networks.
3.6.1 VGG16
VGG16 is a Convolutional Neural Network (CNN) archetypal which is offered by K.
Simonyan and A. Zisserman from the Oxford Visual Geometry Group in the ILSVRC- 2014 competition. This model won the first prize by achieving 92.7% topmost 5 experiment accurateness on the ImageNet dataset that has approximately 138 million parameters. This architecture has 16 layers and the input is of fixed size 224 × 224 RGB image. It always has the convolution layer that uses 3×3 filters with stride 1 and the max-pooling uses 2×2 filters with stride 2 and finally, 3 fully connected layers are connected with the SoftMax activation function [11].
©Daffodil International University 18 3.6.2 Resnet50
Another Convolutional Neural Network model which is ResNet50 is suggested by He who accomplished the ILSVRC-2015 competition in 2015 to illuminate the issue of different non-linear layers not learning individuality maps and debasement issues. Every 2-layer block is supplanted in the 34-layer net with this 3-layer bottleneck block, bringing about a 50-layer ResNet and the input image is of fixed 224 × 224 pixels. This architecture has over 23 million parameters [12].
3.6.3 InceptionV3
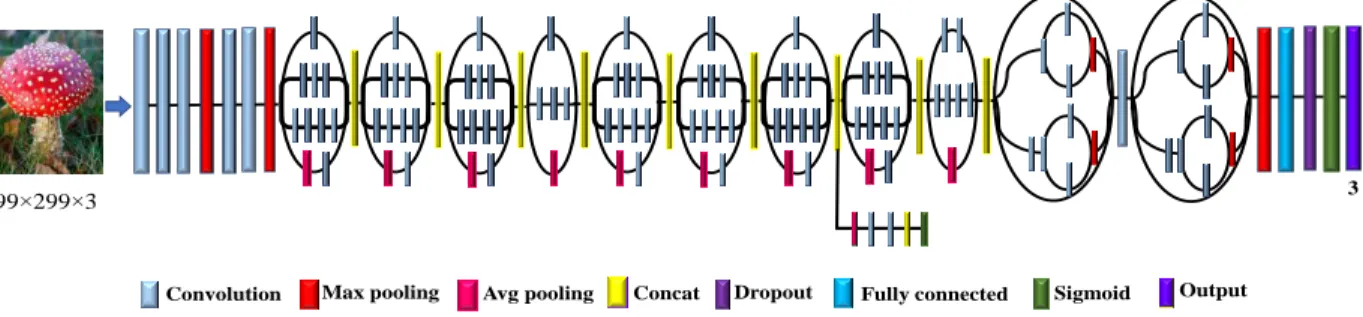
Inception V3 is another Convolutional Neural Network architecture that is presented by Szegedy and developed by Google (Figure 10). Inception V3 is the third announcement within the deep learning evolutionary structures arrangement. Batch normalization was executed in inception V2 after inception V1. At that point, the thought of factorization was familiarized in Inception V3. The leading reason for factorization is to diminish the number of associations as well as parameters deprived of decreasing the proficiency of the network.
It contains convolutions, average pooling, max pooling, concats, dropout, and fully connected layers. Finally, the SoftMax activation function is connected with FC and shows the output. The input image shape of this architecture is 299 × 299 pixels [13].
Figure 10: Schematic Representation of InceptionV3
3
Convolution Max pooling Avg pooling Concat Dropout Fully connected Sigmoid Output 299 299 3
©Daffodil International University 19
3.7 Training and Testing
Initially, the whole dataset was distributed among two parts such as training as well as testing dataset. This dataset splitting method was done randomly where the training set consists of about 7500 images, where 80% was used for training the model and the remaining 20% images were used for validating the model. And in the testing part, 690 new images were used to evaluate the performance of the model where each class contains 230 images. The same experiment was performed once with raw images and once with contrast-enhanced images.
All the models are trained with a transfer learning approach where categorical cross- entropy was utilized as the loss function shown in equation (1). The learning rate was set for 0.001,
𝐿𝐶𝐸= − ∑ 𝑡𝑖log(𝑝𝑖)
𝑛
𝑖=1
(1)
with Adam optimizer where SoftMax was used as the activation function for all the architectures shown in equation (2).
𝑓𝑖(𝑎) ⃗⃗⃗⃗⃗ = 𝑒𝑎𝑖
∑ 𝑒𝑘 𝑎𝑘
(2) The whole working process of the experiment is given in figure 1.
Entirely the experiments are executed on a 64-bit Windows operating system, Intel Core i5-7200U, CPU processor with 8 GB RAM, and 1 TB hard disk using the python programming language in an anaconda environment.
©Daffodil International University 20
CHAPTER 4
Experimental Results and Discussion
4.1 Results and Discussion
Several powerful CNN architectures through a transfer learning approach were evaluated in this experiment for the classification of mushrooms. Though the experiment was initially completed utilizing raw images but the outcomes were not acceptable at all. After that, the raw images were traded with contrast-enhanced images which prompt an incredible outcome.
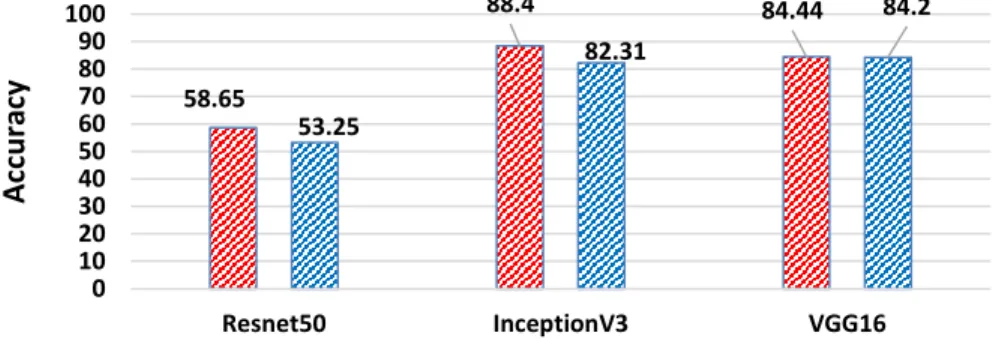
Vgg16, Resnet50, and InceptionV3 are some of the prevailing CNN architectures used in this experiment. Among all these CNN architectures, VGG16 came out with the best accuracy of 84.2% while using raw images where InceptionV3 and Resnet50 achieved 82.31 and 53.25 (Figure 11) respectively. In contrast, InceptionV3 outperforms any remaining structures with a different upgraded dataset using contrast enhancement technique with an accuracy of 88.40% followed by VGG16 with a precision.
Figure 11: Test Accuracy of different Transfer Learning Architecture 58.65
88.4 84.44
53.25
82.31
84.2
0 10 20 3040 50 6070 80 90 100
Resnet50 InceptionV3 VGG16
Accuracy
Architectures
With Contrast Without Contrast
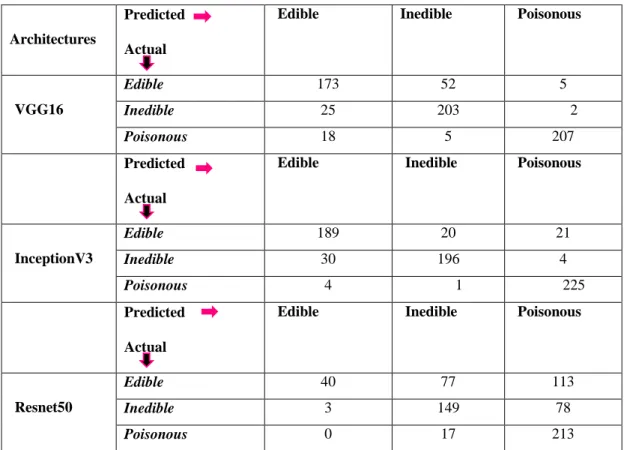
©Daffodil International University 21 For assessing the test viability of the multitude of models, a confusion matrix is utilized (Table I). The values of true positive, true negative, false positive, and false negative are found in the confusion matrix. The values lie in the diagonal position of the confusion matrix evaluates the exact prediction of the model. Accuracy, sensitivity, recall, precision, and the F1 score are calculated based on the confusion matrix utilizing the following equation (3- 6),
Accuracy = TP + TN TP + TN + FP + FN
(3)
Precision = TP TP + FP
(4)
Recall = TP TP + FN
(5)
F1 Score = 2 × precision × recall precision + recall
(6)
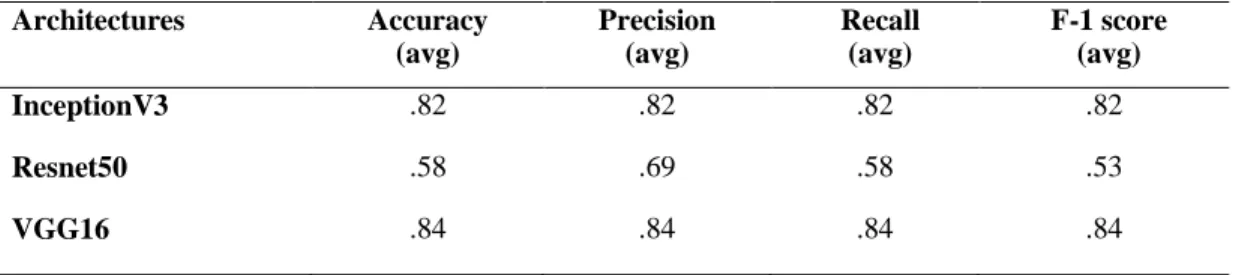
The raw images and contrast-enhanced images are presented in table II and table III respectively. Considering both raw and contrast-enhanced images, the values of all performance matrices such as accuracy, sensitivity, recall, precision, and the F1 score are calculated for entirely deep learning architectures. From table II, it is very much clear that VGG16 has achieved the best result rather than the rest two others CNN architectures utilizing raw images. Conversely, From table III it is found out that InceptionV3 achieved the best accuracy among the rest two other CNN architectures utilizing contrast-enhanced images.
©Daffodil International University 22
TABLE I. CONFUSION MATRIX OF CNNARCHITECTURES USING CONTRAST-ENHANCED IMAGE
Architectures
Predicted Actual
Edible Inedible Poisonous
VGG16
Edible 173 52 5
Inedible 25 203 2
Poisonous 18 5 207
Predicted Actual
Edible Inedible Poisonous
InceptionV3
Edible 189 20 21
Inedible 30 196 4
Poisonous 4 1 225
Predicted Actual
Edible Inedible Poisonous
Resnet50
Edible 40 77 113
Inedible 3 149 78
Poisonous 0 17 213
TABLE II. PERFORMANCE MATRICES OF CNNARCHITECTURES USING RAW IMAGE
Architectures Accuracy (avg)
Precision (avg)
Recall (avg)
F-1 score (avg)
InceptionV3 .82 .82 .82 .82
Resnet50 .58 .69 .58 .53
VGG16 .84 .84 .84 .84
©Daffodil International University 23
TABLE III. PERFORMANCE MATRICES OF CNNARCHITECTURES USING CONTRAST-ENHANCED IMAGE
Architectures Accuracy (avg)
Precision (avg)
Recall (avg)
F-1 score (avg)
InceptionV3 .88 .88 .88 .88
Resnet50 .58 .69 .58 .58
VGG16 .84 .85 .84 .85
Since the classification accuracy of a model depends on the performance of feature extraction so feature extraction is considered as an essential component of the CNN model.
Figure 12 and figure 13 illustrate the feature map of the raw image and feature map of the contrast-enhanced image respectively. Feature maps are apparent that contrast-enhanced images convey better performance over raw images.
Figure 12: Feature map of the raw image without contrast-enhanced technique
©Daffodil International University 24 Figure 13: Feature map of the contrast-enhanced image
4.2 Comparative Analysis
Quantify the significance of the research is very much important. For this purpose, a portion of its mechanisms is equated with supplementary research works which are appeared in table IV.
Several machine learning techniques like ANN, ANFIS, and Naive Bayes [14] were utilized for the classification of mushroom fungi. ANFIS performed much better by obtaining 80% accuracy in comparison with ANN and Naive Bayes which obtained around 70% accuracy. A gradual change in the pattern of mushroom behavior over a period termed
‘enzyme growing’ is defined via a machine learning technique such as SVM to detect if sample mushrooms are fresh for consumption or not. This study achieved overall 80%
accuracy [15]. For classifying 45 several types of poisonous as well as edible mushrooms [16], the CNN model was utilized and achieved an accuracy of 74% which is not satisfactory enough.
©Daffodil International University 25
TABLE IV. COMPARATIVE ANALYSIS
Problem Domain Images used Classifier Accuracy References classification 8124 ANN, ANFIS, Naïve
Bayes
80% [14]
classification 135 SVM 80% [15]
classification 8556 CNN 74% [16]
classification 8190 Inception V3 88.40% Proposed Model
©Daffodil International University 26
CHAPTER 5
Conclusion and Future Work
5.1 Conclusion
Different CNN architectures like InceptionV3, Resnet50, and VGG16 were utilized in this proposed approach for acquiring the best accuracy in identifying edible, inedible, and poisonous mushrooms since it is an extreme source of nutrients. Several attributes from different images were extracted to reduce the amount of redundant data from the data set.
After that, Contrast-enhanced (CLAHE) technique was used for improving the test accuracy. Finally, InceptionV3 performed best with an accuracy of 88.40% in comparison with both VGG16 and Resnet50. As we have strained to correctly classify edible, inedible, and poisonous mushrooms in this experiment, in the future our task will be to increase the volume of images in the dataset, and we will use more images for improving the obtained accuracy in this work.
5.2 Future Work
A more exact and vigorous model will be developed for upgrading the precision of the mushroom-identification framework. A smartphone application will similarly be created later on to identify mushrooms and to show the mushroom data to the ranchers. The application will make a significant contribution to convenient mushroom location and to shielding humans from harmful impacts.
©Daffodil International University 27
REFERENCES
[1] "How many edible/poisonous mushrooms are there?", Mushroomthejournal.com, 2020. [Online].
Available: http://www.mushroomthejournal.com/greatlakesdata/TopTen/Quest19.html. [Accessed: 10- Dec- 2020].
[2] "Supervised Learning - an overview | ScienceDirect Topics", Sciencedirect.com, 2020. [Online].
Available: https://www.sciencedirect.com/topics/computer-science/supervised-learning. [Accessed: 10- Dec- 2020].
[3] Fukuwatari T., Sugimoto E., Yokoyama K., and Shibata K., “Establishment of animal model for elucidating the mechanism of intoxication by the poisonous mushroom Clitocybe acromelalga,”
Shokuhin Eiseigaku Zasshi, vol. 42, no. 3, pp. 185–189, 2001.
[4] RAlkronz, Eyad Sameh, Khaled A. Moghayer, Mohamad Meimeh, Mohannad Gazzaz, Bassem S. Abu- Nasser, and Samy S. Abu-Naser. "Prediction of Whether Mushroom is Edible or Poisonous Using Back- propagation Neural Network." (2019).
[5] I. Al-Mejibli and D. Hamed Abd, “Mushroom Diagnosis Assistance System Based on Machine Learning by Using Mobile Devices” Intisar Shadeed AlMejibli University of Information Technology and Communications Dhafar Hamed Abd Al-Maaref University College, vol. 9, no. 2, pp. 103–113, 2017.
[6] D. Chowdhury and S. Ojha, “An Empirical Study on Mushroom Disease Diagnosis : A Data Mining Approach,” International Research Journal of Engineering and Technology(IRJET), vol. 4, no. 1, pp.
529–534, 2017.
[7] M. A. Ottom and Yarmouk University, Jordan, “Classification of mushroom fungi using machine learning techniques,” Int. j. adv. trends comput. sci. eng., vol. 8, no. 5, pp. 2378–2385, 2019.
[8] Maurya P., Singh N.P. Mushroom Classification Using Feature-Based Machine Learning Approach. In:
Chaudhuri B., Nakagawa M., Khanna P., Kumar S. (eds) Proceedings of 3rd International Conference on Computer Vision and Image Processing. Advances in Intelligent Systems and Computing, vol 1022.
Springer, Singapore. (2020).
[9] Y. Wang, J. Du, H. Zhang and X. Yang, "Mushroom Toxicity Recognition Based on Multigrained Cascade Forest", Scientific Programming, vol. 2020, pp. 1-13, 2020.
[10] Mushroom Dataset, [Online], Available, https://drive.google.com/drive/folders/1X29L94Zl- uLNjwhFO_dFQiKoDvpr8sBI?usp=sharing
[11] K. Simonyan and A. Zisserman, “Very deep convolutional networks for large-scale image recognition,”
arXiv [cs.CV], 2014.
[12] K. He, X. Zhang, S. Ren, and J. Sun, “Deep residual learning for image recognition,” in 2016 IEEE Conference on Computer Vision and Pattern Recognition (CVPR), 2016.
[13] C. Szegedy, V. Vanhoucke, S. Ioffe, J. Shlens, and Z. Wojna, “Rethinking the inception architecture for computer vision,” in 2016 IEEE Conference on Computer Vision and Pattern Recognition (CVPR), 2016.
[14] Verma, S. K., and Maitreyee Dutta. "Mushroom classification using ANN and ANFIS algorithm.", IOSR Journal of Engineering (IOSRJEN) 8.01: 94-100:2018
[15] Anil, Abhishek, Hardik Gupta, and Monika Arora. "Computer vision-based method for identification of freshness in mushrooms." 2019 International Conference on Issues and Challenges in Intelligent Computing Techniques (ICICT). Vol. 1. IEEE, 2019.
[16] J. Preechasuk, O. Chaowalit, F. Pensiri, and P. Visutsak, “Image analysis of mushroom types classification by convolution neural networks,” in Proceedings of the 2019 2nd Artificial Intelligence and Cloud Computing Conference, 2019.
[17] J. Schmidhuber, “Deep learning in neural networks: an overview,” Neural Netw., vol. 61, pp. 85–117, 2015.
[18] B. Zhao et al., “Convolutional neural networks for time series classification,” J. Syst. Eng. Electron., vol. 28, no. 1, pp. 162–169, 2017.
[19] J. Gu et al., “Recent advances in convolutional neural networks,” arXiv [cs.CV], 2015.
[20] L. Yann, B. Yoshua, and G. Hinton, “Deep learning,” Nature, vol. 521, pp. 436–444, 2015.
©Daffodil International University 28
Mushroom species classification
©Daffodil International University 29
©Daffodil International University 30
©Daffodil International University 31
©Daffodil International University 32
©Daffodil International University 33
©Daffodil International University 34
©Daffodil International University 35
©Daffodil International University 36
©Daffodil International University 37
©Daffodil International University 38