©Daffodil International University RICE PLANT NITROGEN DEFICIENCY DETECTION BY LEAF COLOR
CHART (LCC)
BY
SABRINA MEHENAJ MITU ID: 152-15-5582
AND
NAHIDA AKTER ID: 152-15-5719
AND
MD.SHAHED MAHMUD ID: 152-15-5949
This Report Presented in Partial Fulfillment of the Requirements for the Degree of Bachelor of Science in Computer Science and Engineering
Supervised By
Md. Sazzadur Ahamed
Senior Lecturer Department of CSE
Daffodil International University
Co-Supervised By
Md. Zahid Hasan
Assistant Professor Department Of CSEDaffodil International University
DAFFODIL INTERNATIONAL UNIVERSITY DHAKA, BANGLADESH
MAY 2019
©Daffodil International University i
©Daffodil International University ii
©Daffodil International University iii
ACKNOWLEDGEMENT
First, We express our heartiest thanks and gratefulness to almighty Allah for His divine blessing makes us possible to complete the final year project successfully.
We are really grateful to Md. Sazzadur Ahamed, Senior Lecturer, Department of CSE Daffodil International University, Dhaka. Deep Knowledge & keen interest of our supervisor in the field of “Image Processing” to carry out this project. His endless patience, scholarly guidance, continual encouragement, constant and energetic supervision, constructive crit icism, valuable advice, reading many inferior drafts and correcting them at all stage have made it possible to complete this project.
We would like to express my heartiest gratitude to Dr. Syed Akhter Hossain, Dr. Sheak Rashed Haider Noori, Md. Zahid Hasan, Dr. Mohammad Shorif Uddin, department of CSE, for kind help to finish our project and also to other faculty members as well as the staff of CSE Department of Daffodil International University.
We would like to thank our entire course mate in Daffodil International University, who took part in this discuss while completing the course work.
Finally, we must acknowledge with due respect the constant support and patients of our parents.
©Daffodil International University iv
ABSTRACT
All plants need sufficient supplies of macronutrients for healthy growth, and nitrogen (N) is a nutrient which is commonly in limited supply. Nitrogen is very much important nutrient for rice.
To achieve high yields need to apply nitrogen (N) fertilizer. But excessive fertilizer will cost money and can be end up being nitrate in ground water. Nitrogen deficiency is one of the most common problems in rice in Bangladesh. It is common in all rice growing soils where neoteric varieties are grown without sufficient mineral N fertilizer. So, by using the concept of Leaf Color Chart we implemented an android application which will be helpful for farmers to detect nitrogen deficiency. We have used image processing based techniques to implement our work. In this app, we have collected images which are our Leaf Color Chart & put RGB values from those images in our database. When user or farmer will take an image then this new RGB values from this images will compare with our database values & it will show the result. Our application will suggest some useful website link based on this result which will be helpful for users. We appeared our technique here. We hope that farmers will take up this tool positively and obviously they will be benefited by using it.
©Daffodil International University v
TABLE OF CONTENTS
CONTENTS PAGE
Board of examiners i
Declaration ii
Acknowledgements iii
Abstract iv
Contents v-vi
List of Figures vii
List of Tables viii
CHAPTER
CHAPTER 1: INTRODUCTION
1-21.1 Introduction 1
1.2 Motivation 1
1.3 Objective 2
1.4 Expected Output 2
CHAPTER 2: LITERATURE REVIEW
3-52.1 Research Paper by Previous Scientist 3-4
2.2 Gap in Previous Works 4-5
CHAPTER 3: METHODOLOGY
6-163.1 Introduction 6-7
3.2 Research Subject and Instrumentation 7-12
3.3 Data collection Procedure 3.4 Implementation Requirements
12-16 16
©Daffodil International University vi
CHAPTER 4: EXPERIMENTAL RESULTS AND DISCUSSION
17-21
4.1 Experimental Setup 17-18
4.2 Experimental Results 19-21
4.3 Discussion 21
CHAPTER 5: CONCLUSION
225.1 Summary of the Study 22
5.2 Conclusion 22
REFERENCES
©Daffodil International University vii
LIST OF FIGURES
FIGURES PAGE NO
Figure 3.2.1: Mobile application development 9
Figure 3.2.2: Proposed mobile device-based rice leaf 10 Analyzer structure for nitrogen estimation
Figure 3.2.3: System Model 11
Figure 3.2.4: Algorithm for capturing image 12
Figure 3.3.1: Procedure for color classification method using KNN 16
Figure 4.1.1: User interface 17-18
(a) some rules & option for LCC detection 17
(b) image capture for n detection 17
(c) LCC value calculation for image 18
(d) list of calculated image 18
(e) final output after all operation 18
©Daffodil International University viii
LIST OF TABLES
TABLES PAGE NO
Table 4.2.1: Performance of the Application for N Deficiency Detection 29-30 Table 4.2.2: Accuracy of the System 31
©Daffodil International University 1
CHAPTER 1
INTRODUCTION
1.1 Introduction
In the digital world, the mobile apps has surfaced and acquired great importance. The Mobile Apps are introduced to support people to do all kind of activities in every sector. For the advancement of the agriculture sector, mobile apps are introduced to help the farming community. Now a day’s almost all People are using android phone even who are live in rural area. So, we have focused on an application developed for farmers which detect Rice plant nitrogen deficiency .Nitrogen deficiency detection of plant is a very big problem for farmers. We know farmers detect nitrogen deficiency by leaf color chart (LCC).But most of the time they cannot detect nitrogen deficiency properly because some people are color blind otherwise sometimes it is confused people which leaf color exactly match with LCC. That’s why we developed an android application which is detect nitrogen deficiency by capturing plant image and show the result without any kind of suffering of people. It actually helps those people who are color blind. Our application also will produce some suggestion and helpful website link to users about their problems after detection.
1.2 Motivation
Nitrogen insufficiency is a standout amongst the most widely recognized issues in rice on the planet. It happens at basic development phases of the plant when the interest for nitrogen is substantial. Nitrogen insufficiency may likewise happen when a lot of N compost has been connected yet the time or way isn't right. Farmers being confused most of the time about the detection of nitrogen deficiency and when they should apply N fertilizer. Though they can use LCC but sometimes they are faced problem who have weakness about color. For this reason we decided to develop this android application.
We think this app will help people. Thinking about something new will be a motivation to us to do this work.
©Daffodil International University 2
1.3
ObjectiveWe wanted to develop an application that will eliminate the disadvantages of LCC and determine the level of Nitrogen deficiency of plant through image processing. We incorporated a database system on the Android application to provide a continuous Monitoring of the crop’s N status. Appling fertilizer at Right Quantity at Right Time when crops needs. Our other target to enable society to meet up with the technology and minimizing time & cost of people.
1.4 Expected Output
Our project not only detect nitrogen deficiency but also try to giving beneficial suggestion to farmers which is really helpful to them. We set as more as possible easy functionality in our app so that people are easily understand it and can use it properly even though they are not used to that kind of activities. When all professional sector people digital then why farmers not? We think it will be their big opportunity to be much smarter and digital. By using this app people can improve their knowledge about N management and balanced fertilization and will also increasing the productivity of crops and reduction of used nitrogen fertilizer. For this farmers can reduce excessive spending and increase their profitability. People can produce high crops yields.
©Daffodil International University 3
CHAPTER 2
LITERATURE REVIEW
2.1 Research Paper by Previous Scientist
Nitrogen deficiency detection system using Image processing techniques is a type of techniques where we can predict image using lots of algorithms. Every year farmer faces various type of plant diseases and Nitrogen deficiency is one of them. There has a huge number of data is produced in the Rice Research Institute. And the data prediction is totally depending on the algorithms and different types of researcher applying different types of algorithms. For Nitrogen deficiency detection we need accurate result because every single value differ a different result. For this reason, we choose this topic to find out the best algorithms which will generate the perfectly accurate result from the previous research. Nitrogen is the most important nutrient for rice. To achieve high yields need to apply fertilizer N. But extra fertilizer will cost money and can be end up being nitrate in ground water. LCC is an inexpensive alternative of SPAD to determine Nitrogen in soil.
But SPAD beyond the reach of ordinary rice farmer. So LCC only alternative for farmer.
This paper shows some experiment data like yield, N uptake Vs. LCC chart value and proved that LCC can minimize cost and also increase high yield. We have read many research paper and we are reviewing a little.
Gupta, R. K, et.al, [1] focused on plant need based fertilizer N management. Fertilizer N is applied whenever SPAD value is less than the preset critical reading. The SPAD threshold value which represents the limit below which a reduction in yield occurs must be pre-defined. Fertilizer N applications are necessary below this threshold value to avoid yield loss. This paper shows some experiment data like yield, N uptake Vs. LCC chart value and proved that LCC can minimize cost and also increase high yield.
PASUQUIN, J .M.C.A, et.al, [2] told in their paper the major progress has been made in recent years in the on-farm evaluation of LCC for effective N management and they provided in greater detail about the general guidelines on its use. Briefly, a critical leaf color has to be maintained for optimal growth and the LCC provides guidance when to
©Daffodil International University 4 apply fertilizer N to avoid N deficiency. The critical leaf color depends on varietal group and crop establishment method.
VIGYAN, J. K, et.al, [3] study was conducted for assessing nitrogen scheduling in rice through soil test based and leaf color chart (LCC) based nitrogen top dressing. In general, 9.5 to 13 per cent yield increase over the farmers’ practice was obtained through LCC based nitrogen application coupled with soil test based P and K application over the couple of years of experiment. Rice yield in soil test based fertilizer application was found to be at par with that of LCC based application. However, LCC based nitrogen application saves farmers from unnecessary use of nitrogenous fertilizers.
ADIKARY, P, [4] was introducing N management approach which was estimating the leaf N concentration by the measurement of leaf greenness. Among the different tools available to measure the leaf greenness, the non-destructive measurement of leaf green color intensity using leaf green color charts are gaining importance. A potential solution has been tried to regulate the timing of nitrogen application in rice using a leaf color chart to determine the plant nitrogen.
Chen, L, et.al, [5] focused on non-destructive nutrition diagnosis which provides effective technological support for agricultural sustainability. According to the plant nutrition mechanism, leaf characteristics displays different changing trends under nitrogen (N), phosphorus (P), and potassium (K) nutrition stress. In this study, the dynamic capture of rice leaf by scanning was used to research the changing regulation of leaf characteristics under nutrition stress. The leaf characteristics were extracted by mean value and region props functions in MATLAB, and the leaf dynamics were quantified by calculating the relative growth rate.
.2.2 Gap in Previous Works
By using (LCC) leaf color chart concept can easily detect rice plant nitrogen deficiency.
Many researchers had done research paper on this topic. But there were some gap in their research paper. We can work with those fields which have been left undiscovered by researchers. We found some gap in literature review on our topic. Most of the paper on
©Daffodil International University 5 our topic that we had read which just talk about LCC tool. But didn’t find any android application on it. It will be more important field to work.
Nutrition content is more important for plant. Identifying the nutrition deficiency when plants exposed to multiple stress.
By exploring the relationship between the dynamic characteristics, can establish the diagnostic model.
Exploration on the dynamic nature of fully expanded leaves. That help to identifying sensitive characteristics to improve our diagnostic effect.
Measure of sunlight based radiation got in a locale impacts limit SPAD/LCC values. To determine this issue more information should be gathered.
For soil properties, N providing limits in no-N plots at areas where LCC or SPAD meter based N the board is being assessed need to gather more information.
©Daffodil International University 6
CHAPTER 3
METHODOLOGY
3.1 Introduction
An android application based system for nitrogen deficiency detection using image processing to make the process simple, easier and faster. From LCC a farmer can discover the reason and they can easily take any correct decisions before make any big mistakes. The Leaf color chart (LCC) was the first time introduced in the agricultural sector of the world by the scientists of Japan. They made it for estimation of chlorophyll formation and its availability in plants, after the continuous studies, many researchers proved that it is pivotal for the measurement of nitrogen deficiency detection and its correction. It is very easier to use. The leaf color chart has four(04) to six(06) colors varies from yellowish to dark greenish just like lush green colors of plants, each color is changed from the one another. An IRRI scientist prepared LCC in which have only 4 colors and this LCC is very much useful that provides accurate results in determination of N deficiency in plant same as like a meter used for chlorophyll measurement which displays the exact values (IRRI, 2003). So that using the leaf color chart based application has many advantages, among them it is non-cost full and very easy to use.
Also the use of LCC based application is simple and quick as well. It saves N and thus farmer’s money for supply of N suited and fitted with the requirement of the rice plant.
So this LCC based application is for the support of farmers.
Reason for utilizing LCC based application: Reason for utilizing LCC based application is to apply sufficient measure of nitrogen and maintain a strategic distance from utilization of compost more than required. Utilization of LCC decides nitrogen request of the yield and guide ideal time of manure nitrogen application in order to avert undesirable nitrogen misfortunes and their genuine effects on the biological system.
Ranchers for the most part apply an excessive amount of N (and little P and K and different supplements) that outcomes in high nuisance and sickness occurrence and genuine cabin. The result of high N application is high pesticide use to control bothers, more consumption on pesticides and diminished yield and poor grain quality because of
©Daffodil International University 7 cabin. Also nitrates trickle down the earth with use of excessive urea. If it reaches 10 milligram or more in per liter water, then water becomes unfit for human consumption.
Leaf Shading Diagram (LCC) is utilized in farming displaying for checking the plant execution by contrasting the leaf shading and its relating shading in LCC. To digitize the securing and understanding of leaf shading, cell phone camera is utilized. A shading adjustment is fundamental for a cell phone before it tends to be utilized to catch and decipher leaf shading. The calibration process evaluates the camera performance with the operational lighting conditions and determine whether the smart phone camera can be used for leaf color interpretation or not. The result from camera color calibration is used as a relative color chart for interpreting leaf color. In this paper, we propose a method of relative color calibration, which makes the system, learns colors chart automatically without depending on specific standard colors. K Nearest-Neighbor (KNN) classification is used for color learning process in RGB color space. Our method is successfully tested with two smart phone devices in different lighting condition. The test shows an average accuracy above the threshold value of 80%.
3.2 Research Subject and Instrumentation (LCC based Mobile Application Life Cycle of Rice)
Leaf Color Chart (LCC) is a standard chart to count leaf color level. It is developed by the IRRI (International Rice Research Institute) for monitoring the crop growth. In a precision agriculture approach, leaf color is observed regularly to determine the healthiness of the crop including its leaf chlorophyll content. To perform this observation, a farmer visually compares the color of a crop leaf with a set of color in the LCC and note the color level according to its corresponding color in the LCC based on the color similarity. This process requires a very good color perception of surveyor’s eye, and it should be performed consistently throughout the crop growth. A portable chlorophyll meter has been developed to help farmers precisely determine the chlorophyll content of a leaf. Even though this instrument has been used in agricultural research Centre, it is not popular among farmers. As an alternative solution, smart phones are considered as promising devices for capturing and analyzing leaf color. Smartphone’s have good computing capabilities, they can be programmed, they are equipped with a digital
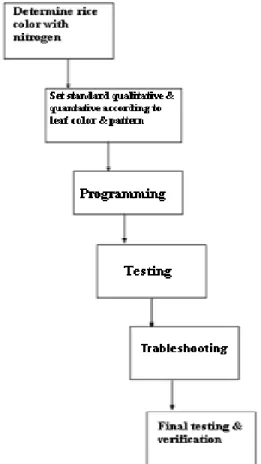
©Daffodil International University 8 camera, and now-a-days they are used by many farmers. Figure 3.2.1 demonstrates the procedure for the versatile application advancement. The improvement organize begins with the distinguishing and deciding the distinctive impacts of supplement lacks of rice leaves, especially on Nitrogen. We attempted to use the Leaf Shading Diagram (LCC) as a guide for choosing the component of nitrogen deficiency for the yields. Second, is the programming stage, utilizing the distinctive instruments for building up a portable Android Application and a genuine smart phone for recreation & simulation. The primer testing and investigating are the means expected to wipe out the mistaken procedure that is experienced by the application. These incorrect procedures are database and picture preparing blunders which lead to the off base outcomes. In the conclusion, testing and affirmation is the last and last period of the headway of the versatile application. In this movement, authentic testing of the yield leaf is done by the Branch of Farming District 10 – Harvests Division. This authentic testing is to check the comfort and helpfulness of the portable application.
Figure 3.2.1: Mobile application development.
©Daffodil International University 9 Proposed rice crop leaf analyzer structure
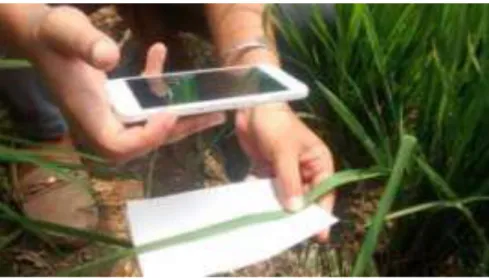
The proposed mobile phone-based crop leaf color analyzer architecture is shown in Fig 3.2.2. It consists of only a mobile device. The cell phone can be a PDA and a gadget furnished with a back camera, for example, a tablet. Sunlight shining over the crop field is automatically used as the illumination light. It illuminates the leaf. The mobile device having the proposed application is set is such a manner that the crop leaf is in the field of view of mobile device camera.
Figure 3.2.2: Rice leaf analyzer structure for nitrogen estimation
In this way, the crop leaf is captured under the normal environmental condition. From fig 3.2.2, since the caught picture is in red, blue and green or RGB design, investigate the shading view (CV) of the picture. Likewise, as the leaf amid examination is in one shading tone from light green to the dull green. For this, there is a technique in android studio programming device in which application is produced for getting the main green pixels of the entire picture and handling is happening just on those pixels. CV in this work is defined as
CV= (GS*100)/255….……. eq. (1)
Here, GS is the normal shading estimation of all the green pixels present in the caught picture. The determined CV esteem will be related with the shading dimension of the harvest leaf from a standard LCC. Subsequently, N status and measure of N compost can be effectively evaluated by our cell phone based yield leaf shading analyzer application.
©Daffodil International University 10 Since Gs is constantly littler than 255 then CV is fluctuated between 0 to100. Along these lines, darker green hues related with higher N in the leaf prompts lower CV esteems.
System Model
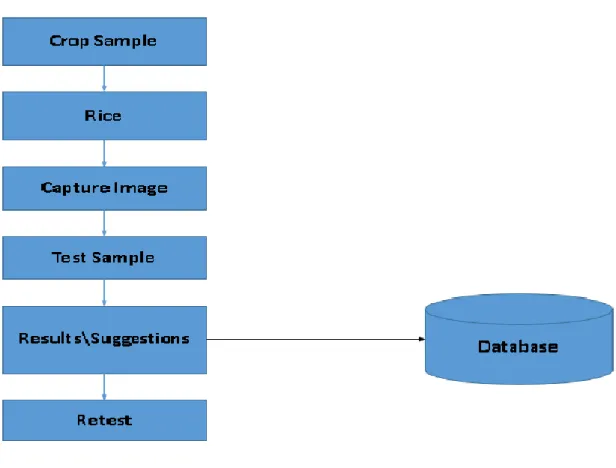
Figure 3.2.3 shows the strategy of the structure/framework model of the flexible android application. The graph contains crop leaf tests which speak to the rice crops. The customer should top off the information or data that requires in this application in order to sanction the farm. The information is saved to the database for future reference for the result of following. Amid the test, the camera of the made flexible android application is set to self-alter. It gets on different occasions of each leaf test and test.
Fig 3.2.3: System Model.
After the procedure is done, the nitrogen lack status of the yield's leaf through leaf shading and example acknowledgment is resolved. For the rice crop, the premise of the leaf shading and example acknowledgment is the LCC. LCC level and recommended
©Daffodil International University 11 compost is appeared in the outcome page. On the off chance that the client isn't happy with the outcome, he/she can re-try the retest.
Algorithm for Capturing Image
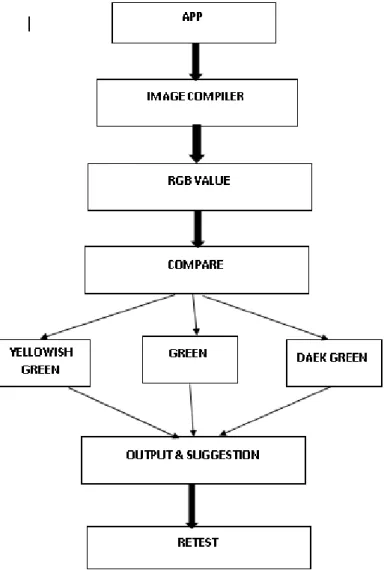
Figure 3.2.4 shows the algorithm for capturing the rice leaf image. The picture procedure requires the education of rice leaf picture from the background. The method begins with putting away the pixels in a cluster/array, second, gather the nonwhite,non-dim and non- dark. Third, make the new picture using the assembled pixels and with the components of the first picture. At last, extra to the inward capacity.
Figure 3.2.4: Algorithm for capturing image.
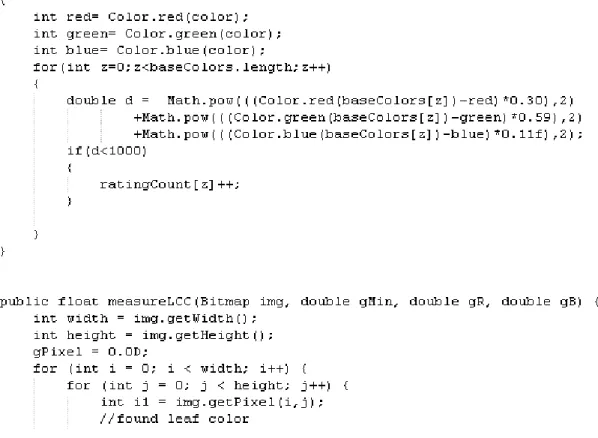
©Daffodil International University 12 Source code for getting the average color of rice leaf image
Figure 3.2.5: Source code for getting the average color of rice leaf image. Advances of LCC Based Application System
1. It is simple and easy to use tool for farmers to assess the leaf nitrogen status.
2. LCC is inexpensive and no samples need to be collected, processed and sent to Laboratory.
3. LCC do not demand expertise in usage as it is only matching the color scores of the leaf.
3.3 Data Collection Procedure
In this research paper we are working with the problem which is rice plant disease. Every year huge number of N is used by farmers for various reasons without knowing the specific knowledge of using N. There has a huge number of data is produced in the website by the researchers. For this reason, data processing is the main part for data mining and it is also time-consuming also.
©Daffodil International University 13 The decision tree approach is one of the most powerful techniques in classification. It can predict the data and builds the model into a tree structure. Decision trees also can handle both numerical data and categorical data. There are various decision tree algorithms that are used. Because it gives us the best and accurate result and the tree structure is very simple to understand and effective. From the classifier we are using the image processing through the RGB value of the correctly classified accuracy associated with the situation of N management. LCC based N application produced slightly higher but insignificant grain yield than conventional farmer’s N application practice. N use efficiency and deficiency was much higher in LCC based N application. 19-37 kg Nha−1 was saved in LCC and insect infestation in rice. It plays the positive role on environment by reducing the use of agrochemicals. The agronomic efficiency (AEN), apparent recovery efficiency (REN) and partial factor productivity (PFPN) from applied N fertilizer were calculated as follows: AEN = kg grain increase kg-1 N applied = (YN - Y0/FN) where YN is the rice grain yield (kg ha-1) at a certain level of applied fertilizer N (FN, kg ha-1), and Y0 is the rice grain yield (kg ha-1) measured in a control plot with no N application. REN = kg N taken up kg-1 N applied = (UN - U0/FN) where UN is the complete N in over-the-ground plant biomass at physiological development (kg ha-1) in a plot accepting N without N expansion. PFPN = kg rice grain yield kg-1 N connected = YN/FN. The investigation of difference (ANOVA) was performed on yield and N productivity parameter to decide the impacts of genotypes, compost N the executives medicines, and their collaborations utilizing SAS programming variant 8. Duncan's numerous range test (DMRT) at the 0.05 dimension of likelihood was utilized to assess the distinction among treatment implies.
Statistical Analysis
Analysis of variance was performed on LCC score value, and leaf N concentration to determine the effects of cultivars, N fertilizer rates, and their interaction using System (1992). The datasets for this exploration spread three sorts of information: standard LCC benchmark, the of LCC's photograph imprinting in a perfect lighting condition, the captured image in a non-perfect lighting condition. The underlying standard LCC benchmark is taken from the IRRI's site. It contains five dimensions of green shading, and this five-dimension of green shading is utilized as our shading referenced information. This standard LCC is at that point imprinted on a reflexive photograph paper
©Daffodil International University 14 in 4R estimate with white foundation. The second information is a caught picture of the printed LCC.
In a perfect lighting condition, human eyes can translate and recognize each shading in this printed LCC. With a decent camera and a decent lighting condition, this printed LCC can be recreated carefully, and it should introduce unmistakable shading for each dimension of LCC. To catch this LCC, two sorts of cell phones are utilized, which are Samsung Galaxy J7 and HUWEI Y9. Rather than utilizing a brand-explicit camera application, a freeware application CameraFV-5 Lite is utilized. Pictures are taken arbitrarily in the extraordinary lighting condition in the first part of the day, around early afternoon, and toward the evening.
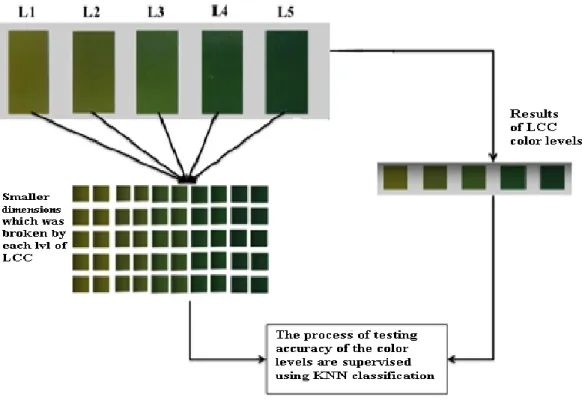
Taking each shading dimension of the captured image into its comparing shading in LCC is the principle part of the philosophy. Each shading is spoken to by its R, G, and B shading component esteems. Information preparing of a regulated characterization was set up by registering mean and modus values in each shading component. Information testing was gotten from each dimension shade of LCC, which was splatted into littler 10x10 measurements. This part offers data to the tried hues so as to group them into foreordained preparing information. Utilizing a KNN calculation performs regulated characterization. As the system of KNN calculation in this shading order is:
1. For each preparation precedent, add guide to the rundown of 5 shading dimensions.
2. Plan dataset to be characterized. Each dataset is splatted into a littler 10x10 measurement.
3. For each littler tried dataset, a solitary RGB esteem is resolved utilizing factual mean or modus examination
4. Indicate k, and rundown of 5 shading dimensions will be grouped dependent on closest closeness to information test.
Considering the popular usage of smart phones among farmers, this technology will be used to capture, analyses and determine crop leaf color with our proposed methodology.
The methodology includes color acquisition, color modeling, color classification, and color interpretation. Several researches used color classification techniques for determining a color of an image. The best result is shown in a random forest
©Daffodil International University 15 classification with cylindrical color spaces. This result concerns about the influence of lightness and it is a complex algorithm to be implemented in a regular smart phone. We used KNN classification to improve the performance of predicting paddy crop fertilization with LCC. The technique was performed with a smart phone by capturing images with a white paper background and skin color. We used features extraction of RGB, including minimum, maximum, and average of R, G, and B, respectively. We used a method for calibrating LCC color levels in an Android smart phone camera by using KNN. KNN is a lightweight classification algorithm, reasonable to be actualized in a regular smart phone device. The proposed method utilizes a relative color shading alignment to perceive an assortment of green colors in each dimension or level of LCC. A learning process is used to tell the smart phone camera how it should recognize the LCC.
Figure 3.3.1: Procedure for color classification method using KNN.
The accuracy was calculated by comparing the correct result of classification with the number of data in the collection. This accuracy value can be interpreted as a capability of the imaging sensor (i.e. a smart phone camera) to capture and distinguish a set of color.
For a general use, the imaging sensor is expected to recognize at least (n-1) colors from a
©Daffodil International University 16 chart with n colors. For a LCC chart with five color as used in this experiment, an accuracy of 4/5 (80%) is expected and it is set as our measurement threshold. The purpose of the method was for testing the imaging system from a tested smart phone, whether it can recognize and distinguish LCC color. This experiment is conducted in a Android Studio environment.
3.4 Implementation Requirements
For the implementation first, we need the Android studio tools. For this project, it is a very useful tool and we can also implement code in java. This software is useful for image processing research studies. Android studio includes the features like explorer, knowledge flow, experimenter, simple UI design etc. The smart phone based application project is created under JAVA language using Android Studio 3.0 version. The application program has small MB of size and is perfect with Android 4.4 and up to 8.0.
The application system is intended to control the portable camera to catch a picture of crop leaf. When picture is clicked that inalienably contains picture locales related the crop leaf, the CV esteem from Eq. (1) and its relating leaf shading level are resolved.
With the decided leaf shading level, the measure of N manure can be proposed in view of crop specialists or database put away in application program. This application project is planned and created in view of easy to use. The farmer simply clicks the picture of the leaf. Then crop the leaf area from that clicked picture. From that point forward, he needs to select those capture picture/images in the application. Now, by clicking on "Check nitrogen deficiency" button, average RGB of pixels of captured image is compared with the average RGB of pixels of the database samples.
©Daffodil International University 17
CHAPTER 4
EXPERIMENTAL RESULTS AND DISCUSSION
4.1 Experimental Setup
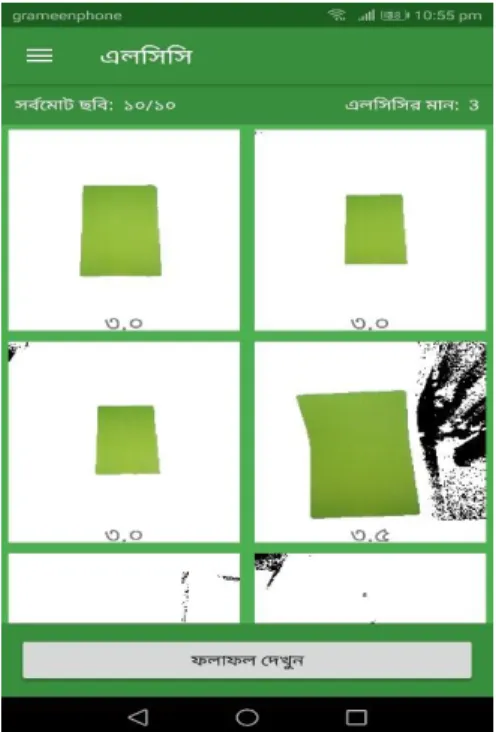
We have designed our system in two phases. First it will capture picture and then it detect nitrogen deficiency with some suggestion. Our application will take only leaf image without background when capturing leaf image and calculate nitrogen deficiency based on the leaf middle portion color. In home page we had given some rules about nitrogen deficiency detection in Bengali language so that users can easily understand. When we design user interface at that time we had kept in mind the lack of literacy level among farmers. We have focused on a simple user interface so that the users can select their options in minimal number of steps without any kinds of suffering. The nitrogen fertilizer detection is based on leaf color as shown in the figure 4.1.1.
(a) Some rules & Option for LCC Detection (b) Image Capture for N Detection
©Daffodil International University 18
(c) LCC Value Calculation for Image (d) List of Calculated Image
(e) Final Output after all Operation.
Figure 4.1.1: User Interface.
©Daffodil International University 19 4.2 Experimental Results
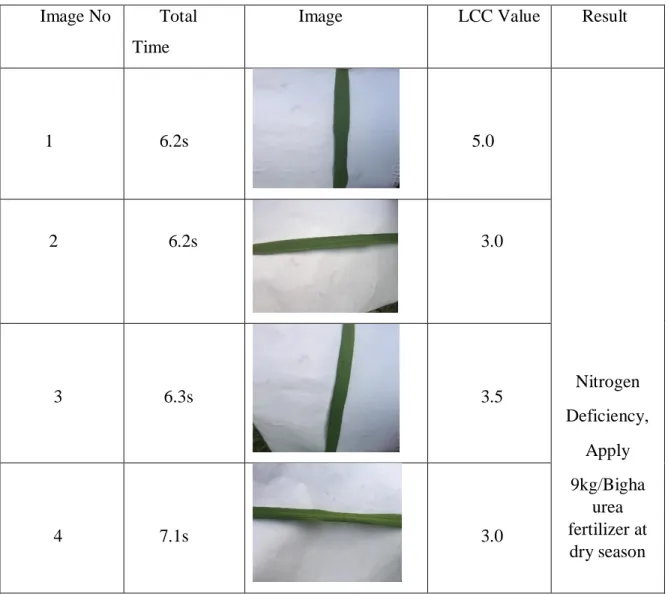
We have evaluated our system based on the system performance, detection rate and then in the light of user experience. We have taken ten leaf image for experiment and after capturing those image we have evaluate the result by this system. We have also evaluated the accuracy of our application. The final result after evaluation as shown in the table 4.2.1 and table 4.2.2.
Table 4.2.1: Performance of the Application for N Deficiency Detection.
Image No Total Time
Image LCC Value Result
1
6.2s
5.0
Nitrogen Deficiency,
Apply 9kg/Bigha
urea fertilizer at dry season
2
6.2s 3.0
3
6.3s
3.5
4
7.1s
3.0
©Daffodil International University 20
5
6.4s
3.5
and 7.5kg/Bigha
fertilizer at wet season
6 8.0s
3.5
7
7.4s
3.0
8
7.1s
3.0
9
6.7s
3.0
10
7.2s
3.0
©Daffodil International University 21 Table 4.2.2: Accuracy of the System.
Sample Leaf Time Environment Accuracy
10 9-11 am Outside 90%
10 9-11 am Inside 80%
10 2-4 pm Outside 90%
10 2-4 pm Inside 80%
4.3 Discussion
From that experimental table we can see some deference between outside and inside experiment. For outside experiment the accuracy of our system was 90% and for inside it was 80%. But we think our system overall accuracy is so good. At the end of the experiment we can decide that our application performing very well and hopefully this app will help student and researchers who wants to work more on this topic in future.
©Daffodil International University 22
CHAPTER 5
SUMMARY, CONCLUSION, RECOMMENDATION AND IMPLICATION FOR FUTURE RESEARCH
5.1 Summary of the Study
This report presents a novel method to assess the color levels in LCC using smart phone cameras. In this method, a classification with KNN algorithm is used to assess the captured image and relatively calibrate its color. This relative color calibration enables a wide-variety of imaging sensor to be used without the need of correcting the color value into its absolute color as usually done in an absolute color calibration. The test shows good results even in many non-deal lighting conditions. Moreover, it works well in a RGB color space without a color transformation as usually proposed. This makes a further implementation more feasible. The calibration result from this assessment method can be used to score imaging device to determine whether the device can be used for this purpose with the current lighting condition. This research uses LCC as a color test.
Further research will assess a real sugarcane leaf color and match its color levels with its corresponding LCC. This step opens a possibility to determine the chlorophyll or nitrogen level in a leaf using smart phone camera.
5.2 Conclusion
Here propose and appear for how smart phones, for example, a mobile phone can be worked as a shading analyzer for estimating the shade of rice crop leaf. Specifically, here exhibits a cell phone based crop leaf shading analyzer for nitrogen estimation in the crop field. The key thought depends on course of action of crop leaf in such a manner that it is in the field of perspective of the cell phone's camera. For diagnosing rice crop leaf the tested leaf must be in a controlled light module, tedious, dangerous since the leaf tests are extricated and may take seven days for the outcomes and not reasonable for deciding nitrogen in little territory. With this, it can ascertain the precise supplement lack of rice.
©Daffodil International University 23
REFERENCES
[1] Singh,V, Singh , B , Singh, Y ,H. S. Third ,R. K. Gupta , “Need based nitrogen management using the chlorophyll meter and leaf color chart in rice and wheat in South Asia: a review”, recommendations and user guidelines. Page No 364, 6 April 2010.
[2] PASUQUIN, J.M.C.A, Mutters, R, and BURESH, R.J, “New Leaf Color Chart for Effective Nitrogen Management in Rice”, Kluwer Academic Publishers. Page no 38, 31 May 2014.
[3] VIGYAN, J. k , “Nitrogen Management by Using Leaf Color Chart in Sharif Rice in Alluvial Soils of West Bengal” , Indian Journal Of Fertilizers. Page No 1, February 2015.
[4] ADHIKARY, P, “Leaf color chart (LCC), a tool for nitrogen management”, Hindi Agricultural Institute. Page no 1, June 2015.
[5] Tong, C, Shan He, Wang, K and Chen, L, “Identification of Nitrogen, Phosphorus, and Potassium Deficiencies Based on Temporal Dynamics of Leaf Morphology and Color”, Environmental and Resource Sciences. Page no 1, 10 March 2018.
[6] Islam, M .S, Bhuiya, M .S. U and Rahman, H (2009) “Evaluation of SPAD and LCC Based Nitrogen Management in rice” Bangladesh J Agril.
[7] Kaur, G, Din, S and Brar, A .S (2014) “Design and Development of Software for the Implementation of Image Processing Approach for Leaf Area Measurement”
[8] Global Young Leaders Programe. “Empowering Rice Farmers through Mobile Technology”, Executive Leadership Development Through Experiential Learning Hongkong and The Philipines, 2013.
[9] Pandurng, J. A and Lomte, S. S (2015) “Digital Image Processing Applications in Agriculture: A Survey”
[10] Tewari, V. K, Arudra, A. K, Kumar, S. P, Pandey, V and Chandel, N. S (2013)
“Estimation of plant nitrogen content using digital image processing” pp.15.
©Daffodil International University 24
