Siddique Hossain, Professor and Head of Department of Electrical and Electronic Engineering, BUET, Dhaka, for their support and cooperation. Zd(sc) Short circuit impedance of the direct axis. Z+ l)Number of cycles of the input signal to be simulated 8 Torque angle.
LIST OF TABLES
ABSTRACT
The results of the analysis were also substantiated by analyzes and experiments in the time domain. The scheme was developed from the results of inverter waveform analysis and synchronous motor stability analysis.
INTRODUCTION
- Introduction
- Review of Sine PWM Techniques for Inverter Opera- tion
- Review of Stability Analysis of Conventional Synchronous Machines
- Review of Machine Modeling
- Review on Determination of Machine Constants
- Review of Stability Study
- Review of Stability Analysis of Variable-Speed Syn- chronous Machines
- Objectives of the Thesis
- Thesis Organization
Studying the behavior of a synchronous machine requires the derivation of machine equations valid for general operating conditions. Stability is assessed by calculating the eigenvalues of the synchronous motor using a standard eigenvalue routine [114].
ANALYSIS OF STATIC PWM INVERTER WAVEFORMS
Introduction
Pulse Width Modulation Techniques
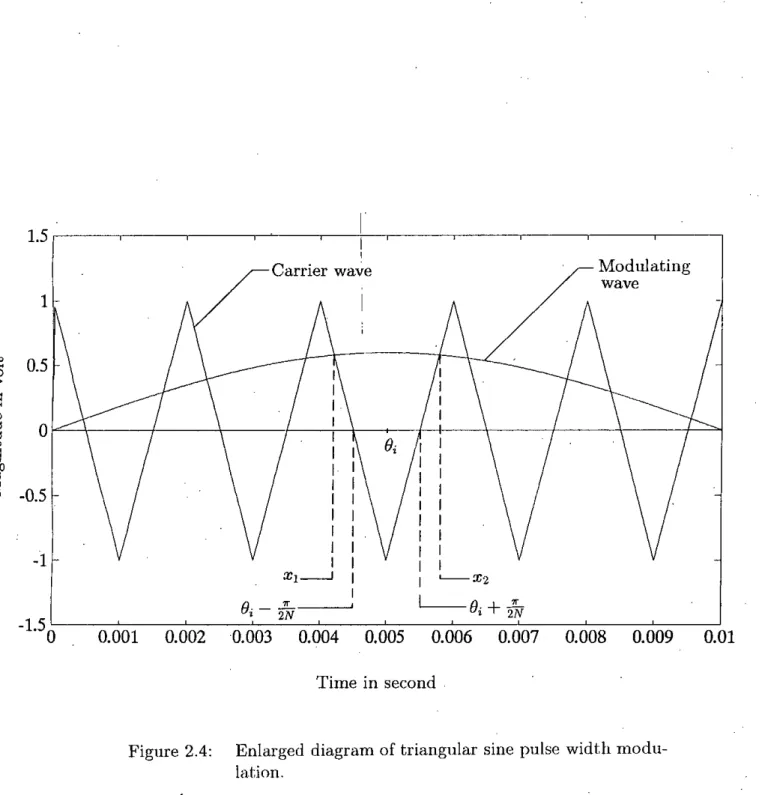
Proposed Method of Determining Switching Points of Tri- angular Sine Modulated Inverter Waveforms
2.4, an equation for the slope for any descending section of the triangular wave can be written as,. Similarly, the equation for the slope for any ascending section of the triangular wavelet is written as, 2.11).
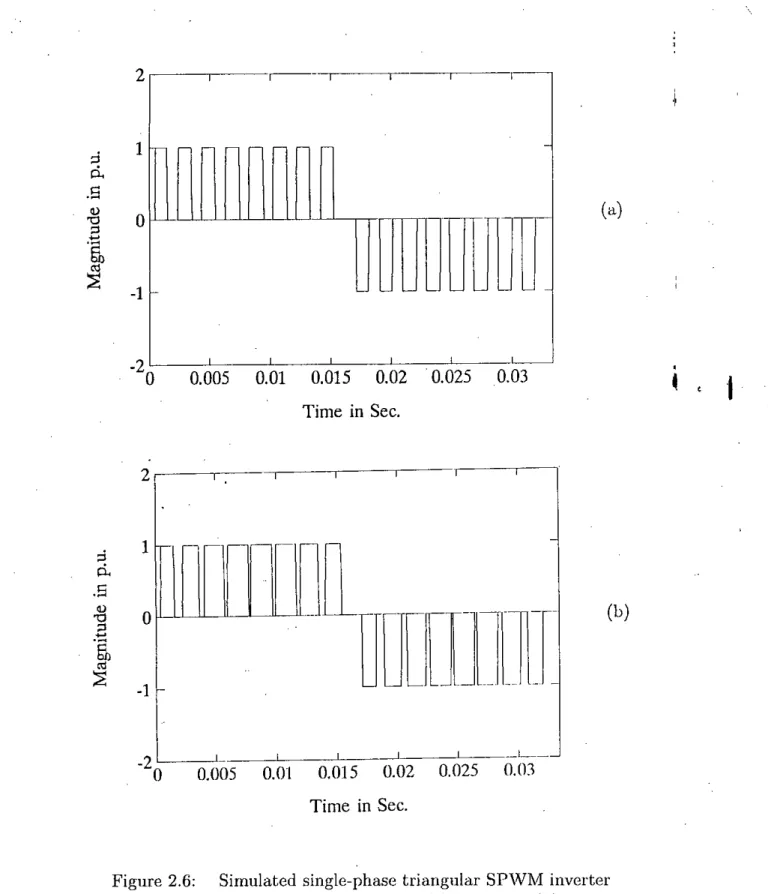
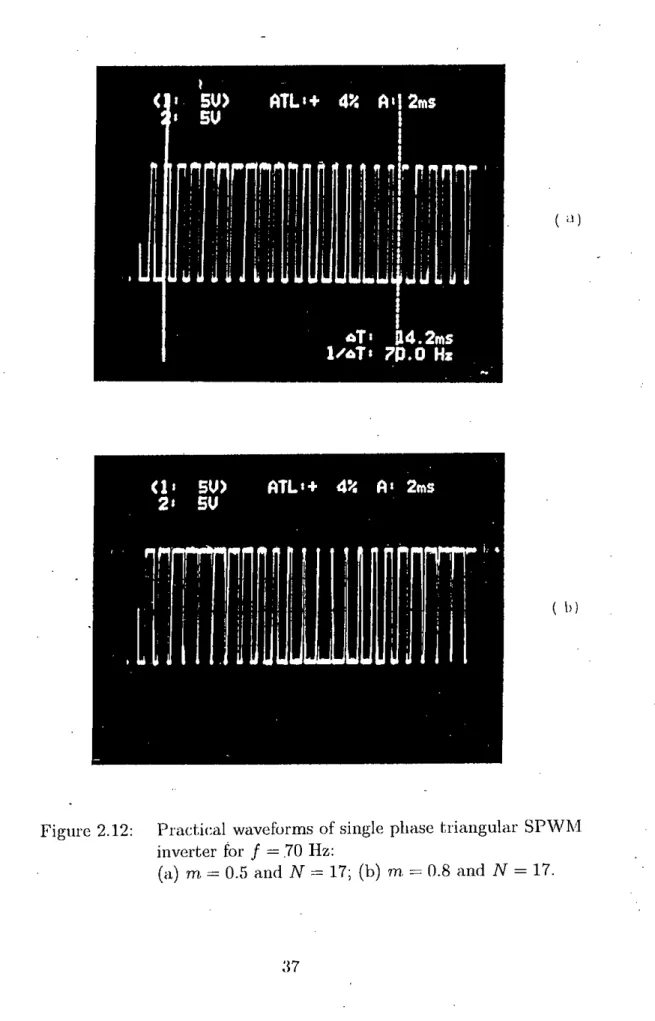
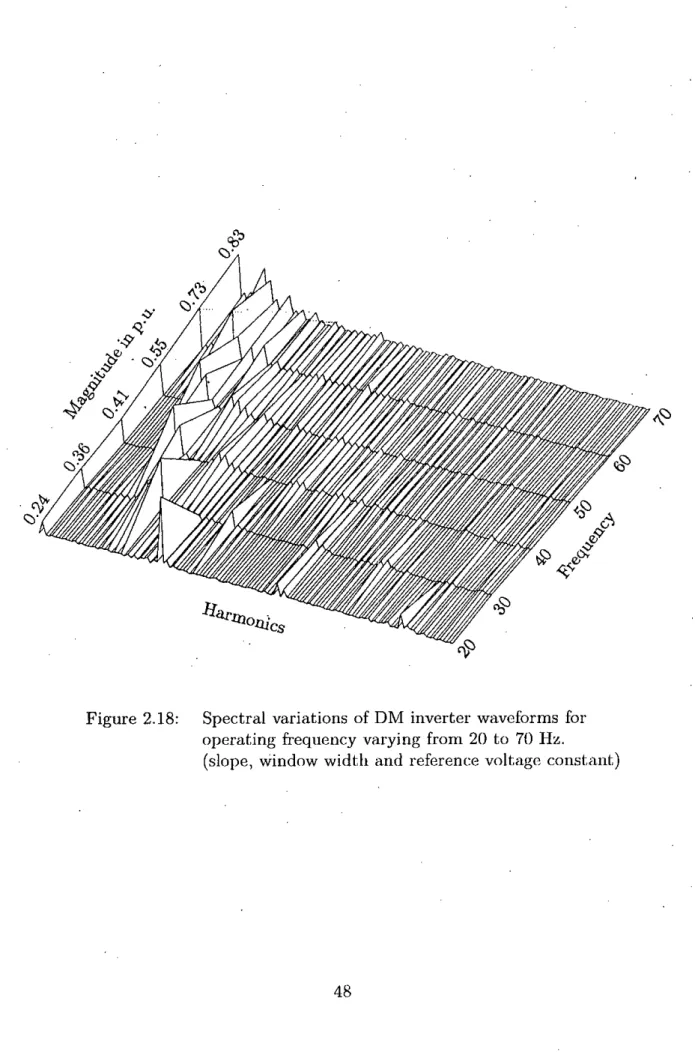
Triangular Sine PWM Inverter Waveform Analysis
Typical spectral variation of the triangular modulated inverter waves for variation of modulation index, carrier frequency and operating frequency is shown in Fig. However, the increase in the carrier frequency is limited by the switching frequency of the static devices used in the converters.
Proposed Method of Determining Switching Points of Delta Modulated Inverter Waveforms
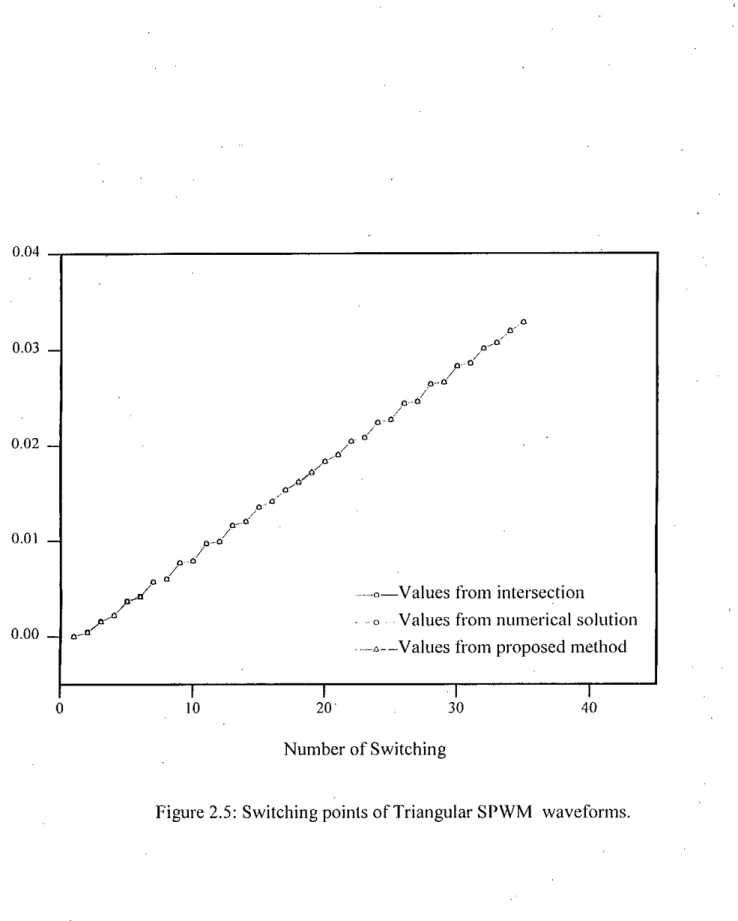
A general equation for coupling point determination of the divided.a modulated wave can be written which represents both equations (2.38) and (2.40). The comparison shows that the switching points of the proposed method are in close agreement with the other two methods, and insignificant differences in the results found by comparison have practically no influence on the base voltage of the inverter.
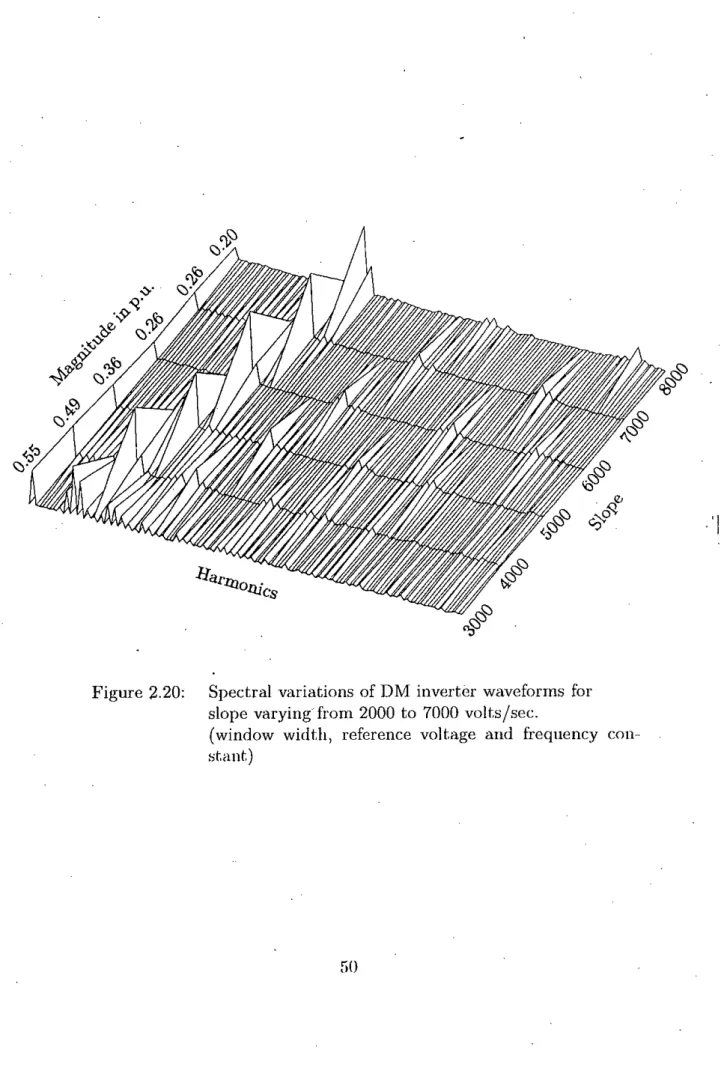
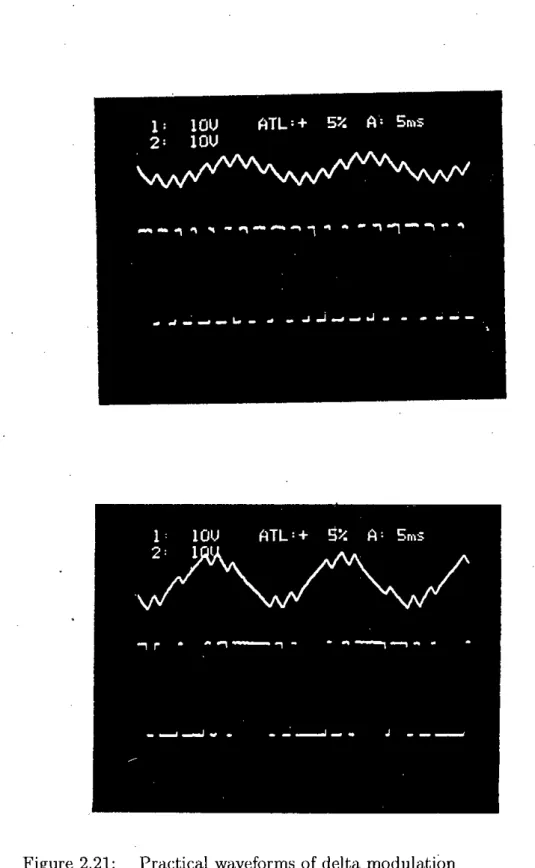
Delta Modulated Inverter Waveform Analysis
Parameters such as window width and modulator slope determine the available base voltage and the magnitude of harmonics in the converter waveforms. The magnitude of the reference wave also significantly controls the available base voltage of the converter. Increasing the magnitude of the reference wave (while all other par~llneterHare Illailllltained constant) il1cn~asesth(~availahle fll11d,llIH~ntal converter voltage).
One of the fundamental features of the delta modulation ie. vi f = constant control can also be.
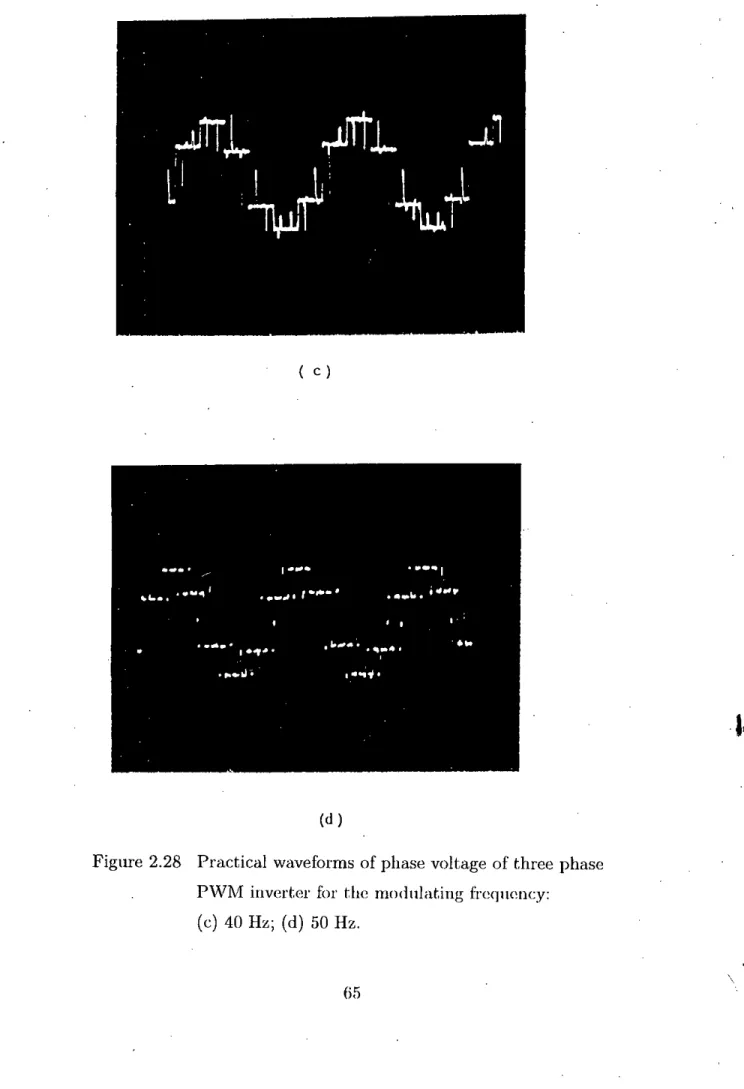
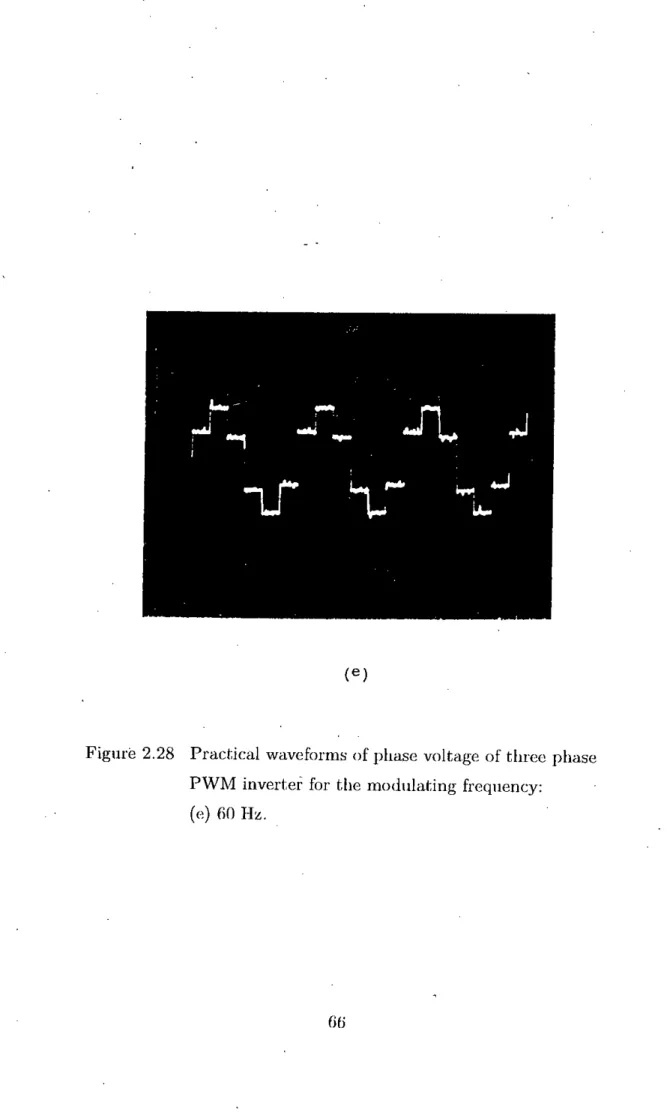
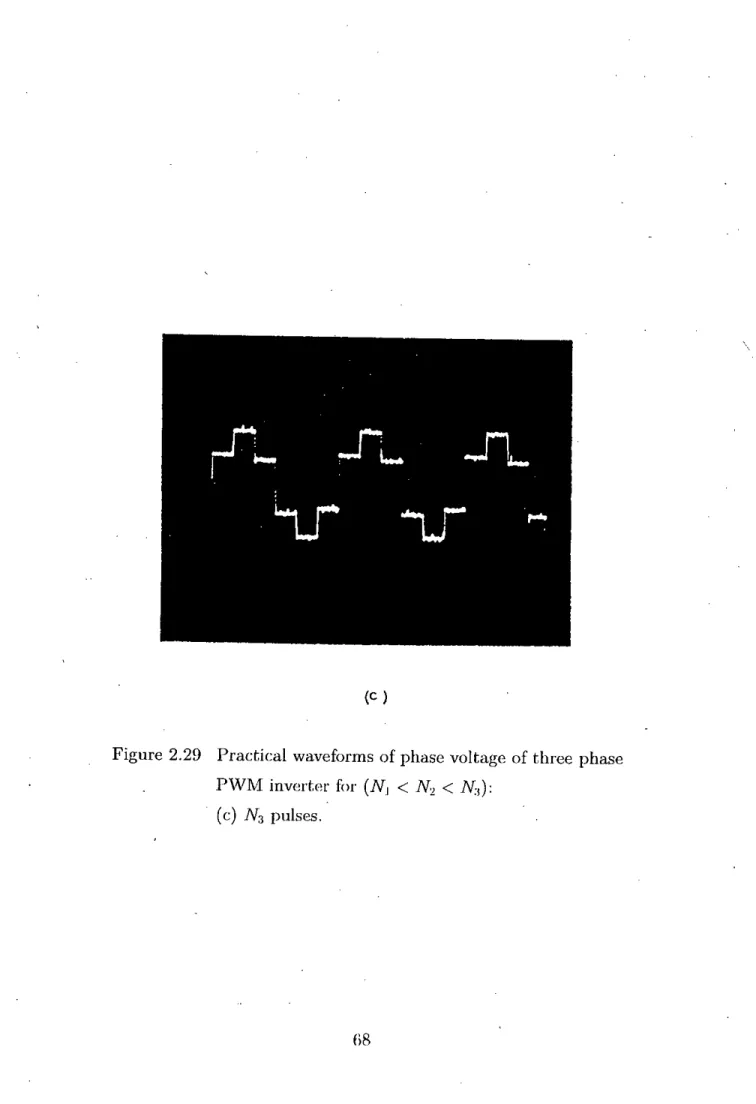
Three Phase PWM Inverter Waveform Analysis
This load current limiting characteristic within a band is naturally achieved in delta modulation. But the fuudamental component ()]lt of the filter output is equal to the magnitude of the input reference sine wave. 2.45) As long as the magnitude of the reference sine wave and the time constant of the modulator filter are kept constant (which is true if the values of the modulator components are not changed), then the product 11,.7 is constant. The analytical expressions for the line-to-line voltages in terms of the switching waveforms shown in Fig.
The expressions file line to inverter neutral voltages can be written in terms of switching waveforms as.
500 2000 2500 Frequency in Hz
STABILITY ANALYSIS OF SYNCHRONOUS MOTORS
Introduction
In this chapter, the linearization of the synchronous motor equations for a synchronous motor with variable voltage and variable frequency response is used to study the effects of operating constraints on motor stability. Eigenvalue determination of the state matrix machine equations The solution was used to study the stability of a synchronous motor. The method requires knowledge of the elements contained in the state matrix for 'stationary operating conditions.
The effects of finite constraints on stability are introduced by varying one quantity while keeping the others constant.
Synchronous Machine Models'
- Park's Model,
Parken's model [60,131] is based on the transformation of stator variables of synchronous machine to a reference frame fixed in the rotor. These equivalent circuits are the representation of Park's model for synchronous machines. to express the voltage and flux linkage elutions in terms of reactances rather than iuductances, where 'IjJ= Wb'\ represents flux linkage per second, and Wb is the base angular velocity used to calculate the inductive reactances. To obtain voltage equations in the form of currents as state variables, the flux connections per
It is more convenient to implement a computer simulation of a synchronous motor with flux linkages per second as state variables rather than with currents.
HO) 'where, H represents the rotor inertia and T L is the load torque
- Linearization .1 Motor Model
- Steady-State Operating Characteristics
- Linearization for Small Perturbations
- Eigenvalues for Stability Analysis
- Methods of Stability Studies
- Effects of Terminal Quantities on Stability
Before determining eigenvalues of the state matrix, the values of steady-state operating points contained in the state matrix were determined using equations (3.50) to (3.57). The seventh-order equations of the synchronous motor yield seven eigenvalues in each step of calculation. The two additional curves demonstrate that the stability of the synchronous motor is improved. due to increase in the applied stator voltage [5).
The results confirm the observations made by the eigenvalue method that the stability of the synchronous motor can be improved by increasing the stator voltage.
3 Time in second
Observation reveals that the stability of a synchronous machine improves with higher stator voltage as shown in Fig.
STABILITY ANALYSIS OF PWM
INVERTER-FED SYNCHRONOUS MOTOR OPERATION
Introduction
The stability of the synchronous motor operation is assessed using the eigenvalue method, which provides information on the stability characteristics of a system. To substantiate the eigenvalue results, time domain analyzes have been performed for the proposed volts/hertz control of synchronous motors. The validity of the theoretical results on stability improvement of synchronous motors has been verified by laboratory tests.
Principle of Stability Improvement
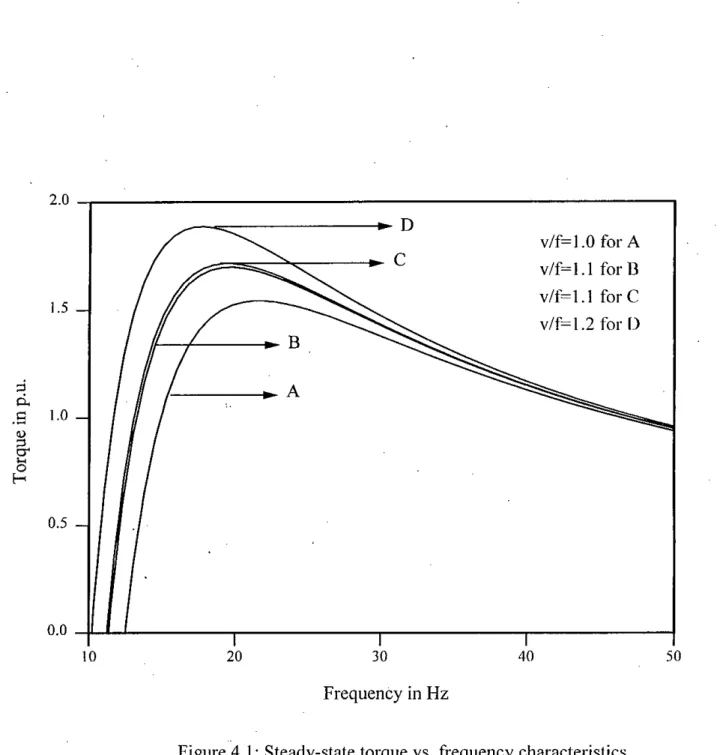
Curve C corresponds to the torque characteristic of a 10% increased stator voltage while the frequency is at the rated value, creating a higher torque limit than characteristics A and B. Curve D shows that the torque limit is significantly increased by simultaneously increasing the stator voltage and decrease the frequency. Therefore, it is clear that the stability of synchronous motors can be improved and the range of stable operation can be increased by simultaneously adjusting the stator voltage and frequency.
Analytical Procedure
The analysis consists of establishing volt/hertz control to maintain the stability of a particular synchronous motor by eigenvalue search technique using equations of variable voltage variable frequency supply and the motor model in d - q axes. The results of the eigenvalue search method and the proposed volt/hertz control are also verified by time domain analyzes of torque, torque angle, current, voltage and speed to observe the stability conditions from the variation of these variables with time.
Yolt/Hz control of Synchronous Motors
Proposed Yolt/Hz Control for Stability Improvement
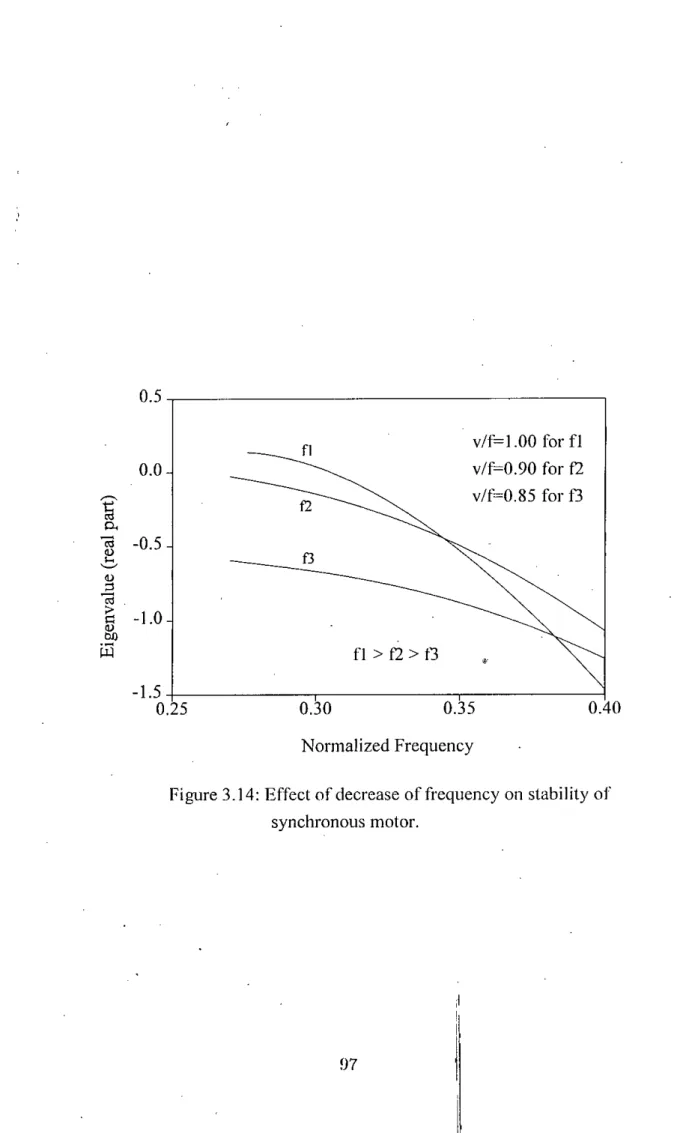
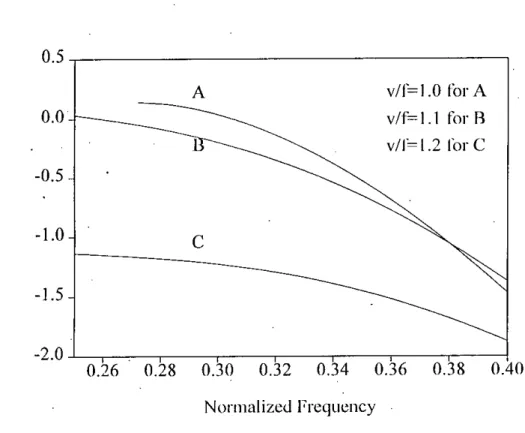
The results of the eigenvalue search method and the proposed volt/hertz control are also verified by time domain analyzes of torque, torque angle, current, voltage and speed to observe the stability condition according to the variation of these variables with time. voltage and frequency decrease result in a significant improvement in the stability of motor operation. An unstable operation cif synchronous motor for a reduction of voltage and frequency to 0.305 p.u. The effect of simultaneous increase in stator voltage and decrease in frequency on stability is demonstrated in Fig.
Such an unstable condition is st.abiiized by increasing the stator voltage by 0.01 p.I1.
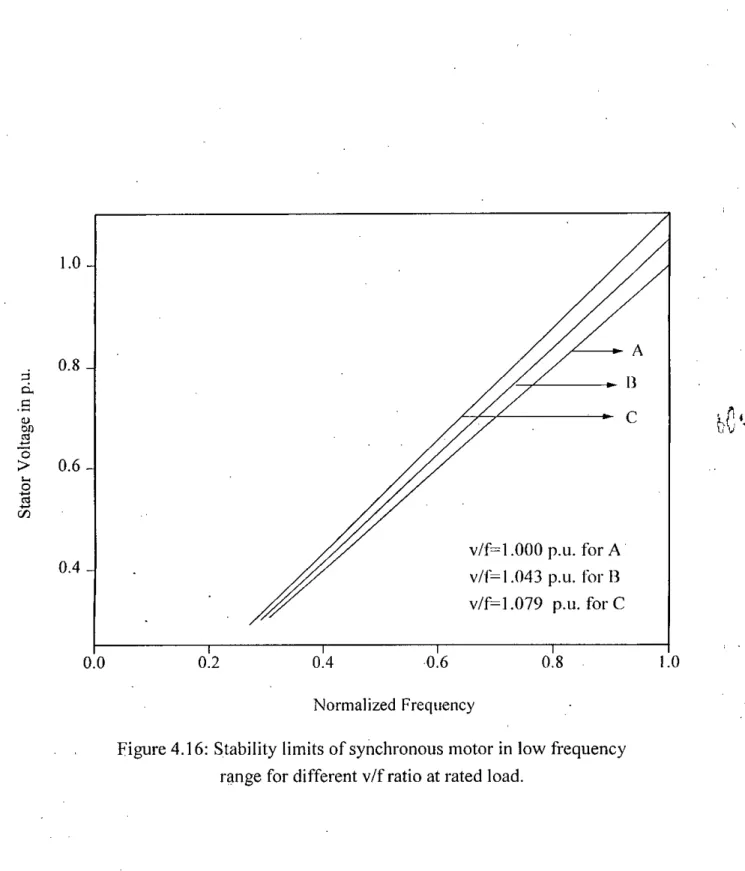
Voltage Frequency Relationship for Stable Operation
The stator voltage is then fixed at a higher value above the rated open, after the above steps a different value of volt/hertz ratio is found on the stability limit for the same target frequency. With further increase of volt/hertz ratio to 1.0?!), the minimum speed without loss of stability. The volt/hertz ratio is then set to a higher value by increasing the tlw stator voltage and decreasing the frequency to find a different load value for which pullout occurs.
The values of different volt/hertz ratios are plotted against load torque as shown in fig.
Experimental Results
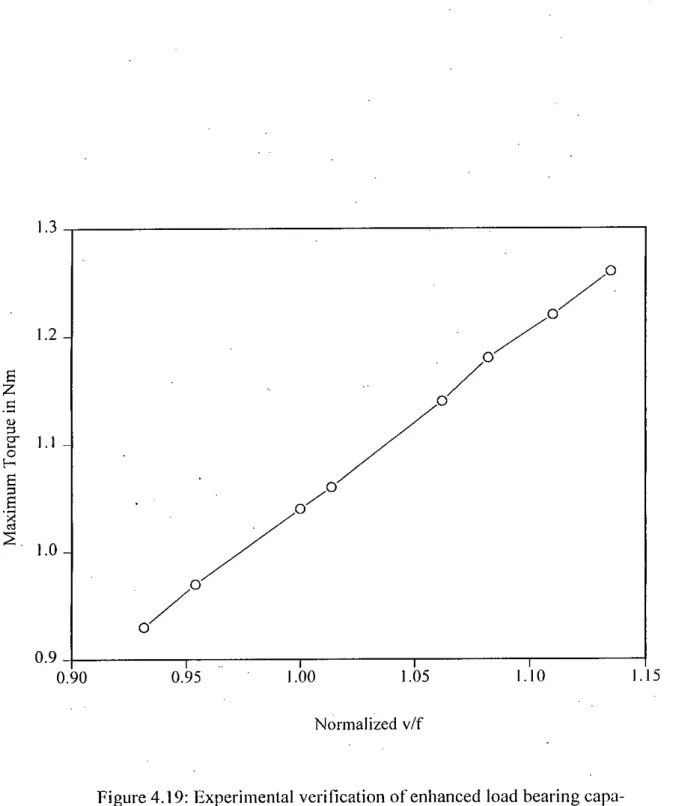
To verify this concept, the motor is started at the nominal voltage rated frequency indicating the nominal volt/hertz operation and load is added until pullout is achieved. The volt/hertz ratio is then set to a higher value by increasing voltage and decreasing frequency in a number of steps and pull-out is observed. The magnitude of volts/hertz and the corresponding pull-out torque are measured in each step.
By plotting the recorded data, the effect of increasing volt/hertz ratio on the pull-out torque is illustrated graphically in Fig.
Comments
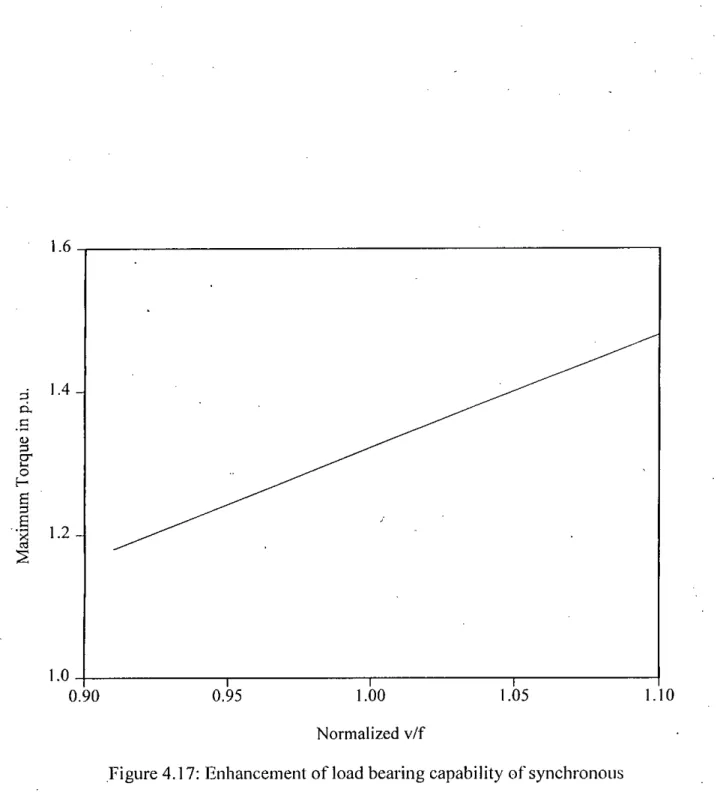
The slope of volts/hert2 for this curve is higher than A and varies from 1.08 at the lowest value of voltage and frequency to 0.88 at the highest value. The operation of the synchronous motor for increased volt/hert2 ratio proposed in this thesis also improves the load-carrying ability of the synchronous motor at the expense of lowering the speed. In the proposed v/f operation, the motor under investigation has been found to be capable of operating about 20% above the maximum allowable load of the rated v/f operation as shown in fig.
Inverter Control
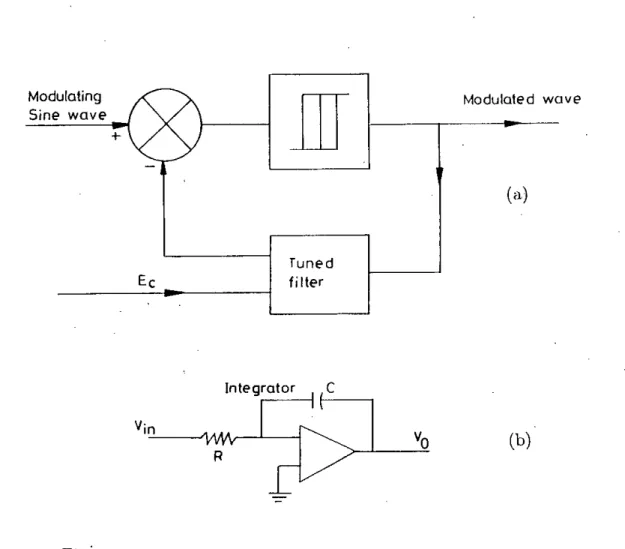
Tuned filter delta modulation will allow one to control the slope of the modulator to give the same variation with a control signal E", From' Fig. When the modulfl;tor incorporates a tuned filter, the fundamental of that delta -modulated wave to reference signal ratio The above ratio is also the inverse of the ratio between the output and input signal of the tuned filter placed in the modulator circuit.
Experimental verifications of the proposed scheme for improving the stability of the synchronous motor have been carried out using the motor-generator set.
CONCLUSIONS
SUMMARY
The stability study for the utility driven motors was made to form the theoretical basis of the analysis of inverter fed synchronous motors. The effects on stability were studied for individual variation and simultaneous variation of the applied stator voltage and frequency. Empirical relationships between the applied stator voltage and frequency are derived to stabilize the motor operation.
An increase in load above a certain magnitude causes the synchronous motor to exceed its torque angle limit cycle.
Suggestions for Further Research
Harley, "Estimating Synchronous Machine Electrical Para- parameters from Frequency Response Tests", IEEE Transactions on Energy Con- version, Vol. Watson, "Sinchronous Machine Models by Standstill Frequency Response Tests", IEEE Transactions on Power Apparatus and Systems, vol. Beck, "Tyd-domein identifikasie van sinchrone masjien parameters van eenvoudige stilstand toetse", IEEE Trans.
Wu, “A new method for determining the armature leakage reactance of synchronous machines,” IEEE Trans.
Appendix A
Simulated Waveforms and Spectra of Pulse Width Modulation
Appendix B
Synchronous Machine Parameter Identification by Stand-Still. Tests
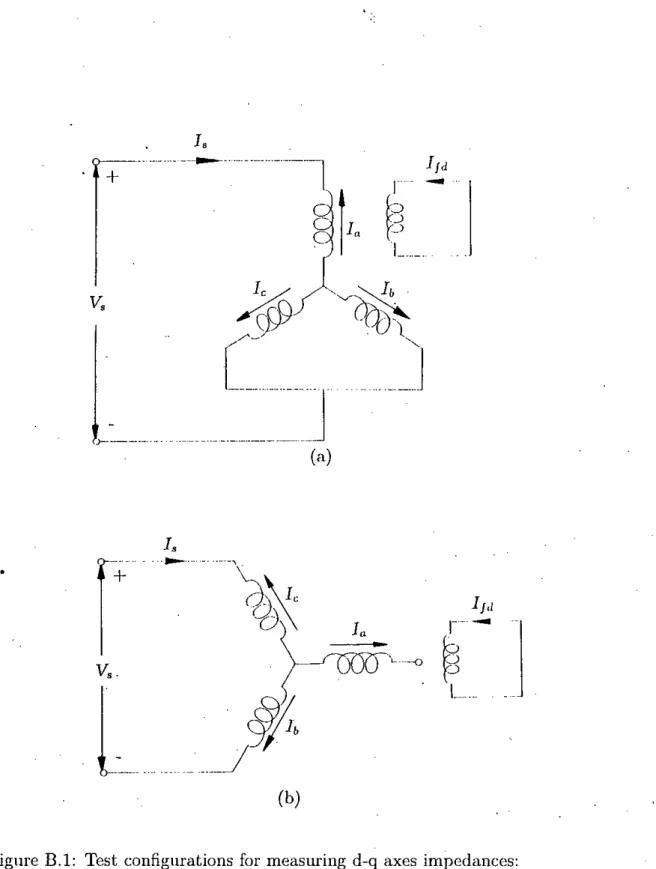
- D-Q axis Input Impedance Relationship From Test Measurements
- Connection-II
One of the main disadvantages of conventional methods is that these methods make assumptions that are not completely valid for machines of all sizes. The time domain identifications depend on the transfer function simulation and noise-free standstill measurements [8G]. The accuracy of this method also depends on arithmetic precessions during the calculation. If the values of tI" elements in the network can be measured with standard tests, the rest of the elements can be separated by applying phasor algebra.
The derivations of the equations for evaluating the input impedances d and qax in terms of measured quantities are shown for both test configurations in Figure 2.