UV Spectral Fingerprinting and Analysis of
Variance-Principal Component Analysis: a Useful
Tool for Characterizing Sources of Variance in Plant
Materials
D
EVANANDL. L
UTHRIA,*
,†S
UDARSANM
UKHOPADHYAY,
†,|R
EBECCAJ. R
OBBINS,
†,⊥J
OHNW. F
INLEY,
‡,#G
ARYS. B
ANUELOS,
§ ANDJ
AMESM. H
ARNLY†Food Composition and Methods Development Laboratory, Beltsville Human Nutrition Research Center, Agricultural Research Service, U.S. Department of Agriculture, Beltsville, Maryland 20705; Grand Forks Human Nutrition Research Center, Agricultural Research Service, U.S. Department of
Agriculture, Grand Forks, North Dakota 58202; and Water Management Research Laboratory, Agricultural Research Service, U.S. Department of Agriculture, Parlier, California 93648
UV spectral fingerprints, in combination with analysis of variance-principal components analysis (ANOVA-PCA), can differentiate between cultivars and growing conditions (or treatments) and can be used to identify sources of variance. Broccoli samples, composed of two cultivars, were grown under seven different conditions or treatments (four levels of Se-enriched irrigation waters, organic farming, and conventional farming with 100 and 80% irrigation based on crop evaporation and transpiration rate). Freeze-dried powdered samples were extracted with methanol-water (60:40, v/v) and analyzed with no prior separation. Spectral fingerprints were acquired for the UV region (220-380 nm) using a 50-fold dilution of the extract. ANOVA-PCA was used to construct subset matrices that permitted easy verification of the hypothesis that cultivar and treatment contributed to a difference in the chemical expression of the broccoli. The sums of the squares of the same matrices were used to show that cultivar, treatment, and analytical repeatability contributed 30.5, 68.3, and 1.2% of the variance, respectively.
KEYWORDS: Broccoli;Brassica oleracea; spectral fingerprinting; analysis of variance; principal com-ponent analysis; ANOVA-PCA; UV spectrophotometry
INTRODUCTION
Spectral fingerprinting is a rapid method for the comparison and classification of biological materials. It has been acquiring increasing attention in the field of metabolomics and agricul-ture (1–8) and has been used for a wide variety of plants and plant products, including grains, fruits, vegetables, wines, honeys, teas, and herbal medicines. Genetic and environmental factors influence metabolic pathways and produce different patterns of chemical composition thereby causing variations in
the fingerprint. While fingerprinting allows differentiation based on the overall pattern, identification of the specific components causing the differences in the patterns is not the primary purpose. The success of spectral fingerprinting is dependent on the magnitude of the variation in the patterns induced by the experimental factors as compared to the normal variation among individual plants. With proper experimental design and data processing, spectral fingerprinting can be a useful tool for characterizing the sources of variation in plant materials (7, 9). Spectral fingerprints are acquired from solid samples or sample extracts with no prior separation. Consequently, spectral fingerprints are the sum of spectra of every component present. Spectral fingerprinting has been reported using a variety of detectors but primarily those that provide high dimensional data (i.e., many variables per sample) such as infrared (IR), near-infrared (NIR), mass (MS), and nuclear magnetic resonance (NMR) spectrometry (1–8). For MS and NMR, the high dimensionality of the data is frequently used in the search for the sources of the pattern variations, as is the case for biomarkers. To date, molecular absorption (UV
spectropho-* To whom correspondence should be addressed. Phone: (301) 504-7247. Fax: (301) 504-8314. E-mail: [email protected].
†
Beltsville Human Nutrition Research Center. ‡
Grand Forks Human Nutrition Research Center. §
Water Management Research Laboratory. |
Current address: Eastern Regional Research Center, USDA, 600 E. Mermaid Lane, Wyndmoor, Pennsylvania 19038.
⊥Current address: Mars Snackfood U.S., LLC Analytical and
Applied Sciences Group, 800 High Street, Hackettstown, New Jersey 07840.
#
Current address: 150A Domorah Dr., Montgomeryville, Pennsyl-vania 18936.
tometry) has not been used for spectral fingerprinting of plant materials, but rather, it has been used for quantification of dissolved organic compounds (10). In general, the broad width of the molecular absorption bands makes it difficult to distin-guish contributions of specific components. Hence, the method is generally not considered to have high information content. Principal components analysis (PCA) is a multivariate data analysis method that is frequently used to reduce the dimen-sionality of the data set and to derive meaningful patterns from the complex spectral fingerprints. It is suitable for high dimensional and underdetermined (more sample variables than samples) data (11, 12). In cases of multiple sources of variation, however, PCA provides average solutions for the total variance and is unable to characterize individual factors (11). Classical analysis of variance (ANOVA) was designed to deconvolute the variance and quantify the contribution of each experimental factor (13). Harrington et al. (11, 14) have described an ANOVA-PCA method that combines these two approaches. This combination method partitions the data matrix into subset matrices that correspond to each experimental factor. The appropriate subset matrices are then submitted to PCA, which provides an easily interpreted graphical plot. If the effect of the experimental factor is large compared to the pure, or residual, error, the data can be clearly separated on the horizontal axis; that is, the first principal component provides clear differentia-tion. Thus, the significance of an experimental factor can be determined without factor analysis.
In this study, UV spectrophotometry (200-400 nm) was used to obtain spectral fingerprints of broccoli (Brassica oleracea) samples and ANOVA-PCA was used to analyze the data. Broccoli was chosen as a test material because of the availability of a set of partially characterized samples consisting of two cultivars that had been subjected to widely differing treatments (growing conditions) (15–17). Moreover, these broccoli samples had been shown to have significant differences in levels of phenolic acids, glucosinolates, and free amino acids. ANOVA-PCA was used to test the hypothesis that genetic and environ-mental conditions induced differences in the chemical compo-sition of the broccoli that were detectable in UV spectral fingerprints.
MATERIALS AND METHODS
Plant Materials. Samples were freeze-dried, and powdered com-posites of two varieties of broccoli (Brasscia oleracea) Majestic and Legacy were provided by Dr. John W. Finley (ARS, USDA) and Dr. Gary Banuelos (ARS, USDA). Majestic variety broccoli was grown with four different concentrations of sodium selenate (15). Ap-proximately 2 weeks prior to the head formation, 10 mL of four concentrations of sodium selenate (0, 0.17, 0.52, and 5.2 mM) were applied to the developing plants every other day for 8 days; then 20 mL of sodium selenate solution from each respective concentration was applied every other day for two additional applications. This treatment with varying concentrations of sodium selenate resulted in 0.4, 5.7, 98.6, and 879.2µg/gm of selenium (dry weight) in the broccoli florets. In the text, the four selenium (Se) treatments are referred to as 0, 5, 100, and 1000 ppm, respectively.
Broccoli (B. oleracea, variety Legacy) was grown at two different field sites in central California (Harris farms, Five Points, CA); one field used conventional farming methods, and the other used a certified organic field (15). Both farms represented typical organic and conven-tional broccoli production in the Central California Valley Region, where the soil type was classified as Panoche clay loam. Conventionally and organically grown broccoli were planted by direct seed, and for the first 30 days, water was applied with a sprinkler irrigation system. After this interval, water was provided by surface drip irrigation (T-tape drip line, T-Systems Int., San Diego, CA) for the remainder of
the season until harvest. Two irrigation levels were used representing 100 and 80% of the evapotranspiration rate based upon Westlands California Irrigation Management Information System weather station for the conventional grown broccoli. Organically grown broccoli was raised using a single level of irrigation at 100% evapotranspiration rate. No samples were available for organically grown broccoli at 80% of the transpiration rate. We were not involved in the experimental design and received the samples only upon completion of the experiments. In the text, these three treatments are referred to as C100, C80, and Org, respectively.
Broccoli plants were harvested for each respective treatment, and crops were grown at least four times (15). Whole plants were separated into leaf, stems, and florets. Frozen broccoli florets were then freeze-dried and coarsely ground in the food processors. Ground samples were kept below-20°C. Prior to analysis or extraction, samples were sieved through standard 20 mesh sieves (particle size<0.850 mm) to obtain a uniform homogenized particle size sample.
Chemicals.HPLC-grade MeOH was purchased from Fisher Chemi-cals (Fair Lawn, NJ). HPLC-grade acetone was purchased from Burdick & Jackson (Muskegon, MI). Deionized water (18.2 MΩ·cm) was obtained in-house using a Nanopure diamond analytical ultrapure water purification system (Model # D11901, Branstead Intl., Dubuque, IA). Polyvinylidene difluoride (PVDF) syringe filters with a pore size of 0.45 µm were procured from National Scientific Company (Duluth, GA).
Extraction.The freeze-dried and powdered broccoli samples were placed in a 16×125 mm2screw cap vial with 5 mL of MeOH/H2O (60:40, % v/v). The mixture was sonicated in a bath (Branson 2510, Branson Ultrasonic Corporation, Danbury, CT) at 40°C for 30 min. The mixture was centrifuged (Model GT2, West Chester, PA) at a low speed (5000 rpm) for 10 min. The supernate was transferred into a separate vial, and the residue was extracted for two more times with 2.5 mL of fresh MeOH/H2O (60:40, % v/v). The volume of the combined extract was adjusted to 10 mL with MeOH/H2O (60:40, % v/v). All extracts were stored in 2 mL HPLC vials under nitrogen at -70°C until analyzed. An appropriate aliquot of each extract was filtered using a PVDF syringe filter (pore size)0.45µm) prior to UV and MS analysis. Each of the seven treatments (0, 5, 100, 1000 ppm, C100, C80, and Org) was extracted 10 times.
Data Acquisition. The Ultraviolet (UV) spectral fingerprints of broccoli extracts were recorded on a Lambda 25 spectrophotometer (Perkin-Elmer, Boston, MA). Extracts diluted by a factor of 50 were used for spectral scans between 220 and 380 nm due to the strong absorbance of the extracts in this region. Spectra were acquired for each of the 10 extracts for each of seven treatments producing 70 spectra for the UV and 70 for the visible region.
Data Analysis.All spectral data were converted to the American Standard Code for Information Interchange (ASCII) files and exported for chemometric analysis. Preprocessing of the data matrices was performed on Excel (Microsoft, Inc., Belleview, WA) and PCA was performed using Piroutte 3.1 (Infometrix, Inc., Bothell, WA).
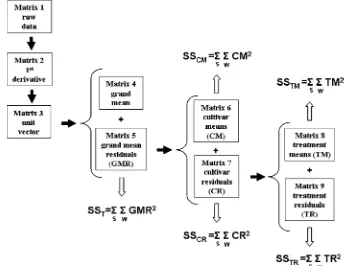
The data were preprocessed for ANOVA-PCA as described by Harrington et al. (11) and shown in Figure 1. The spectra were transformed to the first derivative, smoothed using a seven point second order polynomial (18), normalized to provide a unit vector (Matrix 3), and then mean centered at each wavelength (Matrix 4). The mean centered spectra for each treatment were plotted (not shown) and examined for outliers. Two spectra were discarded because an incorrect dilution was used and six were discarded because of anomalies in the data. The anomalies were manifested as short (less than 15 nm) excursions from the normal pattern (seen for the other samples of the same treatment) in either a positive or negative direction.
(Matrix 6+Matrix 9) and by adding the treatment means and the analytical error (Matrix 8+Matrix 9, i.e. Matrix 7).
The variance contribution of the experimental factors were computed as follows: (1) the total variance, the sum of the squares around the grand mean, was computed as the sum of the squares of the grand means residuals (TSS, the sum of squared values for Matrix 5a), (2) the variance between cultivars was computed as the sum of the squares of the cultivar means (SSCM, the sum of squared values for Matrix 6), (3) the variance within cultivars was computed as the sum of the squares of the cultivar residuals (SSCR, the sum of squared values for Matrix 7), and (4) the variance between treatments was computed as the sum of the squares of the treatment means (SSTM, the sum of squared values for Matrix 8), and the variance within treatments was computed as the sum of the squares of the treatment residuals (SSTR, the sum of squared values for Matrix 9).
RESULTS AND DISCUSSION
The data for the two cultivars grown under seven different conditions were analyzed initially using conventional PCA and then with ANOVA-PCA to illustrate the difference in the approaches. The data subsets for ANOVA-PCA were further processed (as described in the Materials and Methods Section) to quantify the variance contributed by each experimental factor (cultivar and treatment) averaged over the entire spectra.
Conventional PCA. Figure 2 shows the object score plot (2nd principal component as a function of the first principal component) for PCA of the UV spectral fingerprints, which have been transformed to the first derivative, smoothed using a seven point second order polynomial, scaled to a unit vector, and mean centered (Matrix 5). Five groupings are clearly discernible; the four Se treatments (0, 5, 100, and 1000 ppm) for the Majestic cultivar and the fifth composed of the Legacy cultivar. An object score plot of only the Legacy data allows the organically grown (Org) and the two conventionally grown (C100 and C80) to be differentiated (plot not shown). In each case, three principal components are needed to account for 85% of the variance. In other words, a two, or sometimes three, dimensional plot is needed to visually detect the separation of the different treatments. Thus, conventional PCA shows that the cultivars
can be differentiated as well as the treatments. It is intuitive fromFigure 2, that the effect of the Se treatment is much greater than the organic, conventional, or level of irrigation.
ANOVA-PCA. Figure 3shows the object score plot for PCA of the ANOVA test matrix for cultivar. The test matrix was obtained by adding the cultivar mean matrix (Matrix 6) and the pure error matrix (Matrix 9). In this study, the pure error
Figure 1. ANOVA preprocessing scheme. Terms are defined in the text, with integration over S (sample) and W (wavelength).
Figure 2. Object score plot for PCA of the UV spectral data without ANOVA preprocessing. Data was derivatized, smoothed, scaled to unit vector, and mean centered. The first two principal components account for 85% of the total variation. The five groups correspond to 0, 5, 100, and 1000 ppm and all the Majestic treatments (Org, C100, and C80) as described in the text.
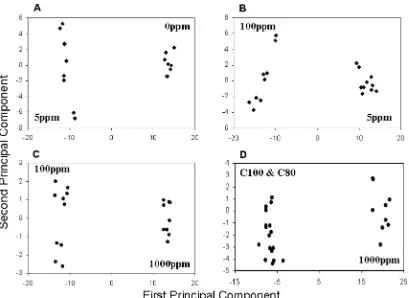
corresponds to the analytical error, since the composites for each of the seven sample treatments were extracted and analyzed 10 times. The distinction between the Legacy and Majestic broccoli is clearly made on the basis of the separation on the first component axis. The object score plot for PCA of the ANOVA test matrix for all the treatments (Matrix 8 +Matrix 9) was very similar to Figure 2. With the variance due to cultivar removed, five groupings are clearly visible (0, 5, 100, 1000 ppm and the treatments of the Legacy). The variance due to Se treatment is much larger than that introduced by organic and conventional farming. Comparison of the data in pairs produced visually distinctive patterns.Figure 4shows a series of object score plots for PCA of different pairs of treatments. The data were taken from the treatment test matrix. Each plot inFigure 4 shows a clear separation of the treatments on the first component axis. In Figure 4D, the conventionally grown broccoli was treated as one group; the treatment means were calculated for C100 and C80 together. Every paired comparison of the treatments (except conventionally and organically grown, discussed below) showed results similar to those inFigure 4.
Figure 5shows a comparison of organically and convention-ally grown Legacy broccoli. As before, the conventionconvention-ally grown broccoli was treated as one group; the treatment mean was calculated for C100 and C80 together. Separation on the first component axis is achieved at the 95% confidence level. Individually, the C100 and C80 are separated at the 95% confidence level (Figure 6), and each is separated from the organic treatment at the same confidence level.
Source of Variance.The matrices inFigure 1can be used to estimate the variance for each experimental factor using a modified ANOVA approach. In this case, summation of the squares of the data for each matrix serves to base the variance calculation on the entire spectra.Table 1 shows that, for the UV region (220-380 nm), 32.6% of the variance arises from
the cultivar, 67.4% arises from the treatment, and 1.2% is because of analytical variance.
A single variable (one wavelength) can be used for classic ANOVA. Instead of summing the variance for the UV spectra
Figure 4. A series of object score plots for PCA of UV spectral data with ANOVA preprocessing comparing: (A) 0 and 5 ppm; (B) 5 and 100 ppm; (C) 100 and 1000 ppm; (D) 1000 ppm and conventional (C80 and C100).
Figure 5. Object score plot for PCA of the UV spectral data with ANOVA preprocessing comparing organic (Org) and conventionally grown (C100 and C80) broccoli. Ovals represents 95% confidence limits.
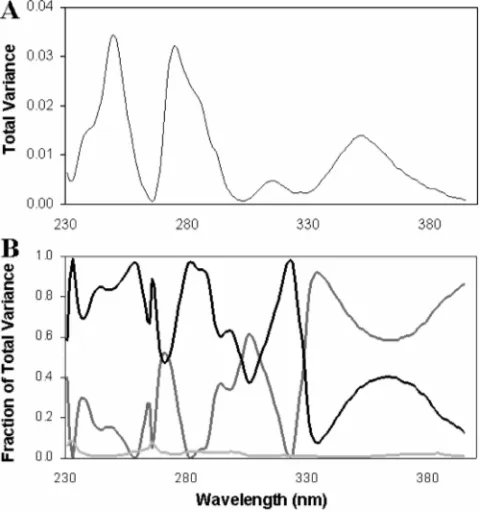
with respect to wavelength (161 wavelengths from 220 to 380 nm), each wavelength can also be considered individually as shown inFigure 7.Figure 7Ashows the loading plot for the total variance andFigure 7Bshows the variable loading plot for variance attributable to cultivar, treatment, and analytical variability.
It can be seen that the percent of variance assigned to cultivar and treatment is highly wavelength dependent. These two sources vary inversely with a total of approximately 99% (the 1% being contributed by the analytical variance). In general, wavelengths below 350 nm are more dependent on treatment and higher wavelengths are dependent on cultivar. Interestingly, the total variance plot shown inFigure 7, closely resembles a UV spectrum of typical phenolic acids with absorption maxi-mum at 245, 270, and 350 nm. The average for the whole spectra (220-380 nm) presented inTable 1represents the average for all the wavelengths weighted by the total variance at each wavelength.
The wavelength dependence of the source of variance indicates that cultivar and treatments affect different compounds, which absorb at different wavelengths. The UV spectra in this study were measured for 60% aqueous methanol extracts; a solvent mixture optimized for phenolic compounds would also be effective for the extraction of glucosinolates. In general, phenolic compounds show maximum absorption below 350 nm and glucosinlates below 250 nm. Both phenolics and glucosi-nolates are known to be highly influenced by environmental conditions.
The broccoli samples analyzed in this study have been previously characterized for secondary metabolites. Robbins et al. (15) and Finley et al. (16) found that the phenolic (flavonoids and phenolic acids) and glucosinolate concentrations were highly treatment dependent. They found more flavonoids in Majestic, more phenolic acids in Legacy, decreased glucosinolate con-centration with increased Se fertilization, and decreased phenolic and glucosinolate concentrations with organic farming and water stress (C80). Lee et al. (17) showed that increasing Se fertilization generally increased the free amino acid levels and changed their relative concentrations. Since most amino acids are transparent in the UV range, they would have little impact on the spectra measured in this study. The variability of the phenolics and glucosinolates are consistent with the ability of the fingerprints to differentiate between treatments. No attempt was made to correlate the secondary metabolite content with the fingerprints using partial least-squares discriminant analysis. It is logical to assume that there are some compounds that are less sensitive to the environment and strongly linked to the genetic makeup of the plant. If not, conventional breeding programs would never be successful and cultivars would be indistinguishable. Unfortunately, there has been no characteriza-tion of the broccoli samples used in the study for major metabolic constituents. These compounds were not considered because few proteins, carbohydrates, and fats are extracted by the 60% aqueous methanol solution and carbohydrates are transparent in the UV. The data collected in this study do not make it possible to identify families of compounds that might be contributing to the dominant cultivar variance above 340 nm. UV spectrophotometry has neither the resolution nor the dimensionality to permit identification of specific com-pounds.
Conclusions.This study has shown that UV spectral finger-prints can provide useful information for identifying the effect of cultivar and treatment on broccoli. ANOVA-PCA provides easily interpreted visual plots, and the matrices can be further employed to calculate the variance contributed by each of the experimental parameters. Together, UV spectral fingerprinting and ANOVA-PCA provide a useful and very inexpensive tool for the characterization of the sources of variance in plant materials.
ACKNOWLEDGMENT
We are thankful to Dr. Rebecca Robbins and Dr. John Finely for the samples. We are thankful to Dr. Scott Ramos for his help in using the Pirouette program.
LITERATURE CITED
(1) Sumner, L. W.; Mendes, P.; Dixon, A. Plant metabolomics: large-scale phytochemistry in the functional genomics era. Phytochem-istry2003,62, 817–836.
(2) Goodacre, R.; Vaidyanathan, S.; Dunn, W. B.; Harrigan, G. G.; Kell, D. B. Metabolomics by numbers: acquiring and understand-ing global metabolite data.Trends Biotechnol. 2004,22, 245– 252.
(3) Wang, Y.; Tang, H.; Nicholson, J. K.; Hylands, P. J.; Sampson, J.; Whitcombe, I.; Stewart, C. G.; Caiger, S.; Oru, I.; Holmes, E. Metabolomic strategy for the classification and quality control of phytomedicine: a case study of chamomile flower (Matricaria recutitaL.).Planta Med.2004,70, 250–255.
(4) Dunn, W. B.; Overy, S.; Quick, W. P. Evaluation of automated electrospray-TOF mass spectrometry for metabolic fingerprinting of the plant metabolome.Metabolomics2005,1, 137–148. (5) Dunn, W. B.; Ellis. Metabolomics: current analytical platforms
and methodologies.Trends Anal. Chem.2005,24, 285–294. Table 1. Analysis of Variance for Spectral Fingerprints
sum of squares cultivar growing condition percent
total 1.820 100.0
between cultivars 0.594 32.6
within cultivars 1.226 67.4
between treatments 1.205 66.2
within treatments 0.021 1.2
(6) Krishnan, P.; Kruger, N. J.; Ratcliffe, R. G. Metabolite fingerprint-ing and profilfingerprint-ing in plants usfingerprint-ing NMR.J. Exp. Biol.2005,56, 255–265.
(7) Dixon, R. A.; Ganng, D. R.; Charlton, A. J.; Fiehn, O.; Kuiper, H. A.; Reynolds, T. L.; Tjeerdema, R. S.; Jeffery, E. H.; German, J. B.; Ridley, W. P.; Seiber, J. N. Application of metabolomics in agriculture.J. Agric. Food Chem.2006,54, 8984–8994. (8) Mattoli, L.; Cangi, F.; Maidecchi, A.; Ghiara, C.; Ragazzi, E.;
Tubaro, M.; Stella, L.; Tisato, F.; Traldi, P. Metabolomic fingerprinting of plant extracts.J. Mass Spectrom.2006,41, 1534– 1545.
(9) Brown, M.; Dunn, W. B.; Ellis, D. I.; Goodacre, R.; Handl, J.; Knowles, J. D.; O’Hagan, S.; Spacic, I.; Kell, D. B. A metabolome pipeline: from concept to data to knowledge.Metabolomics2005, 1, 39–51.
(10) Pons, M.-N.; Le Bonte, S.; Potier, O. Spectral analysis and fingerprinting for biomedia characterization.J. Biotechnol.2004, 113, 211–230.
(11) Harrington, D. B.; Vieira, N. E.; Espinoza, J.; Kien, J. K.; Romero, R.; Yergey, A. L. Analysis of variance-principal component analysis: a soft tool for proteomic discovery.Anal. Chim. Acta 2005,544, 118–127.
(12) Wold, S. Principal component analysis.Chemom. Intell. Lab. Syst. 1987,2, 37–52.
(13) Harrington, D. B.; Vieira, N. E.; Ping, C.; Espinoza, J.; Kien, J. K.; Romero, R.; Yergey, A. L. Proteomic analysis of amniotic flids using analysis of variance-principal component analysis and fuzzy rule-building expert systems applied to matrix-assisted laser
desorption/ionization mass spectrometry.Chemom. Intell. Lab. Syst.2006,82, 283–293.
(14) Bender, F. E.; Douglas, L. W.; Kramer, A.Statistical Methods for Food and Agriculture; AVI Publishing Co.: Westport, CT, 1982.
(15) Robbins, R. J.; Keck, A. S.; Banuelos, G.; Finley, J. W. Cultivation conditions and selenium fertilizations alter the phenolic profile, glucosinolate and sulforaphane content of broccoli.J. Med. Food 2005,8, 204–214.
(16) Finley, J. W.; Sigrid-Keck, A.; Robbins, R. J.; Hintze, K. J. Selenium enrichment of broccoli: interactions between selenium and secondary plant compounds.J. Nutr.2005,135, 1236–1238. (17) Lee, J.; Finley, J. W.; Harnly, J. Effect of selenium fertilizer on free amino acid composition of broccoli (Brassica oleraceacv Majestic) determined by gas chromatography with flame ionization and mass selective detection.J. Agric. Food Chem.2005,53, 9105–9111.
(18) Savitsky, A.; Golay, M. J. E. Smoothing and differentiation of data by simplified least squares procedures.Anal. Chem.1964, 36, 1627–1639.
Received for review November 27, 2007. Revised manuscript received February 17, 2008. Accepted April 4, 2008. This work was supported by the Agricultural Research Service of the U.S. Department of Agriculture and an interagency agreement with the Office of Dietary Supplements at the National Institutes of Health, Bethesda, MD.