TROPICAL DEFORESTATION IN BUKIT BARISAN SELATAN NATIONAL PARK, SUMATRA, INDONESIA
SUYADI
Bogor Agricultural University Email: [email protected]
ABSTRACT
The Bukit Barisan Selatan National Park (BBSNP), the third-largest protected area (356.800ha) on the Indonesian island of Sumatra contains some of the largest tracts of tropical forest remaining on Sumatra. The park is home to some of the world’s endangered mammals and some endemic mammals. The greatest threats to conservation of BBSNP are deforestation, but accurate estimates of the scale and rate of loss are lacking. Here, I was link time series satellite imageries, historical record, and socio-economic survey to provide an accurate estimates of deforestation in BBSNP and to unravel the causes of deforestation. The result shows BBSNP’s forests have been cleared since 1960s, earlier than previous estimation. Before 1972 BBSNP forest has been lost of 46.100 ha, representing a 13% loss. From 1972 until 2006, deforestation in BBSNP averaged 0.64% per year. The forest of BBSNP 67,225 ha of the original forest of 310,670 ha that remained in 1972, representing a 21% loss from 1972 to 2006. The majority (80%) of forest conversion resulted from agricultural development. Three levels of the causes of deforestation were identified: 1) agents, 2) immediate causes, and 3) underlying causes. The agents of deforestation are farmers; the immediate causes are timber concessions, illegal loggings, and coffee price; and the underlying causes are law enforcement and socio-economic condition. The conclusions are BBSNP forests cover has been lost dramatically and in the recent years have suffered tremendous loss. The most important of the causes of deforestation are immediate causes and underlying causes because the agent never cleared more forest if there are no immediate and underlying causes.
Keywords: Deforestation, satellite imagery, socio-economic survey, Sumatra
BACKGROUND
Tropical deforestation constitutes one of the greatest threats to conservation of Bukit
Barisan Selatan National Park (BBSNP) as the third-largest protected area on the Sumatra
Island. UNFCCC (2007) declare that the international community faces the urgent task to
reduce tropical deforestation as one of a suite of measures to reduce global warming and
maintain biological diversity. One of many responses of conservation biologist to this threat
has been to develop an array of tools for measuring and monitoring deforestation, many of
which use remotely sensed data collected by satellites (Saatchi et al. 2001). Satellite-based
datasets can provide fine-scale measures of deforestation rates, however many aspects related
deforestation with social phenomena such as what drives people to clear more tropical forest
cannot be measured using satellite sensor (Turner et al. 2001). Therefore, approaches that
important to understand trends and the causes of deforestation. Most of the studies linking
remote sensing observations and socio-economic data have been undertaken at the scale of
the administrative units (Wood & Skole 1998). Mertens et al. (2000) integrate remote sensing
and household survey to understand the impact of macroeconomic change on deforestation in
South Cameron.
Bukit Barisan Selatan National Park is good example for dramatic loss of tropical
forest in Indonesia because this park contains some of the largest tracts of tropical forest
remaining on Sumatra. Although BBSNP was declared as a World Heritage site by UNESCO
(decision 28COM 14B.5), however in the past decade BBSNP’s forest cover has declined
dramatically. Much of the forest cover in BBSNP has been cleared since the early 1970s but,
accurate estimates of the scale and rates of loss are lacking. Kinnaird et al. (2003) found that
between 1985 and 1999 the Park lost more than 661 km2 of forest (28%). Gaveau et al. (2007)
showed that the average rate of deforestation from 1972 to 2002 in an area of 1.17 million ha
in southwest Sumatra that includes BBSNP is 1.69% per year.
In addition, Bukit Barisan Selatan National Parks is also perfect example for the
complex causes of deforestation. BBSNP has bordering area about 700 km, the parks is
bordered by villages, agriculture, and plantation forestry (Kinnaird et al. 2003). The highly of
interaction and conflict between human and wildlife and also between local people and the
government in the bordering area of BBSNP may drive humans go inside park (they clear
more tropical forest) and wildlife go outside borders. Kusworo (2000) and Verbist et al.
(2004) noted that conflict over land ownership between Lampung-based local groups and the
government and conflicts among government institutions have promoted further
deforestation.
The dramatic loss of forest cover is attributed to variety of factors, including illegal
logging, legal concession (legal logging), conversion to agriculture (by opportunistic settlers
and those arriving through Indonesia’s official transmigration program), development of
estate crops, and forest fires (Sunderlin et al. 2001; Suyanto et al. 2000; Holmes 2002).
However, information about causes of deforestation in Bukit Barisan Selatan National Park is
lacking. Gaveau et al. (2009) reports coffee prices, law enforcement, and rural poverty is the
primary causes of deforestation in southwest Sumatra included BBSNP. Suyadi & Gaveau
(2007) studied in small area (Pemerihan) part of the BBSNP show that the cause of
deforestation is illegal logging.
Here, I integrate time series satellite imagery, historical record, and socio-economic
unravel the causes of deforestation. I documented the extent of deforestation in BBSNP from
1972 to 2006 and examined what drives people to clear more tropical forest in BBSNP.
Finally, BBSNP’s forest is home to some of the world’s most endangered large mammals and
also the major watershed for southwestern Sumatra which must conserve for future.
STUDY AREA
Bukit Barisan Selatan National Park (BBSNP) is the third-largest protected area (356.800 ha)
on the Indonesian island of Sumatra (Fig. 1). Located in southwestern portion of the island
(4o 31’ to 5o 57’ S and 103o 34’ to 104o 43’ E), it is a part of the provinces of Lampung and
Bengkulu. The park extends 150 km along the Bukit Barisan mountain range, and is
composed of diverse topography that ranges from coastline in the south to mountainous forest
in the north. Rainfall is seasonal, ranging from 3,000 mm to 4,000 mm, and temperatures
fluctuate between 22oC and 35oC. The park is narrow in shape, with a perimeter > 700 km in
length, and is bordered by villages, agriculture, and plantations (Kinnaird et al. 2003).
Encroachment for agriculture and illegal logging are rife in BBSNP. Forest loss becomes the
greatest threats to conservation of Bukit Barisan Selatan National Park.
[image:3.595.75.524.421.663.2]METHODS
Satellite-based Estimates of Deforestation
I applied the processing method which used by Gaveau et al. (2007) for generating
forest maps and assessing their accuracy. To detect forest change across Bukit Barisan
Selatan National Park, I acquired Landsat MSS (1972), Landsat MSS (1978), Landsat MSS
(1985), Landsat TM (1997), Landsat TM (2000), and Landsat ETM+ (2006), all image had
cloud cover less than 2.0%. Landsat ETM+ (2006) scene was geo-referenced to topographic
maps and also checked to the ground with Ground Control Points (GCPs) collected in the
field by the Wildlife Conservation Society (WCS) using Global Positioning System (GPS).
All data were projected to the Universal Transverse Mercator (UTM) projection, Zone 48
South. The other scenes were matched with 2006 scenes in x-and y through a second order
polynomial co-registration technique (Schowengerdt, 1997). The spatial precision of
geo-referenced was smaller than one pixel.
Forest and non-forest was identified using band 5, 4, and 3 for the TM and ETM+
data and band 4, 3, and 2 for the MSS data. Six land-cover types were distinguishable on the
images: forest (≥50% of closed-canopy tree cover) and non-forest comprised agricultural
areas, grasslands, village enclave, and unknown, non-forested types. To generate a
classification of the study area into one forest type and one non-forest type I used a
Maximum Likelihood Classification (MLC) algorithm (Schowengerdit, 1997). I edited
classification results manually by on-screen digitization especially in areas where the MLC
algorithm often produces misclassification errors. Logging trails network was manually
interpreted through on-screen digitization.
I used NASA SRTM Digital Elevation Model (DEM) to categorize forest types by
elevation and slope. Elevation was categorized into four classes: lowland: 0-500m; hill:
500-100m; lower montane: 1000-1500m; and upper montane: 1500-2200m asl. BBSNP boundary
was obtained from the BBSNP Office at a scale of 1:25,000, and corrected in the field with
GPS, by a team from BBSNP Office, WCS, and World Wildlife Fund (WWF).
I applied the processing method which used by Kinnaird et al. (2003) to estimate
deforestation rate, where rate of forest loss were calculated as the slope of the regression line
between image years for a given slope/elevation class. Using these slope, I calculated time to
extinction for each elevation/slope class by solving the regression equation when forest area
equaled zero (0 = 1972 forest area – regression slope*years to extinction). I then subtracted
34 years to estimate years to extinction from 2006. I calculated the probability of losing forest
elevations and slopes. I also assessed deforestation patterns in relation to distance from
logging trails.
Defining Zones of High and Low Law Enforcement
Zones of high and low law enforcement inside the BBSNP were identified based on:
(i) ecological data; socio-economic survey and interviews with BBSNP staff; and (iii)
modeling spatial accessibility that modified from Gaveau et al. (2009).
Ecological data
Encroachments into BBSNP to be grouped into “active” or “inactive” based on
whether they had been expanded the area of encroachment. Field survey revealed extensive
re-growth over previously cleared forest areas in ‘inactive’ encroachments, but not in ‘active’
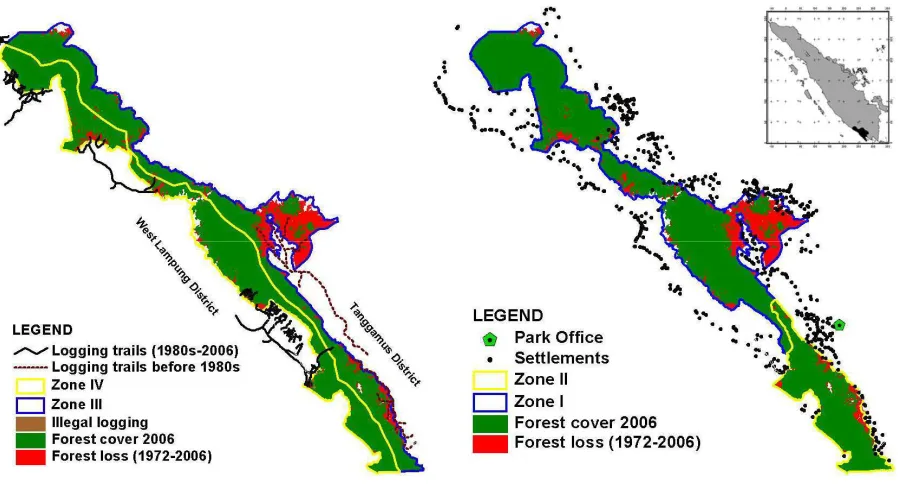
encroachments (Gaveau et al. 2007). Based on this turn, BBSNP to be sub-divided into two
distinct zones, of no re-growth (Zone I = 245,500 ha) southern of park and of re-growth (zone
II = 79,000 ha) northern of park (Fig. 1).
I assume that law enforcement has caused re-growth, while park staff focused
enforcement efforts on zone II because zone I is too remote from the Park Headquarter, zone
I may be assigned the zone of low law enforcement, while zone II may be assigned the zone
of high law enforcement. Conversely, if remoteness rather than law enforcement has caused
growth in zone II because farmers preferably convert forest in zone I have caused
re-growth in zone I, geographic accessibility may confound the assessment of law enforcement.
Interviews and socio-economic survey
There is no quantitative records of past law enforcement effort in BBSNP. Four
long-term staffs who had worked in BBSNP since 1980s were interviewed to delong-termine when and
where law enforcement operation had taken place in BBSNP. The interview results were
cross-checked the results with independent socio-economic survey of 1000 farmers, among
whom the survey attempted to locate as many evicted farmers as possible.
Modeling spatial accessibility
Detailed modeling spatial accessibility in BBSNP has been described previously
(Gaveau et al. 2009). The model showed that zone II has remained more accessible to
BBSNP staff than zone I. Mann-Whitney U tests were used to compare the mean travel times
respectively. Mean travel time values were extracted for 300 randomly selected points on
zone I as having been cleared and 100 randomly selected points on zone II.
Defining Zones of High and Low Pressure
In addition, I also separate BBSNP area into two different zones, of high pressure
(zone III = 178,000 ha) eastern of park and low pressure (zone IV = 178,800 ha) western of
park (Fig. 1). Zone III and IV were identified based on ecological data and population density
and economic growth.
Ecological data
The ecological data that used to identify zone III and IV is encroachments data in
BBSNP. The ecological data showed that encroachment in zone III is higher than zone IV.
There was no spatial overlap between encroachments, all of which were in the western
section of BBSNP, and encroachments, all found in the eastern of BBSNP. The higher
encroachment (zone III) may be assigned the zone of high pressure, while zone III may be
assigned the zone of low pressure.
Population density and economic growth
One of the main underlying factors to the deforestation that I see at BBSNP is the
human population increase. Lampung province grows at 2.5% every year from Javanese
transmigrants. They bring with them a set of cultural and resource use practices that
undoubtedly have an impact on the local ecology. Sunderlin et al. (1996) explained data on
population density by district in Indonesia show a strong inverse relationship with forest
cover change. There is no doubt a growing human presence in rural Indonesia has a role in
deforestation. Fraser (1996) states that for every 1% increase in population, there is an
approximate decrease of forest cover of 3%. Human population density around BBSNP’s
zone III of BBSNP in 2007 was 246 people per km2 higher than zone IV (78 people per km2).
Human population growth around zone III between 2003 and 2007 was (5,070 people per
year) also higher than zone IV (1,147 people per year). Based on this data I assume that zone
III of BBSNP area has higher pressure from the human population than zone IV, for the
reason that land scarcity thus they go inside the park.
I assembled time-series data of economic growth rate (PDRB) between 2003 and
2007 from Lampung Central Bureau of Statistics (BPS) for districts around zone III and zone
IV. Time-series data showed that during 5 years (2003-2007) the economic growth rate in the
IV (West Lampung district) that only 11.32%. Scientists believed that economic growth rate
is the fundamental explanation for deforestation in Indonesia (Sunderlin et al, 1996). Here, I
believe that zone III of BBSNP has greater pressure from the economic growth of Tanggamus
district and zone IV has less pressure because the economic growth rate in West Lampung
district lower than Tanggamus.
Socio-economic surveys
I and team interviewed farmers in the national languages Indonesia and local
languages Javanese and Lampungnese. The survey questions were semi-structured with a standardized questionnaire to interview villagers and mainly open and close-ended. Before
interviewing, I conducted a group discussion (focus group) in each village to understand the
specific characteristic of local society. In order to avoid reticence, especially in areas where
conflicts with park management are frequent, I started the interviews with non-sensitive
questions about conservation in general, progressively zooming in on conservation areas, and
finally on Bukit Barisan Selatan National Park.
I conducted the first survey from August to September 2006, and interviewed 200
farmers from 6 villages in and around BBSNP. The second survey was conducted in 2007, I
and team interviewed 600 farmers from 11 villages inside and around BBSNP. We
interviewed 48-85% of all farmers in each village. Total respondents that were interviewed
are 800 farmers from 17 villages. All villages are in rural areas located inside BBSNP or on
the boundary of BBSNP included enclave of park.
Coffee price time-series and historical records
I assembled time-series statistics on annual international (in US dollars) and local (in
Indonesian Rupiah, Rp) robust coffee price from the International Coffee Organization (ICO)
indicator price reports and from the Indonesian Bureau of Statistics. I used coffee price
time-series data from 1972 to 2006. The local price time-time-series was deflated by the southern
Sumatra Consumer Price Index (CPI, 2006=100) to account for the growth of local consumer
prices and agricultural input prices over time.
I used local and national historical records about government policies,
socio-economic, law enforcement included eviction, timber concessions (legal logging), and illegal
logging. Historical records collected from BBSNP office, the Directorate General of Forest
RESULT
Deforestation in Bukit Barisan Selatan National Park
The result of socio-economic survey show deforestation in Bukit Barisan Selatan
National Park (BBSNP) was started in 1960s. The image analysis support this finding which
show that before 1972 the forest cover of BBSNP has been lost of 46.100 ha, representing a
13% loss from the area of the BBSNP (356.800 ha). From 1972 until 2006, deforestation in
the BBSNP averaged 0.64% per year. The forest cover of BBSNP 67,225 ha of the original
forest of 310,670 ha that remained in 1972, representing a 21% loss from 1972 to 2006 (Fig.
1). The image analysis indicates that the majority (80%) of forest conversion resulted from
agricultural development and started from the buffer area of BBSNP goes inside the park.
Forest covers in 10-km buffer have reduced by 113,105 ha, representing 62% loss of forest
cover, at an average rate of 2.13% per year. In the last decade (1997-2006), after Asian
economic crises, deforestation rate in BBSNP increase dramatically 13.00% per year,
compare with the deforestation rate in the two first decades (1972-1996) are 9.09% per year.
The agents that have physical role in forest cover change is farmers, this agent operate
in same or separate locations and to have little contact with one another. In the two first
decades (1970s-1996), large-scale loggings (legal logging/legal concession) were a “cause”
of deforestation and farmers merely fill a “vacuum” created by the loggers, in those areas
where this sequence takes place. Thus, legal loggings were immediate causes of forest cover
change where opened relative access to resources such as logging trails for agents. In the last
decades (1997-2006), the immediate causes has become two major factor driving agricultural
encroachment are illegal logging spurred faster deforestation in southern of BBSNP and high
coffee price spurred faster deforestation in northern of BBSNP. The underlying causes of
forest cover change in BBSNP are low law enforcement and socio-economic condition. The
underlying causes are the decision parameters that have a direct influence on the behavior of
the immediate causes; and the immediate causes have direct influence on the behavior of the
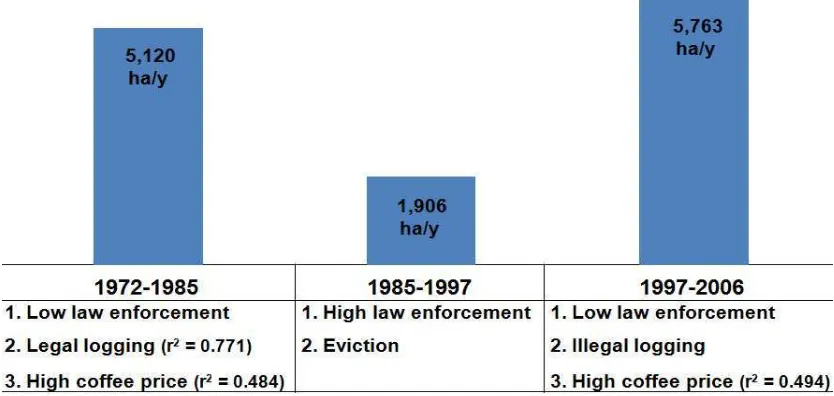
agent to encroach BBSNP’s forest. Figure 2 shows the trend of deforestation in BBSNP and
the causes of deforestation (1972-1985 and 1997-2006) and the causes of deforestation
Fig. 2-The trend and the causes of deforestation increasion and reduction
Pattern and Causes of Deforestation in Zones I and II
The forest loss rate in Zone II is lower than Zone I (β = -1130.3, F1,20=9.07, P=0.008).
Throughout the 1980s and until 1997 deforestation rates in zone II have been negligible as
strong law enforcement measures were adopted by the Government to protect the biodiversity
during the implementation of Indonesia’s first land use plan (TGHK). Based on interview
data with four long-term BBSNP staff, they claimed to have patrolled Zone II extensively,
evicted all illegal farmers and removed at least 1000 farmers from BBSNP’s southern
peninsular. Among 1000 farmers interviewed along BBSNP boundary, 247 farmers included
my family claimed to have been previously evicted, and >98% of recorded evictions occurred
inside Zone II from 1982-1987. These observations support assigning Zone II as high law
enforcement.
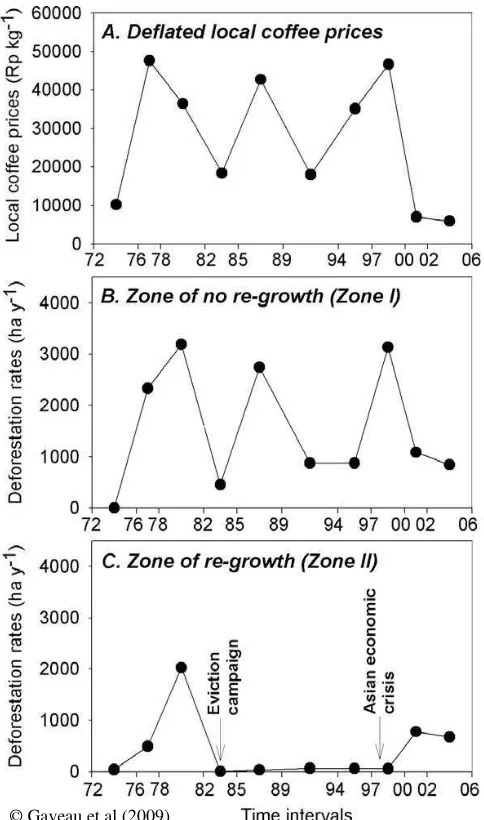
To understand the causes of deforestation in Zone I and II, I use data which I
assembled from the Indonesian Bureau of Statistics (Gaveau et al, 2009) (Fig. 3). A linear
regression model showed that local coffee price and the fixed factor for Zones I and II both
closely predicted deforestation rates inside BBSNP (F2,20 = 7.501, P = 0.005, r2 = 0.471).
Thus, higher local coffee prices spurred faster deforestation (β = 0.030, F1,20=5.811,
P=0.028), a periodic effect that was especially noticeable in Zone I. Furthermore, Zone I as low law enforcement, long-term BBSNP staff claimed not have intensively patrolled Zone I,
on average 3.5 times more remote (Mann Whitney U test: Z = -14.9, P<0.001) from
BBSNP Headquarter, with staff travel time of 22.45 ± 7.37 h, than Zone II, with a travel time
Fig. 3-Time-series showing (A) deflated (CPI, 2006 = 100) maximum annual local coffee price, (B) deforestation rates inside BBSNP’s zone I, and (C) deforestation rates inside BBSNP’s zone II.
Pattern and Causes of Deforestation in Zones III and IV
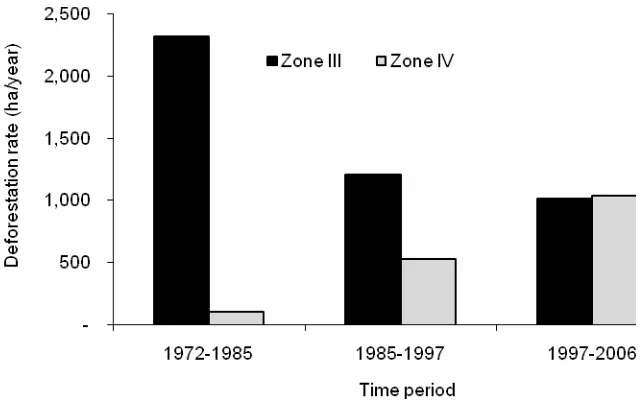
Image analysis indicates that there are difference pattern of deforestation between
zone III and zone IV. In the zone III, the higher rates of forest loss occurred from 1972 to
1985 (2,321 ha/year), but decreased gradually in the next decades at averaged 1,209 ha per
year in 1985-1997 and 1,020 ha per year in 1997-2006 (Fig. 4). On the contrary, the higher
rates of forest loss in the zone IV occurred from 1997 to 2006 (1,040 ha/year). The slowest
[image:10.595.178.420.69.479.2]Fig. 4-Deforestation trends in BBSNP’s zone III and BBSNP’s Zone IV
A logistic regression model showed one of the other independent variables that had
highly correlation with forest loss in Zone III between 1972 and 1985 is logging trails (P =
0.005, r2 = 0.771). The averaged of forest cover loss which closer to logging trails (0-25 km)
at average of 910 ha per year, compared with 280 ha/year on the forest that remote from
logging trails (>25 km) (Fig. 1). These logging trails were developed by legal loggings since
1970s. The second independent variables that have high correlation with forest loss in Zone
III between 1972 and 1985 is local coffee price (P = 0.005, r2 = 0.484).
Deforestation reduction between 1985 and 1997 in Zone III is the effect of high law
enforcement and eviction from 1982 to 1987 and deforestation reduction between 1997 and
2006 caused by topography condition, where lowland forest disappeared faster than
hill/montane forest. Image analysis result showed lowland forest disappeared at the rate of
1,200 ha per year, compared with 265 ha per year in hill/montane forest. On relatively flat
slopes (0-20°), forest loss averaged 850 ha/year but dropped to 50 ha/year on the steepest
slopes (>40°).
Legal logging around Zone IV that started in 1970s spurred faster deforestation in
Zone IV that occurred between 1972 and 1996 (P = 0.005, r2 = 0.798). Since 1997,
deforestation rates in Zone IV increased again caused by high local coffee price (P = 0.005, r2
= 0.494) after Asian economic crises. In addition, result from socio-economic survey showed
IV since 1997. While illegal logging itself has caused very limited damage to the forest, this
illegal activity sparked a land race among farmers inside the park.
DISCUSSION
Kinnaird et al. (2003) reports deforestation in Bukit Barisan Selatan National Park
(BBSNP) has been started in 1985, in other hand Gaveau et al. (2007) showed that in 1972
deforestation in BBSNP has been started. However, this research shows that deforestation in
BBSNP has been started since 1960s. Estimates of the area of annual average deforestation in
BBSNP are also vary widely, ranging from a low of 0.63% per year (Gaveau et al. 2007) to a
high of 2.0 % per year (Kinnaird et al. 2003). The result of this study show deforestation rate
in BBSNP between 1972 and 2006 is 0.64% per year.
The information of the causes of deforestation in Bukit Barisan Selatan National Park
is lacking. The detail study on small part of BBSNP conducted by Suyadi & Gaveau (2007)
show that the internal factor that spurred farmers cleared forest is land scarcity, however the
major factor driving agricultural encroachment is illegal logging and low law enforcement.
Gaveau et al. (2009) reports law enforcement, coffee price, and rural poverty have effect to
driving deforestation. This research show that the causes of deforestation in BBSNP are
complex, it is possible for various kinds of causes can be spurred deforestation in the same
location. It is also possible for causes can be spurred deforestation in the specific location and
in certain time.
The high law enforcement in the early 1980s in BBSNP greatly reduced deforestation
especially in the southern of BBSNP. This result suggest that law enforcement is necessary to
safeguard the integrity of BBSNP from farmers (smallholders) who would otherwise clear
forest for agricultural, Keane et al. (2008) suggesting that law enforcement interventions are
also necessary to protect endangered species. In addition, this research shows that the effects
of high law enforcement can persist for several years after law enforcement activities have
ended, as with claims made for large mammals (Neumann, 2001). Law enforcement is also
important to reduce illegal logging activities (Suyadi & Gaveau, 2007) and to control people
goes inside the park for clear forest or to hunting (Wibisono, 2006).
The second way to reduce deforestation inside BBSNP and to increase farmers’
income is certification of origin for sustainable robust coffee. WWF (2007) has recently
urged major coffee buyers and roasters to adopt certification of origin around BBSNP. An
important criterion for defining this criterion is fraught with difficulty because coffee buyers
from following growing practices within protected area. Equally, price premiums may
encourage fraud within the coffee trade, given difficulties in differencing between out-park
and in-park grown coffee beans (WWF, 2007).
The third effort to reduce deforestation and increase wages lies in national economic
development. Better paid off-farm employment, sustained by more off-farm work
opportunities in urban areas, with improved levels of rural education. Assistance for rural
communities around forest especially guidance for farming practice and household economic
management is important to increase their knowledge in manages their income.
This paper was opened our eyes that BBSNP forests have suffered tremendous loss in
recent years. The findings have important input for the next research to explore deeper about
deforestation in BBSNP. The most important tools that needed by BBSNP officer is the new
accurate maps of BBSNP maps and deep understanding the root causes and the effect of
deforestation to population of endangered mammals such us Sumatran tigers. To fulfill its
needed we must conduct the research on the deforestation using recent satellite images link
with household survey and biological survey.
CONCLUSION
Deforestation is the most important of greatest threats to conservation of Bukit Barisan
Selatan National Park. Every year forest cover of Bukit Barisan Selatan National Park has
been lost and in the recent decade deforestation rate increased dramatically. The causes of
deforestation in Bukit Barisan Selatan National Park are complex and specific in the certain
location and time. The most important of the causes of deforestation are immediate causes
and underlying causes because these causes can triggers of agents to cleared more tropical
forests.
RECOMMENDATION
Four recommendations to reduce deforestation in Bukit Barisan Selatan National Park:
1. Strong law enforcement to protect Bukit Barisan Selatan National Park
2. Certification of origin for sustainable robust coffee
3. Open more off-farm work opportunities for rural communities
4. Produce the new accurate maps of Bukit Barisan Selatan National Park and deep
ACKNOWLEDGMENT
The research was funded by the Russell E. Train Education for Nature Program World
Wildlife Fund and the Royal Geographical Society (with IBG) with a Royal Dutch Shell plc
International Leadership and Capacity Building Programme Bursary. I thank Wildlife
Conservation Society-Indonesia Program, David Gaveau, field team of socio-economic
survey, and all respondent for the great information.
REFERENCES
Fraser, A. I. 1996. Social, economic and political aspects of forest clearance and land-use planning in Indonesia. Unpublished manuscript.
Gaveau, D.L.A., M. Linkie., Suyadi., Patrice Levang., N.L. Williams., 2009. Three decades of deforestation in southwest Sumatra: Effects of cofee prices, law enforcement and rural poverty. Biological Conservation xxx (2009) xxx-xxx
Gaveau, D.L.A., Wandono, H., Setiabudi, F., 2007. Three decades of deforestation in southwest Sumatra: have protected areas halted forest loss and logging, and promoted re-growth? Biological Conservation 134: 495–504.
Holmes, D. A. 2002. The predicted extinction of lowland forests in Indonesia. Pages 7–13 in E. Wickramanayake, E. Dinerstein, C. J. Loucks, D. M. Olson, J. Morrison, J. Lamoreux, M. McKnight, and P. Hedao, editors. Terrestrial ecoregions of the Indo-Pacific: a conservation assessment. Island Press, Washington, D.C.
Keane, A., Jones, J.P.G., Edwards-Jones, G., Milner-Gulland, E.J., 2008. The sleeping policeman: understanding issues of enforcement and compliance in conservation. Animal Conservation 11: 75–82.
Kinnaird, M.F., Sanderson, E.W., O’Brien, T.G., Wibisono, H.T., Woolmer, G., 2003. Deforestation trends in a tropical landscape and implications for endangered large mammals. Conservation Biology 17: 245–257.
Kusworo, A. 2000. Perambah hutan atau kambing hitam? Potret sengketa kawasan hutan di Lampung. Pustaka Latin, Bogor.
Mertens, B., W. D. Sunderlin, and O. Ndoye. 2000. Impact of macroeconomic change on deforestation in South Camerron: Integration of household survey and remotely-sensed data. World Development 28: 983-999.
Neumann, R.P., 2001. Disciplining peasants in Tanzania: from state violence to self-surveillance in wildlife conservation. In: Peluso, N.L., Watts, M. (Eds.), Violent Environments. Cornell University Press, Ithaca.
Schowengerdt, R.A., 1997. Models and Methods for Image Processing. Academic Press, London.
Sunderlin, W. D., A. Angelsen, D. P. Resosudarmo, and A. Dermawan. 2001. Economic crisis, small farmer well-being and forest cover change in Indonesia. World Development 29: 767-782.
Sunderlin, W. D., and I. A. P. Resosudarmo. 1996. Rates and causes of deforestation in Indonesia: towards a resolution of the ambiguities. Occasional Paper No.9. Center for International Forestry Research, Bogor.
Suyadi, and D.L.A Gaveau, 2007. Akar Penyebab Deforestati di Sekitar Sungai Pemerihan Perbatasan Taman Nasional Bukit Barisan Selatan, Lampung Barat. Berita Biologi 8(4): 279-290
Suyanto, S., R. A. Dennis, I. Kurniawan, F. Stolle, P. Maus, and G. Applegate. 2000. The underlying causes and impact of fires in South-east Asia. Site 1. Sekincau, Lampung Province, Indonesia. CIFOR, ICRAF and USFS, Bogor, Indonesia.
Turner, W., E. J. Sterling, and A. C. Janetos. 2001. Contributions of remote sensing to biodiversity conservation: a NASA approach. Conservation Biology 15: 832–834.
UNFCCC, 2007. Decision2/CP.13: Reducing emissions from deforestation in developing countries: approaches to stimulate actions. In: United Nations Climate Change Conference. Bali, Indonesia.
Verbist, B., and G. Pasya. 2004. Perspektif sejarah status kawasan hutan, konflik dan negosiasi di Sumberjaya, Lampung Barat-Propinsi Lampung. Agrivita 26: 20-28.
Wibisono, H. T. 2006. Population Ecology of Sumatran Tigers (Panthera tigris sumatrae) and Their Prey in Bukit Barisan Selatan National Park, Sumatra, Indonesia. A Master of Science Thesis at University of Massachusetts.
Wood, C. H., and D. Skole. 1998. Linking satellite, census and survey data to study deforestation in the Brazilian Amazon. Pages 70-93 in D. Liverman, E. F. Moran, R. R. Rinduss, and P. C. Stern, editors. People and pixels: linking remote sensing and social science. National Academy Press, Washington, DC.