MODELING RISK CLUSTER BASED ON SENTIMENT
ANALYSIS IN BAHASA INDONESIA FOR SME BUSINESS
RISK ANALYSIS DOCUMENTS
IRFAN WAHYUDIN
GRADUATE SCHOOL
BOGOR AGRICULTURAL UNIVERSITY
BOGOR
DECLARATION OF ORIGINALITY
AND COPYRIGHT TRANSFER*
I hereby declare that the thesis entitled Modeling Risk Cluster based on Sentiment Analysis in Bahasa Indonesia for SME Business Risk Analysis Documents is my own work and to the best of my knowledge it contains no material previously published in any university. All of incorporated originated from other published as well as unpublished papers are stated clearly in the text as well as in the references.
Hereby, I state that the copyright to this paper is transferred to Bogor Agriculture University.
Bogor, June 2015
SUMMARY
IRFAN WAHYUDIN. Modeling Risk Cluster Based on Sentiment Analysis in Bahasa Indonesia for SME Business Financing Risk Analysis Documents. Supervised by TAUFIK DJATNA and WISNU ANANTA KUSUMA.
Currently, there are two risk analysis models that commonly used for business financing in banking industry, namely, the quantitative model and the qualitative model. The quantitative model are mostly implemented as an credit scoring system that consists of several accounting formulation that calculates the financial statement and business performance to determine the feasibility of bank customers in accepting loan. The second model, namely qualitative model, emphasizes the risk analysis, opinion, and mitigation from risk analyst to support the decision makers in accepting loan proposal.
From the observation through the Standard Operating Procedure (SOP) the quantitative model has some drawbacks in measuring the acceptance criteria, since the data are originated from the customer itself and vulnerable to have a manipulation, especially when the financial statement has no any inspection from external auditor. The second drawback is that the quantitative model tend to be subjective since the credit scoring calculation are performed by the marketing staff that stand sides to the customer. Hence, the qualitative model are deployed to overcome these drawbacks, where the analysis is objectively proceed by risk analysts. However, the implementation of qualitative model are not a hundred percent perfect, since the qualitative model neither has decision criteria nor risk measurement. Another issue is that the risk analysis documents that consist of risk opinion and mitigation from previous analysis, are not well managed. Actually, these documents are useful for the risk analyst to evaluate and relearn from the previous analysis.
In this research, the opinion or sentiment analysis against the risk analysis documents is conducted by modeling the risk cluster to help the risk analyst in refine the analysis. There are three tasks that have been conducted, those are clustering the risk analysis documents based on the term presence. Secondly is quantify the risk level within each cluster by measuring the term importance and sentiment score using TF-IDF and SentiWordNet 3.0 respectively. The task is eventually finished by evaluating the cluster quality using Silhouette function and examining the most frequent terms by its importance and sentiment. We also develop a prototype that enables risk analysts to retrieve the risk analysis documents by entering query terms and presents the level of risk from each document. The results has been shown that sentiment mining technique is effective and could be utilized to model risk cluster. This could be seen in how relevant is the cluster model with the 5Cs Credit criteria that commonly used in banking industry. In discussion, there are also some suggestions for the management on what criteria they should resharpen in conducting the qualitative model. By giving the risk score in each cluster, it is expected that the model also could be used as a benchmark to qualify the submitted loan proposal and assist the decision maker to have a better decision making.
RINGKASAN
IRFAN WAHYUDIN. Pemodelan Klaster Risiko Berdasarkan Analisis Sentimen dalam Bahasa Indonesia pada Dokumen Analisa Risiko Pembiayaan Bisnis UMKM. Dibimbing oleh TAUFIK DJATNA dan WISNU ANANTA KUSUMA.
Saat ini, terdapat dua model analisa risiko yang umum digunakan untuk pembiayaan bisnis pada industri perbankan, yaitu, model kuantitatif dan model kualitatif. Model kuantitatif paling banyak diimplementasikan dalam bentuk sistem skoring kredit yang terdiri atas beberapa formula akuntansi yang menghitung laporan keuangan dan performa bisnis dari nasabah untuk menentukan feasibilitas dalam menerima fasilitas pinjaman. Adapun model kualitatif, menitikberatkan pada analisa risiko, opini, dan mitigasi dari analis risiko untuk mendukung pengambil keputusan dalam menyetujui proposal pinjaman.
Dari observasi terhadap Standar Operasional dan Prosedur (SOP) model kuantitatif memiliki beberapa kekurangan dalam menghitung kriteria persetujuan, dikarenakan data berasal dari nasabah itu sendiri dan rentan manipulasi, terutama untuk laporan keuangan yang tidak diaudit oleh audit eksternal. Kekurangan kedua adalah, model kuantitatif cenderung subjektif, dikarenakan perhitungan skoring kredit dilakukan oleh staf pemasaran yang sedikit banyak mempunyai keberpihakan kepada nasabah. Untuk itu, model kualitatif diimplementasikan untuk mengatasi kekurangan-kekurangan ini, di mana analisa dilakukan secara objektif oleh analis risiko. Bagaimanapun, implementasi dari model kualitatif ini, masih belum berjalan sempurna, dikarenakan model ini belum mempunyai kriteria pengambilan keputusan ataupun perhitungan tingkatan risiko. Masalah lain adalah dokumen analisa risiko yang terdiri atas opini dan mitigasi risiko dari pengajuan sebelumnya masih belum dikelola dengan baik. Dokumen-dokumen ini dapat berguna bagi analis risiko untuk mengevaluasi dan mempelajari analisa sebelumnya.
Pada penelitian ini, analisa sentimen terhadap dokumen analisa risiko dilakukan dengan memodelkan klaster risiko untuk membantu analis risiko dalam melakukan analisa. Terdapat tiga pekerjaan yang dilakukan, yang pertama adalah mengklaster dokumen analisa risiko berdasarkan kemunculan kata. Kedua adalah mengkuantifikasi tingkatan risiko di dalam tiap klaster dengan mengukur tingkat kepentingan kata dan skor sentimen menggunakan TF-IDF dan SentiWordNet 3.0. Selanjutnya diakhiri dengan evaluasi kualitas klaster menggunakan fungsi Silhouette dan mengukur tingkat kepentingan dan sentimen dari kata yang sering muncul. Sebuah prototipe aplikasi juga dibangun untuk mengunduh dokumen berdasarkan kata pencarian dan menampilkan dokumen terkait dengan level risikonya. Hasil dari penelitian menunjukkan teknik sentiment mining efektif dan dapat digunakan untuk memodelkan klaster risiko. Hal ini dapat dilihat dari relevansi model klaster dengan kriteria 5C Kredit yang umum digunakan pada industri perbankan. Pada bagian diskusi, terdapat beberapa saran untuk manajemen terkait kriteria analisa risiko yang harus dipertajam dalam implementasi model kualitatif. Skor risiko pada tiap klaster dapat digunakan sebagai tolak ukur untuk mengkualifikasi proposal dan membantu dalam mengambil keputusan.
© Copyrights IPB, 2015
Copyrights Protected by Law
No part or all of this thesis may be excerpted without or mentioning the sources. Excerption only for research and education use, writing for scientific papers,
reporting, critical writing or reviewing of a problem. Excerption doesn’t inflict a
financial loss in the paper interest of IPB.
Thesis
As partial fulfillment of the requirements for the Degree of Magister of Computer Science
in Computer Science Study Program
MODELING RISK CLUSTER BASED ON SENTIMENT
ANALYSIS IN BAHASA INDONESIA FOR SME BUSINESS
RISK ANALYSIS DOCUMENTS
GRADUATE SCHOOL
BOGOR AGRICULTURAL UNIVERSITY
BOGOR
2015
Title : Modeling Risk Cluster based on Sentiment Analysis in Bahasa Indonesia for SME Business Risk Analysis
Documents
Name : Irfan Wahyudin Student Id : G651130734
Approved by
Supervision Commissioner
Dr Eng Taufik Djatna, STp MSi Chairman
Dr Eng Wisnu A Kusuma, ST, MT Member
Acknowledged by
Head of Dept. Computer Science Graduate Program
Dr Eng Wisnu A Kusuma ST, MT
Dean of Graduate School
Dr Ir Dahrul Syah, MSc Agr
PREFACE
Alhamdulillah, the author praise to Allah Subhanahu Wa Ta’ala, The Almighty Lord, without His blessing and favour, this research would not be completed.
I would like to thank Dr Eng Taufik Djatna S Tp, MSi and Dr Eng Wisnu Ananta Kusuma ST MT, who have given insight and suggestion for the completion of this thesis book. This research was conducted in one of national private bank in Indonesia during December 2014 until May 2015, entitled Modeling Risk Cluster Based on Sentiment Analysis in Bahasa Indonesia for Small Medium Enterprise Business Financing Risk Analysis Documents. I also would like to appreciate the Risk Management Division from the bank where this research was taken place, for the knowledge sharing and for allowing the author using the risk analysis documents as a research sample. Also, thank you for all of the love, support and prayer of my father, my mother, my wife, my child, and all of family’s member.
Hopefully, this research will brings many of benefits and has a contribution to science.
Bogor, June 2015
TABLE OF CONTENTS
LIST OF TABLES vii
LIST OF FIGURES vii
LIST OF APPENDIXES viii
1 INTRODUCTION 1
Background 1
Problem Statements 3
Objectives 3
Benefits 3
2 LITERATURE REVIEW 4
Risk Clustering 4
Sentiment Analysis 4
Part of Speech Tagging 6
Singular Value Decomposition (SVD) 6
Term Frequency-Inverse Document Frequency 8
K-Means Clustering 8
Centroid Optimization using Pillar Algorithm 8
Cosine Similarity 10
Cluster Evaluation using Silhouette Function 10
3 METHODS 11
Research Framework 11
Parsing The Risk Opinion from The Documents 12
POS Tagging and Term Tokenization 13
Singular Value Decomposition 14
Risk Documents Clustering 15
Term Frequency-Inverse Document Frequency 17
Translating SentiWordNet 17
Sentiment Scoring 19
Equipments 20
4 RESULTS AND DISCUSSIONS 20
Risk Analysis 20
Preprocessing 21
Parsing The Documents 21
Part of Speech Tagging 21
Dimension Reduction using SVD 22
Risk Clustering 22
Optimizing Centroid 23
Risk Measurement 24
Sentiment Weighting 26
Evaluation 27
Silhouette Performance 27
Sum of Squared Error 30
Risk Cluster Analysis 30
Loan Proposal Documents Assesment 31
5 CONCLUSIONS AND RECOMMENDATIONS 34
Conclusion 34
Recommendation 35
REFERENCES 35
LIST OF TABLES
Table 1 Term-document matrix representation 7
Table 3 A matrix of term-document illustration 14
Table 2 POS Tag transformation between tags in SentiWordNet and tags
in POS Tag API 21
Table 4 The best cluster solution based on the Silhouette score 28 Table 5 List of the SSE of first top 5 cluster solution for k = 6, and the best
cluster solution 30
Table 6 Risk cluster analysis and its corresponding 5Cs criteria 31
LIST OF FIGURES
Figure 1 Brief workflows of SME financing Standard Operating Procedur 2 Figure 2 Sentiment analysis research method (Medhat and Hasan 2012) 5 Figure 3 Complete steps of Pillar Algorithm (Barakbah 2009) 9
Figure 4 An example of risk analysis document 11
Figure 5 Research Famework 12
Figure 6 A snapshot from table mst_opini_mitigasi_raw 13 Figure 7 An example of content from the f_wordlist file 14 Figure 8 Workflow of Clustering process using K-Means Clustering that
optimized by Pillar Algorithm and evaluated by Silhouette function
and SSE 15
Figure 9 Pseudocode of Pillar Algorithm developed from algorithm execution steps in the original paper (Barakbah 2009) 16 Figure 10 Pseudocode to find the best cluster solution, combines Pillar
Algorithm, K-Means clustering, Silhouette Function, and Sum Squared of Errors to get the best cluster solution 17 Figure 11 A snapshot from SentiWordNet lexicon file 18 Figure 12 An example of some terms stored in ref_sentiwordnet_nodesc 18 Figure 13 Flowchart on how to select the best matching term in
SentiWordNet 19
Figure 14 Centroid selection for the first-3 interation (Barakbah 2009) 24 Figure 15 Pseudocode to find the best matching term in SentiWordNet
lexicon 26
Figure 16 Clustering performance comparison (by execution time in miliseconds) on dataset that decomposed with SVD and without SVD 28 Figure 17 Best cluster solutions that fulfills additional criteria 29 Figure 18 Comparison between one of bad cluster solution with negative
average silhouette score (left), and the best cluster solution K=6, without average negative silhouette score (right) 29 Figure 19 A complete step of document query process 32 Figure 20 The user interface of the search engine prototype. Contain
information about the analysis from risk analysts, cluster, and risk level
LIST OF APPENDIXES
Appendix 1 Pillar Algorithm in Python 39
Appendix 2 Silhouette Function in Python 41
Appendix 3 Stopword List 42
Appendix 4 Filtering Cluster’s Silhouette Function in Microsoft Excel 43
Appendix 5 A SVD and LSI Tutorial 44
Appendix 6 TF-IDF Calculation 47
1
INTRODUCTION
Background
Risk is defined as an uncertain event or set of events that would affect the objective, goal, and achievement of an organization (Newey 2014). Since it is inevitable, organizations must be aware and prepare to the risk that would occur by establishing a risk management, a group or division that consists of risk analysts. The main objective of the risk analysts is to measure the combination of the probability of a perceived threat or opportunity occurring and the magnitude of its
impact on the organization’s objectives. Thus, risk management is not only strongly related to threat or negativity, but it also related to opportunity or positivity as well. Thus, a good risk management would determine the success of an organization, not only in term of risk or threat avoidance, but also in term of obtaining success such as market opportunity and profit gaining.
In banking and financing industry, there are two models that have been widely used in implementing risk management namely quantitative model and qualitative model (Soares et al. 2011). These two models are commonly based on 5Cs credit criteria: Character, Capacity, Capital, Condition, and Collateral. In summary, these criteria tell a story about the debtor (Thomas 2000). For instance, the Character criteria reveals how good the track record and reputation of the management or the stakeholder of the business. From Capacity, the bank can ensured that the business is well managed by the management since it has a good production capacity. The Capital criteria shows that there is a reliable investment source to support the business running. Condition describes about the related business condition such as the market trend, the economic and atmosphere of related business support in the country where the business is about to run. In other word, Collateral also means as a guarantee that the debtor would repay the loan where they hand over the asset they have as the loan status is default.
These criteria are decisive for the top management in making a decision for the submitted financing proposal. Risk assessment for SME business in national bank in Indonesia is commonly dominated by the implementation of credit scoring system (quantitative model). The credit scoring model is basically consist of accounting formulation with time-cost dimension (Newey 2014) to measure the quality of the business. As an input, the information come from the debtor’s
financial report.
From the observation through the loan assesment’s Standard Operating Procedure (SOP) in the bank where this research is conducted, it is found that the there are some leakages in measuring the acceptance criteria. In fact, the leakages are dominantly found in the credit scoring system, and customer’s financial quality
Speaking of information technology implementation, the credit scoring has been commonly integrated with the Loan Originating System (LOS). The LOS is basically a workflow system that records the administration process, Service Level Agreement (SLA), notice from bank analysts that yields a numeric score used by the decision makers in making a decision whether the proposal is going to be approved or declined. To complement this model, some banks also implement the dimensionless qualitative model where the information came from the risk analysts by commenting the proposal and financial information.
Currently, the government of Indonesia requires all national bank in Indonesia to support the SME business by providing working capital loan. According to the central bank of Indonesia (BI 2012), a business is classified as a small business when it has a net worth ranging from IDR 50,000,000.00 up to IDR 500,000,000.00, and also it has an annual worth ranging from IDR 300,000,000.00 up to IDR 2,500,000,000.00. A business is classified as the medium one, when it has a net worth ranging from 500,000,000.00 up to IDR 10,000,000,000.00, and also it has an annual worth ranging from IDR 2,500,000,000.00 up to IDR 50,000,000,000.00. As of June 2015, there are about 11,1 million SME businesses that obtained financing from national banks in Indonesia1. In the other hand, the central bank also insists the national banks to have risk management before granting a loan to minimize the risk that might occur such as loan default, as regulated in the central bank regulation (BI 2003). To measure the performance of the bank on channeling loan, one of main indicator that central bank use Non Performing Loan (NPL) ratio that would be issued by the bank through their annual report. Mostly, every bank would set up a target in how big the NPL ratio they should achieve annually.
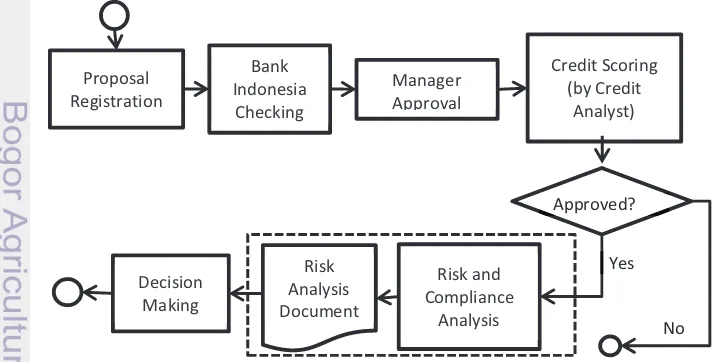
As a case study, this research is taken place in a national private bank in Indonesia where the SME financing is one of their main business where their NPL ratio has not achieved the target, which is lower than 2%, for three consecutive years (2012: 2.66%; 2013: 2.26%; 2014: 2.78%). This problem has motivated the management through the New Year speech in 2015 to ask the risk analysts to have a refinement on analyzing the financing proposal. The first task to be done is by retrieving some information regarding the implementation of financing Standard Operating Procedure (SOP) as summarized in Figure 1.
What became our concern is there is a drawback in implementing the two model of risk analysis. Eventually, the output from both models combined, was used by the decision makers in making a decision. The quantitative model already has an obvious decision criteria that the proposal to be approved or rejected. Yet, the qualitative model does not has this criteria. By reading the narrative opinion from the risk analysts the decision makers must read carefully on what the analysts have written down in the documents. All the decisions are only made based on their experiences and knowledge in banking particularly in business financing. Here is where the gap between both model and become the main motivation for this research to be conducted.
Problem Statements
From our observation, the bank where this research has taken place is already successfully used the quantitative model that implemented in their LOS. Problems were founded in the qualitative model where the implementation is conducted by delivering the risk opinion and risk mitigation through a risk analysis document. In this research, we formulate three problem statements to be solved in this research conduction: (1) What is the appropriate model for these SME business risk analysis documents, is it by clustering or by classifying the documents? (2) How to quantify the risk in the documents? (3) How to evaluate the model that have been built?
Objectives
There are three objectives of this research to address the problem statements above: (1) To perform clustering task to group the risk analysis documents, since there is no labeled documents yet, (2) To measure the risk level in each cluster using term-importance and sentiment weighting, and (3) To evaluate clustering task and sentiment measurement to reveal the implication with the criteria in assessing the loan risk.
Benefits
The benefit of this research is to enhance the Standard Operating Procedure in assesing written loan proposal. By providing the information regarding the risk group and its risk level, the expectation is that the conventional bank and particularly the risk management division would be able to compare the newly submitted loan proposal against the available risk model available in the risk cluster. Thus, prior to approving the loan proposal, the decision makers in the bank are expected to be able to decide that an SME business is considered as a high risk business or not. Another expectation is that the risk cluster and measurement can be used in helping the bank to evaluate and refine their current risk analysis implementation.
Boundaries
with the filing value above 5 billion Rupiahs (2) There are 519 risk analysis documents used in this research that have been written by the risk analysts from 2013 to January 2014. Any risk opinion and mitigation beyond that period are not covered yet in this research (3) Although the cluster result may describe the level of the risk. However, for further implementation in Loan Originating System to support the decision makers, the risk management must define at what level is the approval criteria for decision makers, since this research did not cover any deeper analysis to define the approval criteria.
2
LITERATURE REVIEW
Risk Clustering
Clustering risks in financing are majorly dominated by the usage of numerical data which are mostly utilized to reflect the financial performance such as to forecast bankruptcy of a company, and detect default status of a financing (Kou et al 2014). In this research, since our effort is to utilize the risk opinion documents, We do not use those common approach that using the numerical data either to cluster or to classifiy the data. Instead, we use semantic approach to analyze the narrative opinion from risk analysis documents by conducting sentiment analysis. In addition, they emphasize to evaluate six clustering algorithm that implemented for risk analysis in financing. And all of them are based on the structured data that mostly came from the financial statement of the bank customers. Their research also motivated from the previous works in risk analysis that implemented either supervised and unsupervised learning that also utilized the financial data to define risk in financing. Thus, by observing the unstructured data that came from the risk analysts opinion will be an interesting topic of research.
Sentiment Analysis
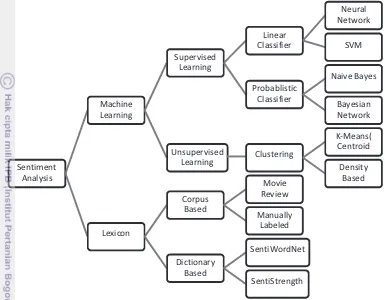
Along with the social media popularity such as Facebook and Twitter, sentiment analysis has been one of current interesting research topic. Most of the subjects are about on how to determine customer’s preference, and people interest on particular product and event. As described in the related works, there are several techniques that have been developed as depicted in Figure 2.
unsupervised learning, the label or class are not known yet, therefore, a technique such as clustering is used to define the proper number of labels that suitable for the observed dataset.
In contrary, the lexical learning has lower accuracy in determining the polarity, but it offers efficiency to be used in a real time applications (Vinodhini and Chandrasekaran 2012). This is the reason why this research used the lexical based since there is no training data available and the desired model developed in this research is ready and immediately implemented in the real-time application to support the financing process. Lexical approach basically depends on a database contain terms, its part-of-speech, and its meaning. There are some available lexical resource available, however, after several searching attempts, there is only one lexical database that already succesfully utilized for Bahasa Indonesia using SentiWordNet 3.0 (Esuli and Sebastiani 2006). SentiWordNet has a structure that contains information about the terms in English as follows:
TermId | POS | Terms | Pos | Neg | Term Synonim | Term Usages
· TermId, contains the terms id number
· POS, contains tagsets. Namely, adverb (r), adjective (a), noun (n), verb (v)
· Terms, contains terms in English
· Pos, contains the positive polarity of the term
· Neg, contains the negative polarity of the term
· Term Synonim, contains several alternative terms or its synonim
· Term Usages, contains several terms example usages Sentiment
There are various lexicon resources that can be utilized as a dictionary to determine the polarity of a term such as SentiWordNet (Esuli and Sebastiani 2006) which is derived from the well-known corpora namely WordNet, an English dictionary for word synonyms and antonyms. Next one is SentiStrength (Thelwall 2010) which is lexicon based technique, distributed as a desktop application tool that already combined with several popular supervised and unsupervised classifier algorithms: SVM, J48 classification tree, and Naive Bayes. Another kind is emoticon based lexicon, which is considered as the simplest one (Gonçalves et al. 2013). Unfortunately, most of the lexicon dictionaries and corpus resources are designated for English. Some efforts have been done to overcome this shortfall by translating either the observed corpus object (Denecke 2008) or translating the lexicon dictionary and the labeled corpus (Lunando and Purwarianti 2013). Moreover, the purpose of sentiment analysis is mostly dominated by on how businesses determine the opinion and judgment of their customers upon their products from open resources such as social media instead of performing sentiment analysis using a closed resources such as risk analyst opinion upon bank customers business.
Unlike in English, as of today there is only one international research publication utilized SWN 3.0 in Bahasa Indonesia that aimed to detect sarcasm in social media (Lunando and Purwarianti 2013). The translation problems were solved by utilizing tools and techniques such as Google Translate, Kateglo (Kamus Besar Bahasa Indonesia based dictionary). In addition, since the case study where this research was taken place is banking and finance, thus, We asked the banking experts for specific banking and finance terms that unavailable in the lexicon.
Part of Speech Tagging
Since the terms in SentiWordNet are labeled based on their position in the sentence, therefore it is a must to label the term so it can match its pair in the lexical database. This technique is called as Part of Speech Tagging (POS Tagging). In this research, a Hidden Markov Model (HMM) POS Tagging (Wicaksono and Purwarianti 2010) technique that used to label the terms. As reported in the paper, the accuracy on labeling the terms is about 96% higher than previously conducted POS Tagging research. The technique proposed in the paper is also equipped with the corpus resource, and Application Program Interface (API)2 in Python programming that referred to the Wicaksono and Purwariantis paper and available for free download and use. value of its diagonal is sorted decreasingly. The matrice D determines how big the dataset will reduced, ranging from 80% (Osinsky 2004) to 90% (Zhang and Dong 2004) scalar value of D will be used to obtain featured vectors from both matrix ܷ
2Pebahasa-Bahasa Indonesia POS Tagger Python API based on Hidden Markov Model.
and matrix V. Matrix V is called as right singular value of A, that represents the document concept.
To get a better understanding on how SVD works for dimension reduction (Harikumar et al. 2012), here is some small example. Suppose there is a corpus contain several documents in Bahasa Indonesia d1, d2, d3, d4, d5.
d1: “trend bisnis perumahan meningkat”
d2: “minat masyarakat terhadap perumahan daerah abc meningkat” d3: “anak perusahaan pt xyz di abc mengalami kesulitan modal”
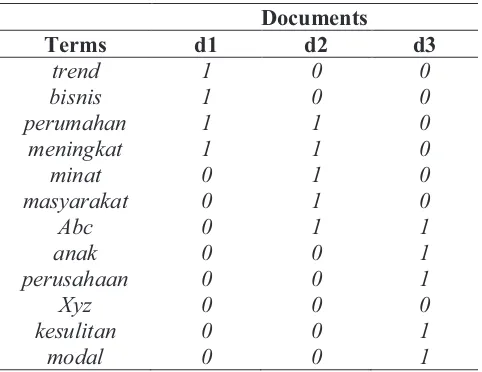
Later, a term-documents binary matrix was constructed from above documents to represents the relation between the terms and the documents in terms of the presence of a term within a document. The presence of a term in a document will marked with 1 and the absence of a term will marked with 0.
Table 1 Term-document matrix representation
Documents
Terms d1 d2 d3
trend 1 0 0
bisnis 1 0 0
perumahan 1 1 0
meningkat 1 1 0
minat 0 1 0
masyarakat 0 1 0
Abc 0 1 1
anak 0 0 1
perusahaan 0 0 1
Xyz 0 0 0
kesulitan 0 0 1
modal 0 0 1
As seen in Table 1 a matrix with ͳ ൈ ͷ sized to be used in SVD computation. The next step is to decompose the matrix into three matrices, the first matrix is ܷ the left-singular value, that is an eigen vector from ܤ that computed as ܤ ൌ ܣ்ܣ. And the second one is ߑ, the diagonal matrix or the square roots of eigenvalues of ܤ. The last matrix is ܸ, the right singular value or eigen vector from C obtained from the equation ܤ ൌ ܣܣ்.
By implementing SVD, the expectation is to have a lower dimensional dataset that able to optimize the computation task such as clustering. To get the best low rank that represents threshold, denoted as ݇ െ ݎܽ݊݇ function of the original dataset A, below is the measurement comparing ԡܣԡி and ԡܣԡ, Frobenius norm of sum
of k items in Σ, and all items in Σ (Ozinski 2004; Zhang and Dong 2004).
݇ െ ݎܽ݊݇ሺܣǡ ݇ሻ ൌԡೖԡಷ
Term Frequency-Inverse Document Frequency
In general, TF-IDF (Manning et al. 2009) is utilized to identify how important each term is in the corpus. TF or term frequency, reveals how important a term is used within a document by calculating its occurance. Denoted as tft,d, the frequency of term t in document d is defined in Formula 3. The more frequent a term used in a document means the term is important, or in other words, the term is the topic where the author would like to discuss. However, there may be a question regarding against the term high frequency usage, that is what if that term also used in many documents? This situation indicates that the term are less important, since it is not specifically mentioned in a document. Therefore, the IDF or Inverse Document Frequency calculation overcomes this problem by calculating the occurrence of a term compared to the number of documents where the term occurred.
ݐ݂௧ǡௗ ൌ
ǡ
௫ሺ௧ሻ
(3)
Denoted as idfi, inverse document frequency for term t in the corpus D defined as formula (4).
݂݅݀௧ ൌ ݈݃ଶ ே
(4)
Where N is number of document available in corpus, nt is occurrence number of term t in all documents in the corpus. There was a little modification in implementing the formula above. The term in the basic TF-IDF is selected distinctly based only on how the term spelled, and disregard the term preposition in sentence. Since the SWN 3.0 is also based on the term preposition, the term position in the term list was need to be added, which is obtained in the POS Tagging task.
K-Means Clustering
K-Means clustering (Mac Queen 1967), a widely used centroid based on a partitioning algorithm which is used in order to find how many risk cluster exist in the corpus. The algorithm is considered as a fast, simple, and effective to solve many partitioning problem. However, K-Means suffered from initiating centroids, where the centroids are selected randomly and tend to have an instability to the cluster calculation. The second problem is, the number of clusters must observed thoroughly to obtain the best cluster solution. Thus, in this research we proposed a strategy by using a modification of K-Means clustering, by implementing centroid optimization using Pillar Algorithm, and obtain the best cluster solution by evaluating the quality of cluster using Silhouette function and Sum of Squared Error.
Centroid Optimization using Pillar Algorithm
The Pillar algorithm was inspired by the function of pillars of a building or a construction. It is a common reasoning that a pillar in a building is deployed at each edge or corner in a building, so the mass of the building is concentrates in each pillar. The same idea is adopted for the clustering task that the best initial centroids are presumed exist in the edge of the dataset, or in other word, those k-farthest objects in the dataset is selected as initial centroids, where k is number of clusters to be observed. Complete steps from original Pillar Algorithm paper is described in Figure 3.
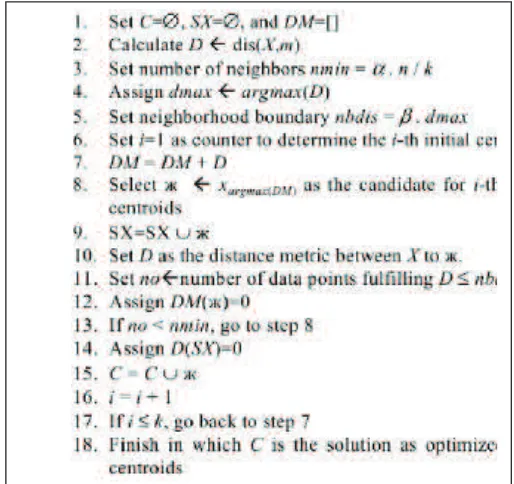
Figure 3 Complete steps of Pillar Algorithm (Barakbah 2009)
From the line 1 to line 3 the algorithm started with initialization variables: C is to stores the selected centroids, SX is to stores candidate for the initial centroid, and DM to is to stores the distance between objects and the mean variable m. The next step is to calculate distances between the object in X and m, and stores it into D which is represented as a list sorted descendingly. The objective of this sorting mechanism is to select the farthest objects that later can be used as an initial centroid candidates.
However, these candidates also determined by two variables that must be carefully selected: α and β. α is a variable to determine how many objects that surround the centroid candidate, this calculation is done by multiplying α with n/k (line 2) and stores it into nmin variable, where n is the number of objects in the dataset, and k is the number of clusters. This multiplication is intended to get the proportional number of objects in a clusters, and to avoid the selection of an outlier as a centroid. Other variable is β that determined how far the neighbor objects are that surrounds the centroid. This achieved by multiplying β with dmax, that is the farthest objects in D (line 5), and the result is stores into variable denoted as nbdis.
feasible as the neighbors of Ж by observing objects in DM list, that stores the distances between object in X and Ж. The number of feasible neighbors must be
greater than nmin and with the distance that at least equal or less than nbdis. Once these two criteria are satisfied, then Ж is selected as centroid candidate, and stored into C list. Otherwise, the algorithm will continued the iteration in D list to select the next farthest object.
Once the number of centroids in C list is equal to k, the algorithm will stopped and present the centroid candidates that used later in the K-Means clustering task.
Cosine Similarity
In this research, cosine similiarity is used to determine the similarity between the query terms entered by users and the documents within clusters described in Formula 7. Where di is the i-th from document vector collection denoted as
ࢊ ൌ ሺ݀ଵሬሬሬሬԦǡ ݀ሬሬሬሬԦǡ ݀ଶ ሬሬሬሬԦǡ ǥ ǡ ݀ଷ ሬሬሬሬሬԦሻ , where m is the number of documents. Each document
vector is about to be compared against the term query vector collection denoted as
ൌ ሺݍଵሬሬሬԦǡ ݍଶሬሬሬሬԦǡ ݍଷሬሬሬሬԦǡ ǥ ǡ ݍሬሬሬሬԦሻ, where n is the number of terms obtained from the preprocessing task. The weight of di is obtained from right singular value ܷ in Formula 1, as well as was obtained from the left singular value V (Thomo 2015;Nguyen 2015). However, not all of vectors in q are involved in the calculation, only vectors that represent the terms that entered by the users are involved.
The lower ܿݏሺ݀ǡ ݍሻ value indicates that the j-th query terms are strongly related to the i-th document. Otherwise, the higher ܿݏሺ݀ǡ ݍሻvalue indicates the query terms are less related. An example of how the SVD, and cosine similarity works can be followed in Appendix 5.
ܿݏሺ݀ǡ ݍሻ ൌ ௗǤೕ
ԡௗԡฮೕฮ (7)
Cluster Evaluation using Silhouette Function
After performing the clustering task, the cluster evaluation was done by using silhouette function (Rousseeuw 1986). The formulation of silhouette function is described in Formula 8. silhouette function, it will be easy to understand how well is an object placed in a cluster, therefore the quality of a clustering task is ensured for the risk documents.
3
METHODS
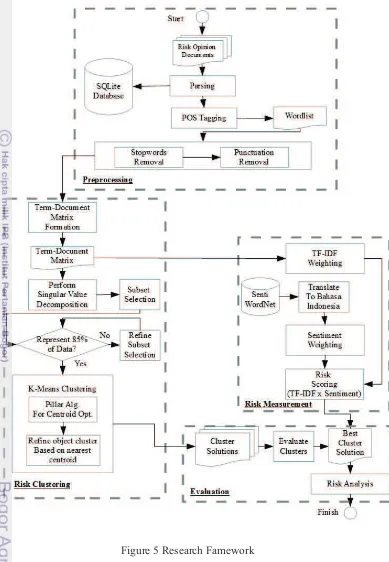
Research Framework
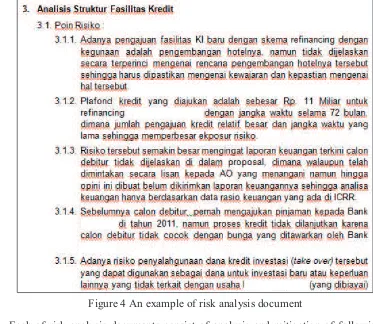
There are 519 loan risk analysis documents collected since 2013 until early 2014, written by risk analyst in the Risk Management Division. All of the documents is written in Microsoft Word format. The documents consist of seven risk analysis parts, those are (1) ICRR (2) Financial Performance (3) Proposed Loan Facility (4) Business Performance (5) Repayment Ability (6) Legal Analysis and (7) Foreign Exchange. All of the parts are analyze based on 5Cs Credit Criteria (Character, Capacity, Capital, Condition, Collateral). Here in Figure 4, we depict an example of one risk analysis document.
Figure 4 An example of risk analysis document
Each of risk analysis documents consist of analysis and mitigation of following parts: 1) Internal Credit Risk Rating, 2)Financial Performance, 3)Proposed Loan Facility, 4)Business Performance, 5) Repayment Ability and Cash Flow, 6) Legal Analysis, and 7)Foreign Exchange Analysis (Optional). However, not all of those criteria are always commented by the analysts. For instance, the Foreign Exchange Analysis are not required to be analyzed for the business that only using Rupiah for their daily transactions.
Figure 5 Research Famework
Parsing The Risk Opinion from The Documents
parts in risk analysis documents: (1) Opening (2) Opinion and mitigation (3) Closing and signature. Since what this research really need is the opinion, thus, we only retrieved the risk opinion and mitigation part by parsing the documents, extracting the sentence, and perform term tokenization using “re” API, a regular expression library from Python. We noticed that all part of opinion are always started with the same and specific header. For instance, risk opinion in the bank’s
credit scoring system always marked with the “Pengisian ICRR” header, opinion
for financial condition market with “Aspek Keuangan” header. The complete list of
header that marked each part of opinion are marked in Table bla below. After all of opinion were parsed and retrieved from the documents, then those were stored in a database management system called SQLite (Hipp 2000) table namely mst_opini_mitigasi_raw, with a structure as listed in Table 2.
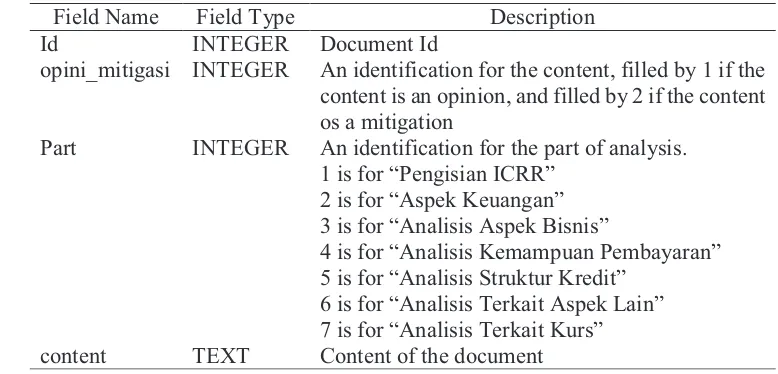
Tabel 1 Table structure of mst_opini_mitigasi_raw
Field Name Field Type Description
Id INTEGER Document Id
opini_mitigasi INTEGER An identification for the content, filled by 1 if the content is an opinion, and filled by 2 if the content os a mitigation
Part INTEGER An identification for the part of analysis. 1 is for “Pengisian ICRR”
2 is for “Aspek Keuangan” 3 is for “Analisis Aspek Bisnis”
4 is for “Analisis Kemampuan Pembayaran” 5 is for “Analisis Struktur Kredit”
6 is for “Analisis Terkait Aspek Lain” 7 is for “Analisis Terkait Kurs”
content TEXT Content of the document
And in Figure 6 shows how the content of the document is stored in the mst_opini_mitigasi_raw table.
Figure 6 A snapshot from table mst_opini_mitigasi_raw
POS Tagging and Term Tokenization
And in the Results and Discussions we will show how the POS Tagging works in labeling terms within a sentence.
Figure 7 An example of content from the f_wordlist file
All terms that selected for the next process are stored in a plain text file called as f_wordlist, in the form as shown in Figure 7 above, where a term are stored in a row followed by its POS Tag in a sentence that founded during the POS Tagging process.
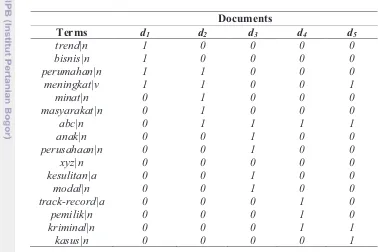
Table 2 A matrix of term-document illustration
Documents
Terms d1 d2 d3 d4 d5
trend|n 1 0 0 0 0
bisnis|n 1 0 0 0 0
perumahan|n 1 1 0 0 0
meningkat|v 1 1 0 0 1
minat|n 0 1 0 0 0
masyarakat|n 0 1 0 0 0
abc|n 0 1 1 1 1
anak|n 0 0 1 0 0
perusahaan|n 0 0 1 0 0
xyz|n 0 0 0 0 0
kesulitan|a 0 0 1 0 0
modal|n 0 0 1 0 0
track-record|a 0 0 0 1 0
pemilik|n 0 0 0 1 0
kriminal|n 0 0 0 1 1
kasus|n 0 0 0 0 1
Later, those terms that listed in f_wordlist file will be used to construct a term-document matrix with size of ݐ ൈ ݀ as seen in Table 3, where t is the number of terms (row) and its tag that founded in number of d documents (column). All of these process starting from tagging, stopwords removal, and term-document matrix construction are performed in a single Python file namely i_preprocess.py, that listed in Appendix 6.
Singular Value Decomposition
the dimension we would like to reduce. To perform the task, we utilize a Python
library namely “numpy” which is has a function to perform SVD. The function is
obtained by simply executing the following command:
SA, EA, UA = np.linalg.svd(A, full_matrices=True)
Where SA represents the left singular value, EA represents the singular value, and UA represents the right singular value that will used later for the clustering task.
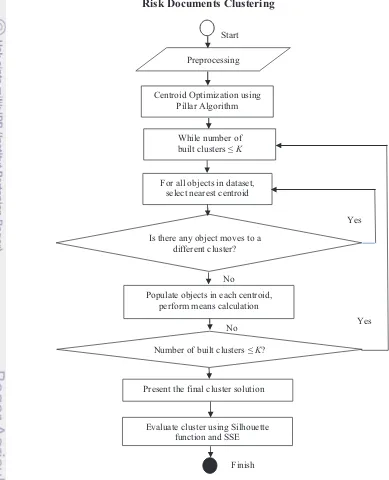
Risk Documents Clustering
Figure 8 Workflow of Clustering process using K-Means Clustering that optimized by Pillar Algorithm and evaluated by Silhouette function and SSE
The centroid optimization will performed before starting K-Means, and both of evaluations are performed each time K-Means present the final cluster solution.
Centroid Optimization using Pillar Algorithm
For all objects in dataset, select nearest centroid
by using Euclidian
Is there any object moves to a different cluster?
Populate objects in each centroid, perform means calculation
Present the final cluster solution
Yes
No
Evaluate cluster using Silhouette function and SSE
Preprocessing Start
Finish While number of built clusters ≤ K
Number of built clusters ≤ K?
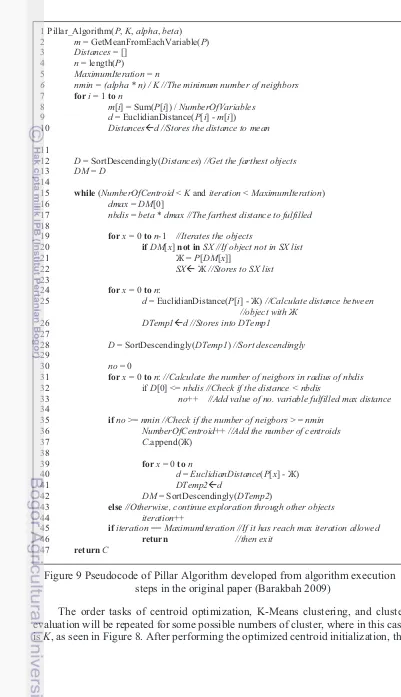
Figure 9 Pseudocode of Pillar Algorithm developed from algorithm execution steps in the original paper (Barakbah 2009)
The order tasks of centroid optimization, K-Means clustering, and cluster evaluation will be repeated for some possible numbers of cluster, where in this case is K, as seen in Figure 8. After performing the optimized centroid initialization, the
1 Pillar_Algorithm(P, K, alpha, beta)
10 Distancesßd //Stores the distance to mean
11
12 D = SortDescendingly(Distances) //Get the farthest objects 13 DM = D
26 DTemp1ßd //Stores into DTemp1 27
28 D = SortDescendingly(DTemp1) //Sort descendingly 29 36 NumberOfCentroid++ //Add the number of centroids
37 C.append(Ж)
43 else //Otherwise, continue exploration through other objects
44 iteration++
45 ifiteration == MaximumIteration //If it has reach max iteration allowed 46 return //then exit
algorithm will search the best centroid of each objects based on the Euclidian distance.
The Euclidian distance used in this research is based on below formulation:
ࢉ א ܥǡ ܦ ൌ ඥσ ሺ࢝௧ െ ࢉ௧ሻଶ
௧ୀଵ (6)
Where D is distance between weight vector w for term t to certain selected
centroid. The algorithm will continue to iterates until all of the centroids are convergent. The source code implementation of this algorithm in Python can be found in Appendix 1.
Since the number of clusters are not defined yet, thus, We have to observe every possibilities regarding the number of clusters from K=2 to K=10. The observation also applied to find the optimum value of Pillar Algorithm’s parameters
α and β respectively as mentioned in the pseudocode in Figure 9. Thus, for each value of K, We set the combination value of α and β. The complete pseudocode to find the best cluster solution is described in Figure 10.
Figure 10 Pseudocode to find the best cluster solution, combines Pillar Algorithm, K-Means clustering, Silhouette Function, and Sum Squared of Errors to get
the best cluster solution
Term Frequency-Inverse Document Frequency
The TF-IDF calculation utilized the term-document matrix to measures the TF-IDF scores. We implement the TF-IDF calculation as mentioned in the Literature Review section, in a Python program named i_preprocess.py, and the result of this calculation is a ݐ ൈ ݀ matrix stored in a flat text file named f_bag_of_weighted_terms. This file are later to be used to retrieved the result from TF-IDF calculation, and combine it with the Sentiment Score, instead of recalculate it that would takes some time.
Translating SentiWordNet
As mentioned before, that the SentiWordNet only available in English, thus, a translation is needed in order to utilized the lexicon for Bahasa Indonesia. The translation tool used here was the Google Translate which provide an API. One of available API for Python programming is the goSlate API that available freely online. Before the translation is began, the lexicon is imported into a table SQLite database. Then, by using a concise Python program the translation begin by iterating through all terms available in SentiWordNet lexicon and translate those terms to Bahasa Indonesia.
The SentiWordNet is available as a text file with a format that we have explained earlier. The aim of importing the content of SentiWordNet into a SQLite
1 alpha = 0.4 2 beta = 0.6
3 while (K ≥ 2 and K ≤ 10)
4 while (alpha ≥ 0.4 and alpha ≤ 1.0) 5 while (beta ≥ 0.6 and beta≤ 1.0)
6 Centroids = Pillar_Algorithm(P, K, alpha, beta) 7 Solution = K_Means(K, Centroids)
8 Silhouette_Score = Silhouette_Function(Solution)
database is to minimizing the possibility of losing data while translating terms that caused by network failures or any unpredicted problems. And once the translation process is stopped, we are able to trace and continue from the last term that successfully translated. There are 205,624 terms that we have been translated using the goSlate API and stored into a table called ref_sentiwordnet_nodesc with the structure described in Table 3, that is similar with the original SentiWordNet file as depicted in Figure 11, except the description field.
Table 3 The structure of SQLite table ref_sentiwordnet_nodesc
Field Name Field Type Description
word_type TEXT Term position in a sentence word_index TEXT The term index in SentiWordNet Pos NUMERIC Positive polarity score
Neg NUMERIC Negative polarity score
word_en TEXT Term in English
word_id TEXT Term in Bahasa Indonesia
As seen in the Figure 11, “risk” has several synonim: “peril”, “risk”, “jeopardy”, and “hazard", those four terms are not stored in the same rows as in the SentiWordNet lexicon file, instead, those term are stored separately in the different rows to make the query process in measuring the sentiment polarity becomes more efficient. Those terms are stored in a file namely ref_sentiwordnet_nodesc as depicted in Figure 12.
Figure 11 A snapshot from SentiWordNet lexicon file
Figure 12 An example of some terms stored in ref_sentiwordnet_nodesc
SentiWordNet file in English in files with the first alphabet and tag as the prefix and “_en” as the suffix. For instance, adjective terms in Bahasa Indonesia e.g.
“abadi”,”acak”, and “ahli” are stored in file named “aa_id”. Otherwise, adjective
terms in English e.g. “capital”,“cashable”, and “categoric: are stored in file named
“ca_en”. The aim of storing these terms into separated files is to reduce the query
time from the database.
Sentiment Scoring
Technique that used to retrieve the terms in SentiWordNet is as seen below in Figure 13.
Figure 13 Flowchart on how to select the best matching term in SentiWordNet Measure Levensthein Distance for all term with
first letter “b” and tag “n” in SWN Bahasa
Indonesia
Best minimum distance > 1?
Measure Levensthein Distance for all term with
first letter “b” and tag “n” in SWN English
Select the pos and neg from the best matching term in SWN Bahasa
Best minimum distance > 1?
Select the pos and neg from the best matching term in SWN English
English Lev Distance > Bahasa Lev Distance?
bn_id
Input term with “b” prefix and “noun”
Start
Finish
Finish No
Yes
No
Basically, the look up is started with look up in Bahasa Indonesia files, where the risk analysis documents based on to this language. If the look up found that the best Levensthein distance is greater than 1, the iteration will continued to the English files. Then, the best distance found in English compared to the best distance
in Bahasa Indonesia, if the English’s best distance is less than the Bahasa Indonesia’s best distance, term in English will be selected, otherwise, term Bahasa
Indonesia will be selected.
Equipments
There are two type of equipment used in this research. The first one is software consists of programming tools, libraries, and packages. Microsoft Visual Studio 2013 Community Edition was chosen as Integrated Development Environment (IDE) to develop a C# program equipped with Microsoft Office .NET native library. Both were used to make it easier to import the corpus since the risk analysis documents is in Microsoft Word (both doc and docx extension). After the documents have been read by the program, those imported into a SQLite Database.
Then, the process continued by proceeding the main tasks, those are preprocessing, clustering, term and sentiment scoring, and eventually ended by the evaluation. All of the tasks are used the Python version 2.7 programming equipped by some packages that commonly used in computational task such as numpy, and scipy. The tool used for the Python programming is Sublime Text version 3. The second equipment is the hardware, a notebook with AMD A6 Processor, 4 GB DDR3 Memory, and 750 GB Harddisk Drive.
4
RESULTS AND DISCUSSIONS
Risk Analysis
Risk analysis is necessary and required by central bank as described in the regulation regarding to implementation of risk management (BI 2003). It is clearly stated that the conventional bank must effectively implement risk management on running their business, and in our case, including risk management for financing process. Conceptually, the risk management is consist of (1) Surveillance from the board of commissioner and board of director (2) Sufficiency of policies, procedures, and limit definition (3) Sufficiency of identification, measurement, surveillance control, and system information (4) A comprehensive internal control. What we want to highlight are point number two and number three, where a bank must has a identification, measurement, mechanism, and information system implementation to analyze and mitigate the risk.
conventional bank in Indonesia willing to implement both models, they must to make sure that their implementation are already fulfill above criteria.
Preprocessing
In the preprocessing, we divide the task into three parts: (1) Parsing the documents, the aim is to retrieve the opinions from the documents, (2) POS Tagging, the is to give the label into each term, and (3) Construct term-document matrix and reduce it using the dimension using SVD (Nguyen 2015), to get a feature with lower dimension.
Parsing The Documents
There are two major task in preprocessing, those are removing the stopwords and labeling the Part of Speech position of each term. In stopwords removal the stopword list used in this research retrieved from one of GitHub page along with the POS Tagging API1. There are many stopwords in Bahasa Indonesia available in the web, mostly addressed for particular field or study and not for general purpose. The reason why the stopword list from this page was chosen is simply because it was made for a general Natural Language Processing research in Bahasa Indonesia. There are 124 stopword terms used to remove the less important terms in the risk
analysis documents, Most terms here are conjunctive terms such as “sekedar”, “sekadar”, “ketika”, “melainkan”, “bagaikan”, and “beserta”.
Part of Speech Tagging
The preprocessing task continued with POS Tagging. Since there are only four term position labels in SentiWordNet as mentioned in the Literature Review section, and the POS Tagging API provide 37 position labels, then a mapping was needed to find the best pair between term in the corpus and in the SentiWordNet lexicon. Here in Table 4 is the mapping between the both from POS Tagging API and SentiWordNet.
Table 4 POS Tag transformation between tags in SentiWordNet and tags in POSTag API
SentiWordNet Label POS Tagging API Label A (Adverb) JJ, JJR, JJS, CDC, CDI, CDO, CDP
V (Verb) VB, VBD, VBT, VBG, VBN
R (Additional Adverb) RB, RBR, RBS, NEG, SC
N (Noun) NN, NNS, NNP, NNPS, NNG, FW, MD, NNG, NNPP, WP
An example result of POS Tagging would be a string variable as seen as below.
dan/CC monitoring/NN atas/IN kualitas/NN dan/CC nilai/NN terkini/NN dari/IN agunan/NN tersebut.eksekusi/JJ atas/IN jaminan/NN yang/SC berupa/VBT non/NEG fixed/NN asset/NN (/OP peralatan/NN )/CP bukan/NEG merupakan/VBT hal/NN yang/SC mudah/JJ dan/CC sangat/RB rentan/JJ terhadap/IN penurunan/NN nilai/NN //GM depresiasi/NN (/OP terlihat/VBI dari/IN aset/NN tetap/JJ dari/IN tahun/NN 2010-2102/CDP yang/SC nilainya/NN terus/RB menurun/VBI )/CP”
Afterwards, the stopwords and punctuation removal were performed to
remove the unecessary terms such as “dan”, “sehingga”, “merupakan”, “yang”, “dari”, and “2010-2012”. The remaining terms are used to construct term-document matrix as seen in Table 1 that used as a feature vector later on the clustering and sentiment weighting.
Dimension Reduction using SVD
According to Figure 5, the preprocessing task produced a dataset containing about 3290 terms. These terms were used to construct the term-document matrix sized ͵ʹͻͲ ൈ ͷͳͻ. Here, the SVD plays its role to minimize the execution time and obtain the most prominent terms available in the corpus. As described in the literature review section, by computing SVD, there will be three matrices. The left singular matrix, U, the term concept was generated with the size of ͵ʹͻͲ ൈ ͵ͲͲ. The diagonal matrix ∑ generated with the size of ͷͳͻ ൈ ͵ͲͲ, and the last matrix V that is the document concept matrix sized ͷͳͻ ൈ ͷͳͻ.
Actually, by utilizing SVD, the dimension of the dataset is already reduced, but we tried to get a smaller dataset by To get the best k-rank that represent the entire corpus dataset, by using formula (2). In this research we set threshold q=0.98 and the result is, selected k-rank is 300. Yet, there is no standard on what is the best threshold for the best k-rank. Earlier, Zhang Dong(2004) defined that the best k-rank is 0.8, Osinzki(2004) defined that the best k-rank is 0.9.
The dimension reduction objective was achieved by utilizing the document concept matrix V and the diagonal matrix ∑ (Thomo 2015). Actually, document clustering can be achieved by only performing SVD (Zhang 2004). However, the number of document groups is considered still too vast for the bank to get the proper risk model, since there are 300 concepts found, in other words there are 300 risk levels and concepts that can be obtained. For a comparison, in particular bank, the quantitative model currently has only 20 risk level. By narrowing the number of clusters the expectation is that the bank could be easy to determine in what level of risk is a proposal can be accepted.
Therefore, by using the reduced dataset came an idea to perform clustering task using K-Means. The expectation is to get the desired number of clusters at least equal with the quantitative model.
Risk Clustering
Optimizing Centroid
Obviously, K-Means clustering has a classic issue in optimizing the initial centroid since K-Means is relied on randomized object selection for the initial centroid. Even though the dimension reduction was already performed, the randomized centroid selection will generate a non-persistent cluster solution in each iteration. Thus, it will suffered from computation time execution, since a number of try and error experiment will occurred. For instance, in the case study, there are about 519 documents to be clustered. Let say there are about 5 clusters to compute, by using permutation, ݊ǨȀሺ݊ െ ݇ሻǨ, where n is the number of documents, and k is the number clusters, there would be 36,935,551,782,360 centroid probabilities. Hence, an optimization is needed to overcome this problem.
Overall, for each number of k, ሼ݇ א Ժȁʹ ݇ ͳͲሽ to be observed. The number of k used in the computation is the representation of the number of business risk levels in the bank, so that we expect that the each cluster group represents the level of risk, ranging from the lowest to the highest. The iteration was started from measuring the mean of the feature vectors, which is the term and sentiment weight that previously measured. Below is the formula we use to measure the mean available in the corpus:
ݐ א ܶǡ ݉ሺݐሻ ൌேଵσ ݓሺݐୀଵ ሻ (5)
In Formula 5 the mean calculation for each term t thatis available terms in the term list T, N is number of documents, w is term and sentiment weight that previously measure, and mis the mean vector of the term. After we obtain the mean
of all terms as a starting point of iteration, the algorithm select the k farthest distance objects from m, defined as Ж, as initial centroids and check whether Ж already exist in SX list, otherwise, it will be stored to SX. The selection method is simply by sorting the distance matrix dataset that containing each term vector distance to the mean. The distance formula we used here is the basic euclidian distance measurement similar to Formula 6.
Starting from the farthest object from the mean, the computation is followed by exploring the number of neighbors of selected objects, defined as ߙ ൈ ܰ stored in nmin variable, inside the boundary of ߚ ൈ ܦሺࢊǡ ሻ which is stored in nbdis variable. D is the distance between the object term vector of document object d and
m. This exploration is intended to avoid selecting an outlier object as centroid. Our
centroids must have minimum number of neighbors in given distance that already set in the beginning of iteration.
Figure 14 Centroid selection for the first-3 interation (Barakbah 2009)
After having the first centroid, the next object to be selected is the farthest object from the first centroid, this intended to have a set of centroids that not concentrate in one particular area. Figure 14 describe the centroid selection from the first three iteration. Then the iteration will stop when i, the number of objects selected as centroidis equal to k.
Risk Measurement
In financing industry, measuring risk in the form of grading system is necessary and required to enable the decision makers in comparing risk exposures and having further analysis upon the customers business (Gumparthi 2010). Therefore, in this research a measuring mechanism must be deployed against the cluster model that has been built. We adopted the grading system that commonly implemented in credit scoring system by labeling each cluster with the level of risk exposure, ranging from the lowest to the highest, and the number of levels are depend on the number of cluster obtained from the clustering task.
From the previous risk clustering step, the cluster that has been modeled represent the interconnectivity of risk opinion between each risk analysis documents. Yet, it is not represents the level of risk that has been mentioned by the risk analysts through the documents. Thus, a process to measure the level of the risk is needed, namely risk measurement. In this research, we analogously refer the risk with sentiment. However, the level of the risk were not only determined by the importance of the terms within the document, but it also determined by the polarity.
polarity using SentiWordNet lexicon database. The mechanism will be explained in the following Sentiment Weighting section.
As explained before, Term Importance Weighting using TF-IDF and Sentiment Weighting using were combined to define risk level in each cluster generated from the Risk Clustering process. The idea was came to find out on how the risk analyst emphasis the usages of terms by calculating its importance using TF-IDF. An example to perform a TF-IDF calculation can be followed in Appendix 6. And the sentiment weighting used to calculate the polarity, whether a term is tend to positive or negative. Hence, the formulation of both calculation for each term described as below:
ݓሺݐሻ ൌ ݐ݂Ǥ ݂݅݀ሺݐǡ ݀ሻ ൈ ݏሺݐሻ (7)
Where w is the total weight of the term generated from the TF-IDFcalculation tf.idf(t,d) that consists of tf and idf calculation as can be seen on formula (1), multiplied by the polarity score, s(t) retrieved from SentiWordNet lexicon.
In order to find the best matching sentiment score in SentiWordNet lexicon, alongside querying the terms POS Tag, a term approximation technique using Levensthein distance measurement also used to compute the edit-difference between two pair of strings. The order of steps as seen in Figure 15 (refers to the flowchart in Figure 13 that described earlier), was used to find the best sentiment score preceded by the regular Structured Query Language (SQL) that collect the terms in SentiWordNet ordered by the first alphabet and written those terms into group of files that arranged the first letter and the POS Tag labels. Or in other words, this also called as an indexing technique. The SQL syntax we used to retrieve the terms is divided into two syntax. The first SQL syntax is to retrieve terms in Bahasa Indonesia, and the second is for the English. The purpose is to make the term look up more efficient, rather than scanning through all terms in a single files.
The file labeled with the format <alphabet><pos_tag>_<language>, such as file “an_id” contains terms in Bahasa Indonesia with first letter“a” and has POS Tag label “noun”, file “av_id” contains terms with first letter “a” and has POS Tag label “verb”, and so does the other terms. For English terms, the files label would be look like “ba_en” that contains terms with first letter “b” and “adjective” POS Tag label. The aim of this division was to handle the usage of English terms in the documents, so that if the pairing was not found in Bahasa Indonesia the look up will search in English. Therefore the SentiWordNet lexicon indexed and transformed 204 files.
Find The Best Matching Terms in SentiWordNet
Figure 15 Pseudocode to find the best matching term in SentiWordNet lexicon
Sentiment Weighting
The weighting process is basically simply by comparing the negative score and the positive score as defined in logical formulation below. The reason is because the value positive and negative value varied from 0, 0.123, 0.5, 0.625, 0.75, 1.
ݏ݁݊ݐ݅݉݁݊ݐ ൌ ൜ ͳǡ ݏ Ͳെͳǡ ݊݁݃ ൏ Ͳ (6)
Unfortunately, not all terms are correctly found, this was as shown from the Levensthein distance (How Levensthein distance works is as seen in Appendix 7) that the distance was > 0. There are 1666 terms that wrongly paired to the
1 TermWeighting(Term, PosLabel) 2 SentimentScore = 0
3 SwnDbId[a,b,c ... z][a, n, v, r] 4 SwnDbEn[a,b,c ... z][a, n, v, r]
5 CurrentDistanceId = 0, CurrentDistanceEn = 0 6 MinimumDistanceId = 0, MinimumDistanceEn = 0 7 PositiveScoreId = 0, NegativeScoreId = 0
8 PositiveScoreEn = 0, NegativeScoreEn = 0 9
11 for eachTermId, PositiveScore, NegativeScore inSwnDbId[Term[0]][PosLabel] 10 CurrentDistanceId = LevenstheinDistance(Term, TermId)
12 if CurrentDistanceId < MinimumDistanceIdthen 13 MinimumDistanceId = CurrentDistanceId 14 PositiveScoreId = PositiveScore
15 NegativeScoreId = NegativeScore 16 ifCurrentDistanceId = 0 then break 17
18 ifCurrentDistanceId > 0 then
19 for eachTermEn, PositiveScore, NegativeScore inSwnDbEn[Term[0]][PosLabel]
20 CurrentDistanceEn = LevenstheinDistance(Term, TermEn) 21 ifCurrentDistanceEn < MinimumDistanceEnthen 22 MinimumDistanceEn = CurrentDistanceEn 23 PositiveScoreEn = PositiveScore
24 NegativeScoreEn = NegativeScore 25 ifCurrentDistanceEn = 0 then break 26
27 ifMinimumDistanceId≤MinimumDistanceEnthen 28 if PositiveScoreId≤ NegativeScoreIdthen
29 SentimentScore = 1
30 else
31 SentimentScore = 0
32 else
33 ifPositiveScoreEn≤ NegativeScoreEnthen
34 SentimentScore = 1
35 else