See discussions, stats, and author profiles for this publication at: https://www.researchgate.net/publication/260229989
Influence of Rainfall Patterns on the Instability
of Slopes
ARTICLE · SEPTEMBER 2013
DOI: 10.9744/CED.15.2.120-128
CITATION
1
READS
73
4 AUTHORS, INCLUDING:
Agus Muntohar
Universitas Muhammadiyah Yogyakarta
50PUBLICATIONS 267CITATIONS
SEE PROFILE
Jazaul Ikhsan
Universitas Muhammadiyah Yogyakarta
9PUBLICATIONS 2CITATIONS
SEE PROFILE
Influence of Rainfall Patterns on the Instability of Slopes
Muntohar, A.S.1*, Ikhsan, J.1, and Liao, H.J.2
Abstract: The assessment of rainstorm-induced shallow landslides is still a research topic of wide concern for scientists and engineers. This paper examined the effect of rainfall intensity distribution on shallow landslides. Four synthetic rainfall distributions comprising uniformed, delayed, centralized, and advanced, were selected to examine the effect of rainstorm patterns on slope failure. The infiltration was modeled using Green-Ampt equation, while an infinite slope was selected to model the shallow landslide. Monte Carlo Simulation was applied to analyze the failure probability of the slopes. Two landslide cases were selected to examine the proposed model. The results indicated that among the four representative rainstorm patterns, the advanced rainfall pattern caused worst slope stability. The advanced rainfall pattern resulted in the shortest rainfall duration threshold for landslide occurrence, followed by the central, uniform, and then delayed rainfall pattern. The probabilistic analysis method was suitable to estimate the time of failure for the evaluated landslide cases.
Keywords: Probability, rainfall pattern, rainstorm, shallow landslide, slope.
Introduction
Landslides induced by rainfall infiltration are traditionally analyzed using the two-dimensional limit equilibration numerical analysis. Gofar and Lee [1] studied the effect of rainfall intensity and duration on landslides. The study showed that the critical duration was governed by three major factors: the saturated permeability of the soil, the geographical location, and the depth of the slip plane. The critical rainfall duration for low permeable soil was longer than a higher permeable soil. The critical duration of antecedent rainfall in soils with intermediate saturated permeability was found to vary with the rainfall pattern.
To model a shallow slope failure induced by rainwater infiltration, a relationship between rainwater infiltration and slope stability should be established. In the paper, the methodology of model development including the hydrological modeling and the soil failure modeling is first described. Physically-based models coupling the infinite slope stability analysis with Green-Ampt (GA) infiltration modeling [2] was applied in this research.
1 Department of Civil Engineering, Universitas Muhammadiyah Yogyakarta, INDONESIA.
*Corresponding Author e-mail: [email protected]
2 Department of Construction Engineering, National Taiwan University of Science and Technology, Taipei, TAIWAN.
Note: Discussion is expected before November, 1st 2013, and will be published in the “Civil Engineering Dimension” volume 16, number 1, March 2014.
Received 05 April 2012; revised 10 April 2013; accepted 16 July 2013
The effect of rainfall intensity and duration (rainfall pattern) on shallow landslides is then investigated using the developed model. Kale and Sahoo [3] elaborated that GA approach was developed for three reasons: (a) the solution of the Richards equation [4] is a rough approximation of the actual field infiltration; (b) a simplified solution still produces the exponentially decreasing relationship between infiltration capacity and cumulative infiltration; and (c) the parameters of the methods can be related to soil properties that can be measured in the laboratory, such as porosity and hydraulic conductivity. The main advantage of the GA equation is that the analytical solution is available for the computation of wetting front location and only two parameters are required for characterizing the soil properties [3-6].
Modeling and Analyses
Rainfall Infiltration Modeling
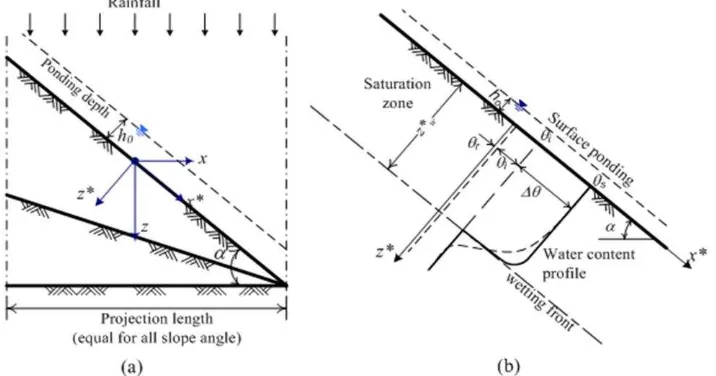
The GA infiltration model is a simplified version of the Richards equation which was developed for horizontal ground surface as written in Equation 1. For sloping surface, considering the projected coordinate system as illustrated in Figure 1a, Equation 1 can be modified in the x* and z* direction, and rewritten as Equation 2.
D k
t z z
(1)
sin cos* * * *
d
D k
t z z d x z
(2)
where is water content, D soil water diffusivity (m2/s), k hydraulic conductivity (m/s), z vertical
Muntohar, A.S. et al. / Influence of Rainfall Patterns on the Instability of Slopes / CED, Vol. 15, No. 2, September 2013, pp. 120–128
121 According to Philip [7], the solution to Equation 2 on a planar slope is independent of x* except for a small region from the crest or the point of the slope change. Therefore, Equation 2 can be simplified to become Equation 3.
cos* * *
d
D k
t z z d z
(3)
Equation 3 indicates that except for the difference of coordinate definition, the only change needed to use Equation 1 on sloping surfaces is to replace k with k cos . The dynamic meaning of this modification is that on sloping surfaces, only gravity normal to the surface direction is changed by cos (i.e. capillary forces are unchanged). Conversely, the down-slope component of gravity does cause flow, but it does not change the water content profile along the normal direction on a planar slope because the flow field is independent of x*. Therefore, as an approximate solution, the GA model can be redefined with this same modification.
Figure 1b depicts the simplification picture of the GA model. The wetting front is a sharp boundary dividing soil if moisture content below i from saturated soil with moisture content above. The wetting front has penetrated to a depth zw in time t since infiltration began. Water is ponded to a small depth h0 on the soil surface. Considering the continuity equation in a vertical column of soil of unit horizontal cross-sectional area, the cumulative depth of water infiltrated into the soil F is
*
w
Fz (4)
where zw*is wetting front depth, ∆is water content deficit is the porosity which is considered as the maximum water content, and i is the initial water content.
Darcy's law may be expressed as: h
q k
z
(5)
In this case Darcy flux q is constant throughout the depth and is equal to –f, because q is positive upward while f is positive downward. If points 1 and 2 are located respectively at the ground surface and just on the dry side of wetting front, Equation 5 can be approximated by
1* 2*
1 2 h h f k z z (6) where,
h1 = h0 (6a)
*
2 wcos
h
z
(6b)zw* = z1*–z2* (6c)
In Equation 6, is the suction head at wetting front, and zw*.cos represents gravity head at the wetting front. Darcy's law for this system is written as:
* 0 *
cos
w wh
z
f
k
z
(7)if the ponded depth h0 is negligible compared to and zw*, then Equation 7 can be rewritten as Equation 8. This assumption is usually appropriate for surface water hydrology problems because it is assumed that ponded water becomes surface runoff.
* * cos w w z f k z
(8)Substituting Equation 4 into Equation 8 gives
cos F f k F
(9)
Since the cumulative infiltration changes with time interval dt, then f = dF/dt,
cos
dF F
k
dt F
(10)
Integrating Equation 10 with respect to time inter-val from 0 to t, gives
cosln 1 cos
cos
F t
F t k t
(11)
and
cos
f t k
F t
(12)
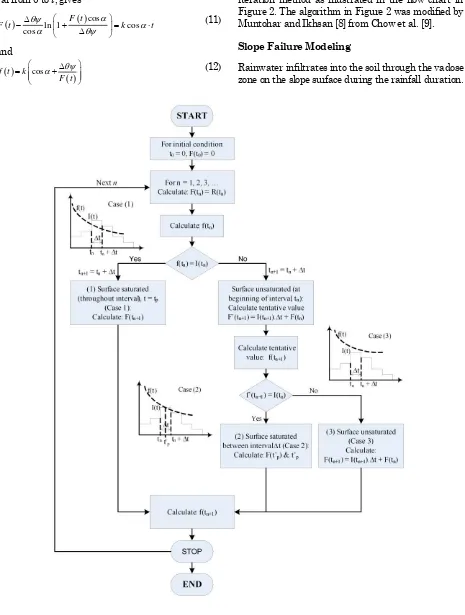
Equation 11 and 12 are the GA equations for cumu-lative infiltration and infiltration rate respectively for sloping surface. For unsteady rainfall with respect to time t, those equations can be solved by iteration method as illustrated in the flow chart in Figure 2. The algorithm in Figure 2 was modified by Muntohar and Ikhsan [8] from Chow et al. [9].
Slope Failure Modeling
Rainwater infiltrates into the soil through the vadose zone on the slope surface during the rainfall duration.
Muntohar, A.S. et al. / Influence of Rainfall Patterns on the Instability of Slopes / CED, Vol. 15, No. 2, September 2013, pp. 120–128
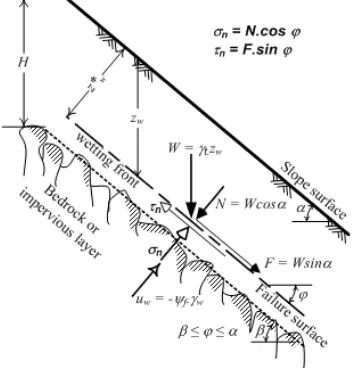
123 The infiltration process wetted the soil layer at shallow depth near the slope surface and may lead to slope failure during a prolonged rainfall event. This type of slope failure usually occurs in the form of sliding or shallow slip that develops parallel to the slope surface, thus it can be analyzed as the infinite slope case (Figure 3). Many investigators concluded that the infinite slope model was also practicable to assess shallow landslides [10-17]. Xie et al. [18], Muntohar and Liao [19] extended the infinite slope model in coupling with unsteady infiltration analysis. This concept is generally valid for the case of landslide with a small depth compared with its length and width. The factor of safety, FS, of the slope can be written as in Equation 13.
2
'
cos
tan '
cos sin
t f w
t f
c
z
u
FS
z
(13)where, uw is the pore water pressure, t is saturated
unit weight of soil, c’ and ’ are cohesion and internal friction angle respectively, zf is depth of sliding-plane that is equal to depth of wetting front (zw*). The
depth of wetting front is limited by the depth of impermeable layers or bedrock (H). In this case, the maximum zw* is the depth of bedrock. The pore
water pressure is the same as suction head uw = f.w, if the ground surface is unsaturated, but if the surface is saturated the pore water pressure uw =
zw*.w. [8].
Uncertainties and Failure Probability
In the limit equilibrium based infinite slope stability analysis, the slope failure will occur when the factor of safety is below one (FS < 1), and the critical state is obtained when the factor of safety is equal to one (FS = 1). The performance function at time t can be obtained from Equation 13 and written as in Equation 14:
Figure 3. Modeling of the Infinite Slope
, '
cos2
tan ' sin cost w w
t w
c z u
G X t
z
(14)
The performance function involves seven parameters:
c'
,
'
,
t,
,
w, and
z
w. The last parameter involves
three other parameters in infiltration analysis: ks, f
,
and . Two parameters w and are treated as the
deterministic variables since and
w are easy tomeasure and the variability is small. The other parameters are treated as the uncertain variables, Xi = {
c'
,
'
,
t,
H,k
s,
f,
. In this study, Monte Carlo
Simulation Method (MCSM) [20-21] was performed to obtain the failure probability. Values of each uncertain variable are generated randomly as identically-independent distribution (i.i.d) from the probability distribution function (PDF) for each N simulation cycles. Each set of samples and the resulting outcome from that sample are recorded.
The computed factor of safety in Equation 13 varies with the elapsed time t. For a given parameter in the equations, a slope will fail if the G(X, t) < 1, and the slope is stable if the G(X, t) > 1. Thus, the indicator function (IF) to distinguish failed and not-failed can be expressed as in Equation 15.
, 0 : ( , ) 1 1 : ( , ) 1F
G X t X t
G X t
I (15)
The failure probability at time t can be approached by calculating Equation 16.
1
1
NMCS
f F F
i
P
E
N
I
I
(16)The minimum factor of safety, FSmin obtained is calculated by minimizing the performance function G(X, t) as Equation 17:
min min ,
FS G X t (17)
Examination of the Model
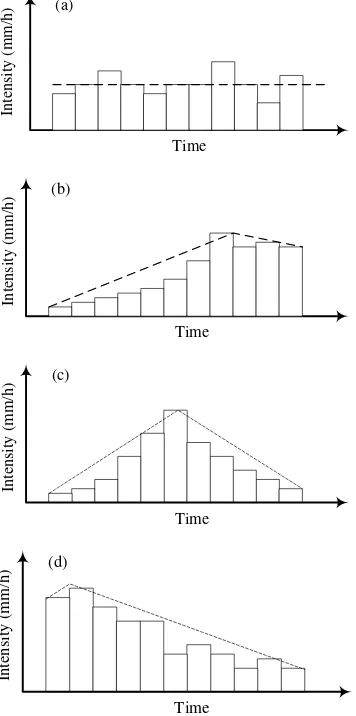
The rainfall distribution can be categorized into four essential patterns to shallow landslide. Four repre-sentative rainstorm patterns are used: uniform, advanced, central, and delayed rainstorms as shown in Figure 4 [22-23]. The maximum rainfall intensity was 100 mm/h with total rainfall about 1250 mm (Figure 5). The uncertainties of the physical, mecha-nical and hydraulic properties of the examined-slope are presented by their mean () and coefficient of variance (COV) as in Table 1. The hill slope has a slope angle of 40o. The uncertainties variables are
Figure 4. Rainfall Pattern used for Examination the Model (a) uniform, (b) delayed, (c) central, and (d) advanced
Elapsed time, t (hours)
Figure 5. Total Rainfall used for Examination of the Model
Table 1. The Mean Values and COVs of the Slope Parameters
Parameters (xi) Mean (xi) COVxi
H (m) 4.1 0.65
c’ (kPa) 5 0.1
’ (degree) 25 0.2
t (kN/m3) 21.8 0.1
ks (m/s) 1.8 x 10⁻⁶ 0.3
w 0.123 0.08
f (m) 0.5 0.02
Results and Discussion
Effect of Rainfall Pattern on the Failure Probability
The distributions of the minimum factor of safety, FSmin for each examined rainfall pattern are indicated in Figure 6 to 9, respectively, for advanced, delayed, central, and uniform rainfall pattern. The histogram of FSmin was obtained from the MCSM. Then, the Shapiro-Wilk test for normality test [24] was applied to the distribution of FSmin for the four rainstorm patterns. Each FSmin from MCSM was found to be normally distributed in logarithmic scale as illustrated in lognormal distribution in Figure 6 to 9. Inclusion of the variability of input parameters into the combined model will produce a distribution of minimum FSmin values which will either converge or diverge. A diverging distribution would preclude the use of this method for design purposes. However, the distribution of minimum FSmin does appear to obey the central limit theorem, and converges to a normal distribution.
Table 2 presents the mean and coefficient of variances of the FSmin, and probability of failure of the slope subjected to various rainstorm patterns. In term of deterministic analysis, a slope is likely to fail if the factor of safety is equal or less than one (FS 1).
Figure 6. Distribution of the Minimum Factor of Safety for Advanced Rainfall Pattern
Figure 7. Distribution of the Minimum Factor of Safety for Delayed Rainfall Pattern
Time
Int
ens
it
y
(m
m
/h
) (a)
Time
Int
ens
it
y (m
m
/h)
(b)
Time
Int
ens
it
y (m
m
/h)
(c)
Time
Int
ens
it
y (m
m
/h)
Muntohar, A.S. et al. / Influence of Rainfall Patterns on the Instability of Slopes / CED, Vol. 15, No. 2, September 2013, pp. 120–128
125 Figure 8. Distribution of the Minimum Factor of Safety for Central Rainfall Pattern
Figure 9. Distribution of the Minimum Factor of Safety for Uniform Rainfall Pattern
Table 2. The Mean () and COVs of the FSmin, Probability of Failure (Pf) and Time of Failure (Tf)
Rainstorm pattern FSmin COV Pf Tf
Advanced 0.942 0.174 0.690 4
Delayed 1.023 0.179 0.492 13
Central 1.019 0.164 0.464 11
Uniform 0.971 0.174 0.603 8
TF = the mean value of the occurrence time of failure
(hours) which is calculated from the onset of rainfall
For the studied slope, it was observed that the advanced and uniform rainstorm pattern results in a low FSmin, which is 0.942 and 0.971, respectively, indicating that the slope was prone to failure. The delayed and central rainfall patterns result in FSmin about 1.023 and 1.017, respectively, which is near one, indicating the slope is in critical state. In order to be able to estimate Pf , it is necessary to estimate the standard deviations of the parameters involved in computing the factor of safety. It is observed from the FSmin distribution that the COV ranges from 0.164 to 0.174. A larger variation of the factor of safety is due to wide range of variation in the input parameter. Tang et al. [25] concluded that the shear strength parameters (c’ and ’) were the most influencing parameters. A large range of those parameters will result in wide range of factor of safety. The probability of failure of the slope is
computed about 0.690, 0.492, 0.464, and 0.603 respectively for advanced, delayed, central, and uniform rainfall patterns respectively. It seems likely that knowing the probability of failure was 46.4% would have caused one to consider the slope to be stable under the central rainfall pattern. Advanced and uniform rainfall patterns result in a high antecedent rainfall compared to the other rainfall pattern, hence the rainfall caused a higher failure probability. This is in agreement with the result found by Tsai [17].
Failure Occurrence of the Slope
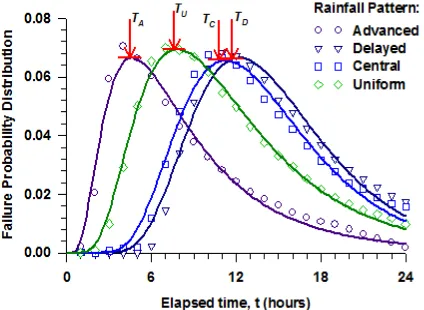
Figure 10 shows the PDF with respect to the elapsed time of rainfall. The calculated probability of failure using MCSM (noted with labels) are closer to the log-normal PDF (noted with lines). The estimated time of slope failure are indicated by the arrow which TA,
TC, TD, and TU representing time of failure for the advanced, central, delayed, and uniform rainfall pattern respectively. The figure demonstrates that the time of slope failure is essentially influenced by the rainfall distribution. The slope will fail as early as 4 hours (TA = 4 hours) when the rainstorm is simulated as an advanced rainfall pattern, whilst a longer time of failure (TD = 13 hours) is obtained for delayed rainfall pattern. In this study, it can be stated that the landslide occurrences will be quick during advanced rainfall and followed by uniform, central, and delayed rainfall pattern (TA < TU < TC <
TD) as presented in Table 2 and Figure 10. This result is in agreement with Tsai [17] and Ng et al. [22].
Figure 10. Probability of Failure versus Elapsed Time of Rainfall
Application of the Proposed Model
Tungmen landslide (Taiwan)
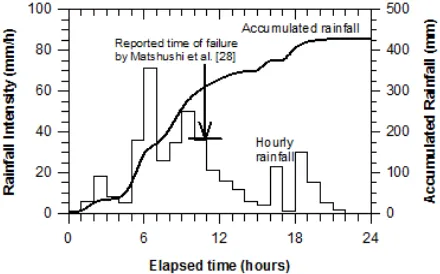
[26-27]. This storm brought heavy rainfall on the Tungmen area at 2 pm of 22 June which totaled 150 mm by 7 am on 23 June 1990. The rainfall restarted at 8 am and stopped at 4 pm on 23 June. The total amount of rainfall was 450 mm at the end of the typhoon. The landslide was reported after 24 hours of rainfall as recorded by Chen [26-27]. The rainfall distribution during the typhoon (Figure 11) can be considered as delayed pattern. The slope inclination was relatively constant about 20o. Geotechnical
properties of the studied area are presented in Table 3. The soil parameter is assumed to be log normally distributed.
Using the input parameter in Table 3, Figure 12 shows the distribution of the calculated factor of safety. The calculated minimum factor of safety is 1.02 and 0.373 for the mean and the deviation standard respectively. The factor of safety distri-bution in Figure 12 shows large variance of the factor of safety because of the large variance of the input parameter that result in a high uncertainty. The effect of the parameter uncertainty on the probability of slope failure was explained by Tang et al. [25]. In this case, the failure probability was about 0.369. According to the probability distribution with respect to time series (Figure 13), the time to failure can be determined at 2 pm on 23 June 1990. The predicted time of failure is in agreement with the reported landslide occurrence which was estimated around 1 pm to 2 pm on 23 June 1990 [26, 27]. The triggering rainfall can be estimated at that time is 448 mm. In other word, the landslide will be induced by the average hourly rainfall with intensity 17 mm/h prolonged 24 hours of rainfall.
Table 3. Parameters used for Tungmen Landslide Cases [26]
ks (m/s) f (m) c' (kPa) ' t (kN/m3) H (m) Mean: 5 x 10⁻⁴ 0.125 0.032 0 34.5o 20.6 3.5
COV: 0.32 0.32 1.2 0 0.05 0.43 0.43
Figure 11. Rainfall Pattern During Typhoon Ofelia at Tungmen Village, Hualien, Taiwan (modified from Chen [26])
Figure 12. Distribution of the Minimum Factor of Safety for Tungmen Landslide Case
Figure 13. Distribution of the Failure Probability with Respect to Time for Tungmen Landslide
Boso Peninsular Landslide (Japan)
Matsushi et al. [28] reported landslide case in the Boso Peninsula, Japan during a rainstorm on 1 August 1989. The rainfall hyetograph is illustrated in Figure 14. The rainstorm conveys a total amount of rainwater about 430 mm for 22 hours of rainfall. Heavy rainfall was prolonged for about 10 hours, and then decreases hereafter. The landslides occurrence was estimated at 11 am of 1 August 1989 [28] or about 11 hours after commencement of the rainstorm. The depth of sliding plan was measured at 0.6–0.7 m. The details of the site investigation and monitored slope are explained in Matsushi et al. [28]. The slope inclination was about 29o. The
geotechnical and slope properties of the studied slopes are presented in Table 4.
Muntohar, A.S. et al. / Influence of Rainfall Patterns on the Instability of Slopes / CED, Vol. 15, No. 2, September 2013, pp. 120–128
127 that failure probability measures of the degree of belief regarding the possible states of nature. Using the term of degree of belief, it can be stated that the slope was likely to fail since the failure probability was greater than 0.5.
Figure 14. Rainfall Pattern during Rainstorm at Boso, Japan (Modified from Matsushi et al. [28])
Table 4. Parameters used for Boso Peninsular Landslide Cases [28]
ks (m/s) f (m) c' (kPa) ' t (kN/m3) H (m) Mean: 1.05 x 10⁻⁵ 0.24 0.036 14.3 34.5o 16.98 1.21
COV: 0.69 0.33 0.85 0.84 0.32 0.11 0.39
Figure 15. Distribution of the Minimum Factor of Safety
Figure 16. Distribution of Failure Probability for Boso Peninsular Landslide
The failure probability distribution with respect to time for Boso Peninsula is shown in Figure 16. At the end of rainstorm, the slope is susceptible to slip with probability 0.573. Based on the PDF in Figure 16, it was observed that the slope was likely to fail after 11 hours prolonged rainstorm. It is about at 11 am on 1 August 1989 which is in agreement with Matsushi et al. [28]. The rainfall-triggered landslides can be estimated about 313 mm. The average hourly rainfall is 28.5 mm/h prolonged 11 hours of rainfall.
Conclusions
The four representative rainstorm patterns: uniform, advanced, central, and delayed rainstorms are used to conduct this examination. And the two landslides records at Tungmen (Taiwan) and Boso peninsular (Japan) have been also discussed. The results indicated that among the four representative rainstorm patterns, the advanced rainstorm has shorter time of landslide occurrence, followed by the uniform, central, and delayed rainstorm. Advanced rainfall pattern resulted in the highest failure probability and the lowest minimum factor of safety for the given slope properties. For each rainstorm pattern, the corresponding rainfall duration thre-shold decreases with the increase of rainfall amount. Thus, one can conclude that the shallow landslide is strongly affected not only by the rainfall amount and the rainfall duration of the rainstorm but also by the rainstorm pattern. The probabilistic analysis by using MCS method is suitable to estimate the time of failure for the studied landslide cases in Tungmen (Taiwan) and Boso peninsular (Japan). Probability of failure was a complementing step to enhance the degree of belief in analyzing the factor of safety. It is suggested that computing both factor of safety and probability of failure is better than computing either one alone.
Acknowledgement
This paper is part of the fundamental research entitled “Numerical and Experimental Studies of Rainfall Infiltration Induced Slope Stability”. Authors thank for the funding granted in 2011–2012 by the Directorate General of Higher Education, Ministry of National Education Republic of Indo-nesia. Authors also thank Yuki Matsushi, Ph.D (Disaster Prevention Research Institute, Kyoto University) for the data provided of Boso peninsular.
References
2. Green, W.H. and Ampt, G., Studies of Soil Physics, Part 1. The Flow of Air and Water through Soils, Journal of Agricultural Science, 4, 1911, pp. 1-24.
3. Kale, R.V. and Sahoo, B., Green-Ampt Infiltration Models for Varied Field Conditions: A Revisit, Water Resources Management, 25(14), 2011, pp. 3505-3536
4. Richards, L.A., Capillary Conduction through Porous Mediums, Physics, 1, 1931, pp 313-318.
5. Mishra, S.K., Tyagi, J.V., and Singh, V.P., Compa-rison of Infiltration Models, Hydrological Processes, 17(13), 2003, pp. 2629–2652.
6. Ma, Y., Feng, S., Zhan, H., Liu, X., Su, D., Kang, S., and Song, X., Water Infiltration in Layered Soils with Air Entrapment: Modified Green-Ampt Model and Experimental Validation. Journal of Hydrologic Engineering, 16(8), 2010, pp. 628-638.
7. Philip, J.R, Hillslope Infiltration: Planar slopes, Water Resources Research, 27(1), 1991, pp. 109– 117.
8. Muntohar A.S. and Ikhsan J., Numerical and Ex-perimental Studies of Rainfall Infiltration Induced Slope Stability, Final Report of Fundamental Research Grant, Universitas Muhammadiyah Yogyakarta–Directorate General Higher Educa-tion, Ministry of Education and Cultural, 2012.
9. Chow, V.T., Maidment, D.R., and Mays, L.W., Subsurface Water, in Applied Hydrology, Mc. Graw-Hill: New York, 1988.
10.Montgomery, D.R. and Dietrich, W.E., A Physically Based Model for the Topographic Control on Shallow Landslide, Water Resources Research, 30, 1994, pp. 83–92.
11.Wu, W. and Sidle, R.C., A Distributed Slope Stability Model for Steep Forested Basins, Water Resources Research, 31, 1995, pp. 2097–2110
12.Borga, M., Fontana, G.D., De Ros, D., and Marchi, L., Shallow Landslide Hazard Assessment using a Physically Based Model and Digital Elevation Data, Environmental Geology, 35, 1998, pp. 81– 88.
13.Iverson, R.M., Landslide Triggering by Rain Infiltration, Water Resources Research, 36(7), 2000, pp. 1897-1910
14.Crosta, G.B. and Frattini, P., Distributed Modeling of Shallow Landslides Triggered by Intense Rain-fall, Natural Hazard Earth System and Sciences, 3, 2003, pp. 81–93.
15.Collins, B.D. and Znidarcic, D., Stability Analyses of Rainfall Induced Landslides, Journal of Geotechnical and Geoenvironmental Engineering, 130(4), 2004, pp. 362–372.
16.Tsai T.L. and Yang J.C., Modeling of Rainfall-Triggered Shallow Landslide, Environmental Geology, 50(4), 2006, pp. 525–534.
17.Tsai, T.L., The Influence of Rainstorm Pattern on Shallow Landslide, Environmental Geology, 53(7), 2008, 1563–1570.
18.Xie, M.W., Esaki, T., and Cai, M.F., A Time-Space Based Approach for Mapping Rainfall-Induced Shallow Landslide Hazard, Environmental Geo-logy, 46(7), 2004, pp. 840-850.
19.Muntohar, A.S. and Liao, H.J., Rainfall Infiltration: Infinite Slope Model for Landslides Triggering by Rainstorm, Natural Hazards, 54(3), 2011, pp. 967–984.
20.Tobutt, D.C., Monte Carlo Simulation Methods for Slope Stability, Computers and Geosciences, 8(2), 1982, pp. 199–208
21.Wang, Y., Cao, Z., and Au, S.K., Practical Reliability Analysis of Slope Stability Bb Advanced Monte Carlo Simulations in a Spreadsheet, Canadian Geotechnical Journal, 48(1), 2011, pp. 162–172.
22.Ng, C.W.W., Wang, B., and Tung, Y.K., Three-Dimensional Numerical Investigation of Ground-water Responses in an Unsaturated Slope Subjected to Various Rainfall Patterns. Canadian Geotechnical Journal, 38, 2001, pp. 1049-1062.
23.de Lima, J.L.M.P. and Singh, V.P., The Influence of the Pattern of Moving Rainstorm on Overland Flow, Advanced Water Resources, 25, 2002, pp. 817–828.
24.Shapiro, S.S. and Wilk, M.B., An Analysis of Variance Test for Normality (complete samples), Biometrika, 52(3-4), 1965, pp. 591–611.
25.Tang, W.H., Stark, T.D., and Angulo M., Reliability in Back Analysis of Slope Failures, Soils and Foundations, 39(5), 1999, pp. 73-80.
26.Chen, H., The Geomorphological Comparison of Two Debris Flows and Their Triggering Mecha-nisms, Bulletin of Engineering Geology and the Environment, 58(4), 2000, pp 297-308.
27.Chen, H., Controlling Factors of Hazardous Debris Flow in Taiwan, Quaternary Internatio-nal, 147(1), 2006, pp. 3-15.
28.Matsushi, Y., Hattanji, T., and Matsukura, Y., Mechanisms of Shallow Landslides on Soil-Mantled Hillslopes with Permeable and Imper-meable Bedrocks in the Boso Peninsula, Japan, Geomorphology, 76(1-2), 2006, pp. 92-108.
![Figure 11. Rainfall Pattern During Typhoon Ofelia at Tungmen Village, Hualien, Taiwan (modified from Chen [26])](https://thumb-ap.123doks.com/thumbv2/123dok/449943.530041/8.595.303.522.88.228/figure-rainfall-pattern-typhoon-tungmen-village-hualien-modified.webp)