IMPROVEMENT OF PRODUCTION FACILITY LAYOUT WITH SYSTEMATIC LAYOUT PLANNING (SLP) ALGORITHM
Rachmad Hidayat1*
1 Industrial Engineering Department, University of Trunojoyo Madura, Indonesia
PO BOX 2 Kamal Bangkalan *Email: [email protected]
Abstract
The purpose of this study is to rearrangement of production floor layout of facilities so as to minimize the distance and material handling costs at the time of production. The study was conducted on a company that is Flow Shop. The layout of the facility is based on the flow of the production process and product produced more than 1 type by using different machines. Placement facility layout resulting in irregular distances and large material handling costs. Factor plant layout will greatly affect the timeliness in each process. Sets the layout engine in such a way, is expected to reduce waiting time, and cost of the process of moving goods (material handling). The smaller the range of material handling, better layout. So that the production process will remain smooth and controlled until the last process. In this study, the total distance of the initial layout compared to the proposed layout there is a reduction in material handling distance. Material handling costs also decreased when compared to the initial layout with the proposed layout. In this study, the proposed layout which has been designed to be implemented in the company with socialization to the management about the advantages of the proposed layout, including the distance and material handling costs smaller. The design layout can still be developed with computer simulations to design a model of the real system with the goal of understanding the behavior of the system and evaluate it to improve system performance. The production process will get optimal results when supported production planning and control mature. Other factors are also very important to note in order to obtain optimal results in a production process is taking into consideration the layout of the production machine. SLP method could form the answer to minimize the distance and cost of material handling.
Kata kunci: production proses, layout, material handling, SLP
1. INTRODUCTION
Manufacturing systems developed towards the achievement of high productivity. Directions are becoming increasingly widespread, due to the achievement of high productivity, manufacturing systems were also developed adaptability to change product specifications are made as well as its availability (Gopalakrishnan et. al., 2003). Dynamic enough demand for the product will be made an issue early. This demand dynamics associated with the uncertainty of the arrival of the request, the amount of demand, and the variation of the product. Consumers are also demanding the reliability of the product and the corresponding tolerance of the product. An increasing number of requests tend to lead to an increase in product variety, while the number of requests every stuff is getting smaller. A large variety of products resulted in more and more variations of components that have to be made (Taho et. al., 2000). Manufacturing systems required to be able to process a wide variety of components with the relatively small lot sizes. Preparation of layout of machinery and equipment which is usually called the plant layout is the basis of the design of manufacturing systems (Ram and Prashant, 2012).
whereas direct labor costs only 5 to 10 % of the total cost and tends to change continuously. (5) Reliability of product will rise in response to the excess amount of the corresponding product reliability. (6) The time between concept design and manufacture of products will be reduced through the support of simultaneous engineering. (7) The global market should be served with a new global product. All of these challenges can be answered by making the design layout of machinery and equipment, must be considered a factor flexibility, in the sense of being able to adapt to environmental changes according to the demands and tastes of consumers.
Plant layout is a procedure for setting the plant facilities to support the smooth production process. Settings by utilizing the existing area to put the engine and supporting production facilities that have an impact on the smooth motion of the material displacement. It is regulated and the engine department. In addition to these settings, the selection of one type of facility layout is also affected by production volume and product variety. The production process is a series of process of changing raw materials into semi-finished products or finished products. The production process will get optimal results when supported production planning and control mature. It also needs to be supported by the experienced labor factor, in the run up to the production of machine parts inspection. Other factors are also very important to note in order to obtain optimal results in a production process is taking into consideration the layout of the production machines (Donk and Gaalman, 2004). In general, the layout of the planned factory will also determine the efficiency and in some cases will also maintain the viability or success of the performance of a production process. Because production activity in an industrial should normally last long with the facility layout is not always changing, so any mistakes are made in the planning of the layout will cause losses that are not small. Material handling systems are less systematic also be a big problem and disrupting the production process thereby affecting the overall system. (Giuseppe et. al., 2012).
2. METHODS
2.1 Systematic Layout Planning (SLP)
The steps in planning SLP is (Wignjosoebroto, 2003), (Chien, 2004), (Natthapong, 2012): (1) Material Flow is the depiction of the flow of material in the form of OPC or FPC by using ASME symbols. This step will provide a basic foundation of how the layout of production facilities should be arranged in order of the product creation process. Especially applicable to the type of Product Layout. Here depiction trip of an area (work station) to another area on the basis of production volumes (2) Activity Relationship that indicates the desired degree of closeness of the department and work area in a factory. ARD describes the layout and analyze the relationship between departments or facilities that do not work can be demonstrated quantitatively by analysis of material flow. (3) Relationship diagrams is Determining the layout of the facilities based on the flow of work products (product flow) and relationship activities, regardless of the extent of the area. The initial step to define the layout of production facilities as well as possible based on quantitative and qualitative considerations. (4) and (5) step adjustment to the area required and available. The need in this area is strongly influenced by installed capacity (number of machines, equipment, and other production facilities to be accommodated). Space available will be greatly influenced by the existing land and building. (6) Space Relationship Diagram that takes into account the needs for size of the area to existing facilities as well as the wide availability of the SRD was made, namely the determination of facility layout with attention to the room. (7) and (8) Modifying Practical consideration and modification Limitation ie taking account of the building, the column layout, material handling systems and a causeway. (9) Alternate Layout Plan yatu make alternatives proposed layout can then be taken to the best alternative based on predetermined benchmarks. And (10) Decision alternatives, implementation and evaluation.
2.2 Computerized Relative Allocation of Facilities Technique
3. RESULT AND DISCUSSION
Figure 1. Initial layout of LVP department
Table 1. The distance between the machines in the production process of the initial layout
Product flow Mileage (m)
Boiling – Rotary 10
Rotary – Dryer 5
Dryer – Cutting Veener 16
Pony – Boiling 13
Boiling – Slicer 8
Slicer – Dryer 57
Dryer – RH Shin 10
Total 119
3.1 Material Handling Cost 3.1.1 Labor Costs
The company has 41 operators in LVP departments with different wages. Total of all wage of Rp 81,605,915. With the operator wage per day Rp 1,990,388.
3.1.2 Cost Forklift Cost Depreciation
Initial price = Rp. 20,000,000. Age Economical = 5 Years Residual value = Rp. 8,000,000.
The company has 3 forklifts and forklift hire 5. But in LVP department only uses 2 forklift. By using a model of straight line depreciation calculation, then the depreciation cost is obtained as follows:
( (1)
Rp. 13.333 / day
3.1.3 Fuel Cost
3.1.4 Total Cost For Forklift
Rp 13,333 + Rp 240,000 = Rp 253,333 / day
So material hadling cost/day is: Rp 1,990,388 + Rp 253,333 = Rp 2,243,721 / day.
3.1.5 Material Handling Cost/meter
Calculation of distance above the material handling can be calculated material handling cost / meter:
( (2)
From the calculation of the cost of material handling over the total material handling cost of LVP department is Rp 2,243,745 with details separti Table 2.
Table 2. The total cost of material handling
Ptoduct flow Mileage (m) Material Handling cost (Rp/m)
Total cost of Material Handling
Boiling – Rotary 10 18855 188550
Rotary – Dryer 5 18855 94275
Dryer – Cutting Veener 16 18855 301680
Pony – Boiling 13 18855 245115
Boiling – Slicer 8 18855 150840
Slicer – Dryer 57 18855 1074735
Dryer – RH Shin 10 18855 188550
Total 119 2243745
3.1.6 Total Closeness Rating (TCR)
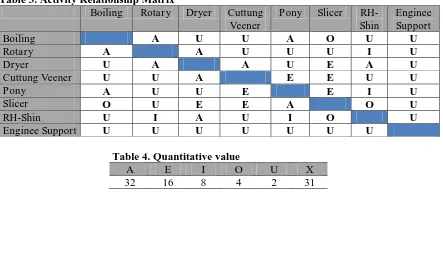
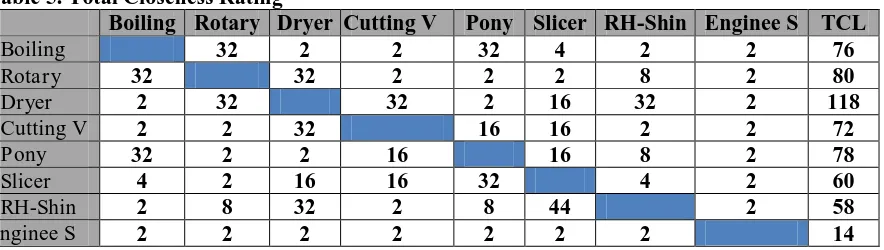
Calculation of total closeness Rating obtained by quantifying the relationship between departments. Given the activity Relation Matrix as shown in Table 3, the quantification can be done with a value corresponding to table 4. After all the values in the matrix close relationship quantified, then the sum to determine the value of total closeness Rating each department. The results are shown in Table 5.
Table 3. Activity Relationship Matrix
Boiling Rotary Dryer Cuttung Veener
Pony Slicer RH-Shin
Enginee Support
Boiling A U U A O U U
Rotary A A U U U I U
Dryer U A A U E A U
Cuttung Veener U U A E E U U
Pony A U U E E I U
Slicer O U E E A O U
RH-Shin U I A U I O U
Enginee Support U U U U U U U
Table 4. Quantitative value
A E I O U X
Table 5. Total Closeness Rating
Boiling Rotary Dryer Cutting V Pony Slicer RH-Shin Enginee S TCL
Boiling 32 2 2 32 4 2 2 76
Rotary 32 32 2 2 2 8 2 80
Dryer 2 32 32 2 16 32 2 118
Cutting V 2 2 32 16 16 2 2 72
Pony 32 2 2 16 16 8 2 78
Slicer 4 2 16 16 32 4 2 60
RH-Shin 2 8 32 2 8 44 2 58
Enginee S 2 2 2 2 2 2 2 14
The total layout area of production floor LVP Departemen of 5,896 m². Each box will represent an area of 3.8 m, so it needs a box for each department can be calculated and obtained the results as shown in Table 6.
Table 6. Space requirements for each machine
TCL Space Requirements Boxes Number
Boiling 76 840 60
Rotary 80 336 24
Dryer 118 336 24
Cuttung Veener 72 266 19
Pony 78 910 65
Slicer 60 252 18
RH-Shin 58 1582 113
Enginee Support 14 966 269
3.2 Determination of Proposed Layout Using CRAFT
Figure 2. Schematic layout of the proposed using CRAFT
E = Dryer engine
F = Cutting Veener engine G = RH-Shin engine H = Enginee Suppor
Figure 3. Schematic layout of the proposed
3.2.1 Distance and Material Handling Cost Proposed Layout
Distance calculation is done by measuring the distance the material flow path on the production and assembly activities. Measurements were made of the distance between the center of the central departments of other departments. Calculation of distances between departments on the proposed layout can be seen in the Table 7.
Table 7. Distance between the trajectory of the proposed facility layout work Product flow Mileage (m)
Boiling – Rotary 10
Rotary – Dryer 5
Dryer – Cutting Veener 9
Pony – Boiling 13
Boiling – Slicer 8
Slicer – Dryer 57
Dryer – RH Shin 12
Total 114
The analysis showed that the displacement distance on the layout of the proposed is 114 meters, 5 meters distance closer than ever before. While the total material handling costs in the proposed layout of Rp 2,149,470 or the amount of Rp. 94,275 less of the previous material handling cost.
Table 8. The total cost of material handling layout proposal Ptoduct flow Mileage (m) Material Handling
cost (Rp/m)
Total cost of Material Handling
Boiling – Rotary 10 18855 188550
Rotary – Dryer 5 18855 94275
Dryer – Cutting Veener 9 18855 169695
Pony – Boiling 13 18855 245115
Boiling – Slicer 8 18855 150840
Slicer – Dryer 57 18855 1074735
Dryer – RH Shin 12 18855 226260
4. CONCLUSION
Redesigning the layout of production using SLP algorithms with the help of CRAFT software to minimize the distance of production process, because SLP algorithm and CRAFT software designed by level of importance and closeness of the machine. In the new layout engine area needs as much as 414 box, with a length of 1 box represent is 3.8 meters. So the total area required is 1573.2 m2. While the differences in the material handling distance between the initial layout and the proposed layout is 5 meters or a decline of 2%. In the initial layout, the total material handling distance is 119 meters, whereas the total material handling distance of the proposed layout is 114 meters. With the reduction of the total distance of material handling, then the less the material handling costs of production processes. Material handling costs on the initial layout is Rp 2,243,745, while the material handling costs on the proposed layout is Rp 2,149,470. Difference in material handling costs on both the layout is Rp 94,275 or a decline of 2%.
REFERENCES
Black. JT. 1974. The Design of the Factory with A Future Research. London: Taylor and Francis. Chien, Te—King. 2004. An empirical study of facility layout using a modified SLP procedure.
Journal of Manufacturing Technology Management, Vol. 15 Iss: 6 pp. 455 – 465.
Donk, D.P. Van and G. Gaalman. 2004. Food Safety and Hygiene: Systematic Layout Planning of Food Processes, Chemical Engineering Research and Design, 82(11), 1485-1493.
Giuseppe Aiello, Giada La Scalia, and Mario Enea, 2012. A multi objective genetic algorithm for the facility layout problem based upon slicing structure encoding, Expert Systems with Applications, 39(12), 2012, 10352-10358.
Gopalarishnan B., Li Weng and D.P. Gupta, (2003), Facilities design using a split departmental layout configuration. Facilities, Vol. 21 Iss: 3 pp. 66 – 73.
Meller R.D., Chen W., Sherali H.D. 2007. Applying the sequence-pair representation to optimal facility layout designs. Operations Research Letters, 35(5), 651–659.
Natthapong Nanthasamroeng, Kanokwan Supakdee, Tasapong Klaewthanong, Pawinyada Boonrom, Chet Srimaitree and Peerasak Kittisriworapan. 2012. Systematic Layout Planning for Germinated Brown Rice Mill under GMP and ISO22000:2005 requirements. IOSR Journal of Engineering (IOSRJEN) Volume 2, Issue 10 (October 2012), PP 35-40.
Ram D. Vaidya and Prashant N. Shende. 2012. Design and Improvement of Plant Layout. International Journal on Theoretical and Applied Research in Mechanical Engineering (IJTARME). Volume-1, Issue-2. Pp. 99-103.
Sherali, H.D., Fraticelli, B.M.P., Meller, R.D., 2003. Enhanced model formulations for optimal facility layout. Operations Research, 51(4), 629–644.
Taho Yang, Chao-Ton Su, Yuan-Ru Hsu, (2000). Systematic layout planning: a study on semiconductor wafer fabrication facilities. International Journal of Operations & Production Management. Vol. 20 Iss: 11 pp. 1359 – 1371.