THE EFFECT OF EARNINGS MANIPULATION WITH USING M-SCORE ON STOCK RETURN
(Empirical Evidence in Indonesia Listed Companies on LQ45 at Indonesia Stock Exchange Period 2009-2011)
William Christianto
Pratiwi Budiharta
International Financial Accounting Program Economic Faculty Universitas Atma Jaya Yogyakarta
Jalan Babarsari Number 43-44, Yogyakarta
ABSTRACT
Beneish M-score model is the detection tool to help to uncover companies who are likely to be manipulating their reported earnings. Companies with a higher M-score are more likely to be manipulators. This is a probabilistic model, so it will not detect manipulators with 100% accuracy. This research has an objective to prove earnings manipulation detection using Beneish M-score model has an impact to stock return in Indonesia listed companies on LQ45 at Indonesia Stock Exhange period 2009-2011.
Data used in the form of secondary data and were obtained using secondary archival data collection methods. Independent variable in this research is Earnings Manipulation which was detected using M-score Beneish Model, control variables are Leverage and Book to Market Value, and dependent variable in this research is Stock Return that is represented by Cumulative Abnormal Return (CAR). Sample of the research used purposive sampling with goal to obtain criteria sample.
Through the data analysis, it is concluded that the hypothesis is accepted, it means earnings manipulation with using M-score has negative influence to stock return.
Keywords: Earnings manipulation, M-score Beneish Model, and Cumulative
I. INTRODUCTION
Background of the Problem
Earnings management currently is a central issue and has become a phenomenon that occurs in some amount of companies. Based on the capital market regulatory agency reports there are 25 cases of violation of capital markets that occurred during the year 2002 up to March 2003. From the 25 cases, there were 13 cases of violations related to conflict of interest and disclosure of information (Utami, 2005). Than that in 1998 up to 2001, there were many financial scandals in public companies with issues involving financial reporting issued.
Whereas according to the results of a comparative study conducted by Leuz in Purnomo and Pratiwi (2009) about earnings management and investor protection (observation period 1990 to 1999) showed that Indonesia is at the middle level in the order of 15 to 31 sample countries. When compared to other ASEAN countries equally were selected as a sample such as Malaysia, Philippines and Thailand, then Indonesia has the highest level of earnings management (Purnowo and Pratiwi, 2009).
Asymmetry between management (agent) with the owner (principal) provides the opportunities for managers to act opportunistically. In terms of financial reporting, managers can perform earnings management to mislead the owner (shareholder) of the company's economic performance. Earnings manipulation practices in the capital market were not only occurred in Indonesia such as PT. Lippo Bank, PT Kimia farma, and PT KAI, but also other countries, such as Enron Corporation, World.com and Walt Disney Comp.
Some cases above showed that earnings manipulation practices in financial reporting are not a new thing. cruelty of the market and high competition have given rise to an impulse or pressure on securities firms to compete with the quality and good performance, no matter whether the means used are allowed or not. This is a challenge for prospective investors in assessing whether the content of the information contained role in the financial statements reflect the facts and the actual values or just the result of window dressing management.
Therefore, to detect earnings manipulation researcher used M-score (probability of manipulation). We posited that the M-score generated by the model
will be informative of a company’s returns. The reason is that the “profile of a typical earnings manipulator” as defined by Beneish (1999a) is a company that is (1)
growing quickly (extremely high year-over-year sales growth), (2) experiencing deteriorating fundamentals (as evidenced by a decline in asset quality, eroding profit margins, and increasing leverage), and (3) adopting aggressive accounting practices (e.g., receivables growing much faster than sales, large income-inflating accruals, and decreasing depreciation expense) (Beneish, Lee, and Nichols, 2013).
manipulation could be detected by M-score model. Than in 2013, research was continued and from his table suggests that flagged companies (those that merely look like a manipulator) are associated with lower returns. From the result in Beneish 2013 also showed evidence that companies with a higher probability of manipulation (M-score) earned lower returns.
Therefore, in this paper researcher want to research in the phenomenon of earnings manipulation in Indonesia with using M-score and the main focus of this study is stock return related with M-score as the model.
Formulation of the Problem
Based on the research background was described above, it can be identified the research problem wants to be investigated:
Does earnings manipulation in Indonesia using M-score has negative impact on stock return?
Objective of the Research
Based on the research question above, researcher has objective in conducting the research, which is:
To provide empirical evidence about relationship between earnings manipulation in Indonesia using M-score and stock return as an indicator that investors find earnings information to be useful and relevant.
2. HYPOTHESIS DEVELOPMENT
Earnings Manipulation is the other side of earnings management. Earnings manipulation is possible while carrying out earnings management if the financial report preparers violate accounting statutes and guidelines.
In Beneish model (1999) used M-score to help to uncover companies who are likely to be manipulating their reported earnings. Companies with a higher score are more likely to be manipulators. This is a probabilistic model, so it will not detect manipulators with 100% accuracy. This model features eight accounting-based variables, each of which is so constructed that higher values are associated with a greater probability of earnings manipulation. The variables consist of: Days Sales in Receivables Index (DSRI), Gross Margin Index (GMI), Asset Quality Index (AQI), Sales Growth Index (SGI), Depreciation Index (Depi), General and Administrative Expenses Sales Index (SGAI), Leverage Index (LVGI), Total Accruals to Total Assets (TATA). Therefore, earnings Manipulation according to this model is a company that has an M-score exceeded -1.78.
indicated by the change in price stock exceeds normal conditions, giving rise to abnormal return (Zaqi, 2006).
Financial report is one of the important information to investors because it can be used as a basis for decision making (buy or sell stock) in the capital market. The financial statements have information content that can reduce the uncertainty or change the expectations of the investors when they wanted to invest. In Jogiyanto (2000), financial report publication has impact on market. According to his
observation, there is investors’ reaction towards share ordinary earnings of
publications around the date of publication. Testing for the publication of the information content of annual earnings report found evidence that this will have an impact on the earnings announcement to abnormal stock price performance. Its mean market will react on financial report announcement.
The result of earnings manipulation will impact to the lower quality of earnings. Here, the impact of lower quality of earnings will impact to investor will make a decision to reduce stock demand. Then, the impact of lower stock demand will go to the lower stock price and decreasing company return as the impact. So, as the decision maker, investor needs to determine first their decision to invest or not to the company especially company which conducted earnings manipulation activities. So, based on the description above, researcher concluded this hypothesis below:
Ha: Earnings manipulation with using M-score has negative impact to stock return
3. RESEARCH METHODOLOGY
Population and Research Sample
The study population is companies in Indonesia, which are listed on Indonesia Stock Exchange. The sample is selected using purposive sampling method. Samples in this study were selected with the following criteria:
1. Companies listed on LQ45 in Indonesia Stock Exchange from the year 2009 until 2011.
2. Exclude financial institutions from the year 2009 until 2011.
4. Stock price data (closing price) 3 days before, on date day, and 3 days after financial report was published, Index LQ45 and the date of financial report published from the year 2009 until 2011 are accessible and exclude without stock price data and the date of financial report published.
There are 75 samples to be tested for the M-score. The companies were selected for used more than 1 year, thus the total number of companies used as samples are 39 companies.
Independent Variable
Earnings manipulation is proxied by a dummy variable. Companies which are categorized as manipulator will be scored 1 and the non-manipulator will be scored 0. The M-score is calculated using the following formula:
M-score= -4.84 + 0.92*DSRI + 0.528*GMI + 0.404*AQI + 0.892*SGI + 0.115*DEPI - 0.172*SGAI + 4.679*TATA - 0.327*LVGI
A company is categorized as manipulator if the M-score exceeded -1.78 and non-manipulator if the M-score did not exceeded -1.78. Thus, to calculate M-score with calculated using the variables below:
1. Days Sales Receivables Index (DSRI)
= (Receivablest / Salest) / Receivablest-1 / Salest-1)
(DSRI is the ratio to captures distortions in receivables that can result from revenue inflation)
2. Gross Margin Index (GMI)
= [(Salest-1 - COGSt-1) / Salest-1] / [(Salest - COGSt) / Salest]
(GMI is described as deteriorating margins predispose companies to manipulate earnings).
3. Assets Quality Index (AQI)
= [1 - (Current Assetst + PP&Et ) / Total Assetst] / [1 - ((Current Assetst-1 + PP&Et-1 ) / Total Assetst-1)]
(AQI is ratio to captures distortions in other assets that can result from excessive expenditure capitalization)
= Salest / Salest-1
(SGI is described as managing the perception of continuing growth and capital needs predisposes growth companies to manipulate sales and earnings)
5. Depreciation Index (DEPI)
= (Depreciationt-1/ (PP&Et-1 + Depreciationt-1)) / (Depreciationt / (PP&Et + Depreciationt))
(DEPI is the ratio to captures declining depreciation rates as a form of earnings manipulation)
6. Selling, Growth, and Administrative Index (SGAI) = (SG&A Expenset / Salest) / (SG&A Expenset-1 / Salest-1)
(SGAI is the ratio to describe decreasing administrative and marketing efficiency (larger fixed SGA expenses) predisposes companies to manipulate earnings)
7. LVGI
= [(Current Liabilitiest + Total Long Term Debtt) / Total Assetst] / [(Current Liabilitiest-1 + Total Long Term Debtt-1) / Total Assetst-1]
(LVGI is the ratio to describe increasing leverage tightens debt constraints and predisposes companies to manipulate earnings)
8. TATA
= (Income from Continuing Operationst - Cash Flows from Operationst) / Total Assetst
(TATA is ratio to captures where accounting profits are not supported by cash profits)
Dependent Variable
Dependent variable in this research is stock return. Here, in this research, stock return which will be used is abnormal return. Abnormal return is the difference between actual return and expected return. Stock return will be calculated by Cumulative abnormal return as the proxies which are results from add up the abnormal return during windows period.
Stock return can be found in this calculation below:
Actual Return = Pt– P(t-1) / P(t-1)
Where:
Pt = stock price on day t P(t-1) = stock price on day t-1
2. To calculate expected return, researcher will use Market adjusted model. This model estimates a security return with market index return on that moment which will be calculated on this below formula:
Rm,t = LQ45t - LQ45 (t-1) \ LQ45 (t-1)
Where,
Rm,t =market index return LQ45t =LQ45 index on day t LQ45 (t-1) = LQ45 index on day t-1
3. To Calculate abnormal return on this below formula: ARi,t = Ri,t – E(R i,t)
Where,
ARi,t = abnormal return security to-i on event period to-t
Ri,t = actual return that happened for security to-i on event period to-t
E(Ri,t) = Expected return security to-i for event period to-t
4. To find Cumulative Abnormal Return (CAR) with add up all of the abnormal return in windows period for each company to-i or can be conducted on this formula:
CAR i,t = ∑ ta=t3 AR i,n
Where,
CAR i,t = Cumulative abnormal return security to-i on day t which accumulated from abnormal return security to-I start on event period (t3) until day to-t
Control Variables
A. Leverage
Widyaningdyah (2005) stated that leverage as the tool to measure the fund that were borrowed to buy and maintenance the assets. This variable is calculated by total assets divided by total liabilities.
LEVERAGE = TOTAL LIABILITIES / TOTAL ASSETS
Therefore, in Trisnawati (2009) stated if the value of leverage became higher, it means total liabilities higher than total assets. It is mean company have probability to manage the earnings because company got default, it is mean company have probability cannot pay their liabilities on time. Looking on this situation, companies make some action with make policies to increase revenue or earnings. It is mean higher of leverage make an impact on higher probability of earnings manipulation. B. Market to Book Ratio
Companies with a high market book value will tend not to do earnings management. This is due to the high value of stock market showed a good performance of the company (Kurniawan, 2013). This variable is calculated by
Number of shares outsanding x price of per shares Total Equity
The information of shares outstanding is come from financial statement, in notes to consolidated financial statements, in capital stock. For price of per shares, the information is come from the closing price when the company issued the financial statements.
4. DATA ANALYSIS AND DISCUSSION
Before data analysis can be done, data are compiled in the following steps: 1. Calculating 8 variables in M-score model from 75 samples.
(The data results of the first and second steps are presented on appendix number 4, 5, and 6)
3. After calculated M-score and got the results from 75 samples, researcher will categorize companies as manipulator if the M-score exceeded -1.78. From the results of calculation with 75 samples, 18 samples have an M-score exceeded -1.78 and those companies are suspected as earnings manipulator.
4. Therefore, 75 samples will be used to test the hypothesis with using dummy variable (1= manipulator, 0= non-manipulator).
Data Analysis
In this research, to test the model I used normality test with Kolmogorov-Smirnov and the result stated that the data have normal distribution, for heteroscedasticity I used Glejser Test and the result there is no heteroscedasticity, for multicollinearity test stated that there is no multicollinearity between variables. For autocorrelation, I used run test and the result stated that there is no autocorrelation. Hipothesis Testing
The research hypothesis was tested using multiple linear regression analysis
on the level of confidence 95% or 5% significance level (α = 5%). This analysis used
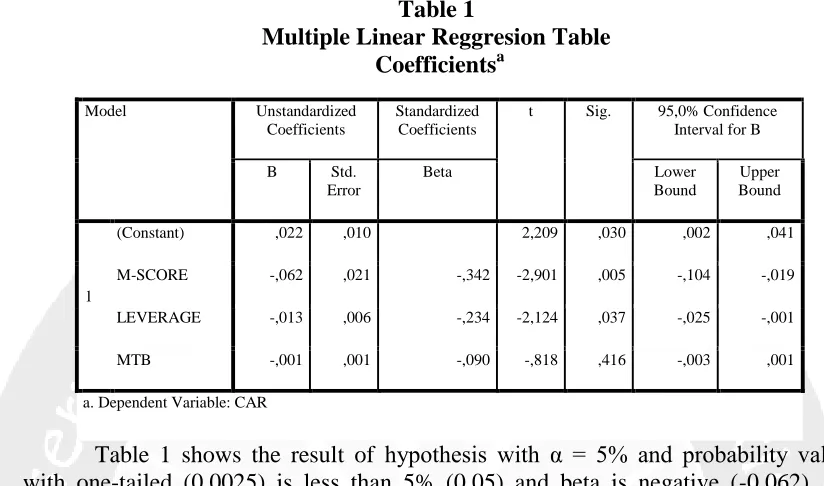
Table 1
Multiple Linear Reggresion Table Coefficientsa
Model Unstandardized Coefficients
Standardized Coefficients
t Sig. 95,0% Confidence Interval for B
B Std. Error
Beta Lower
Bound
Upper Bound
1
(Constant) ,022 ,010 2,209 ,030 ,002 ,041
M-SCORE -,062 ,021 -,342 -2,901 ,005 -,104 -,019
LEVERAGE -,013 ,006 -,234 -2,124 ,037 -,025 -,001
MTB -,001 ,001 -,090 -,818 ,416 -,003 ,001
a. Dependent Variable: CAR
Table 1 shows the result of hypothesis with α = 5% and probability value with one-tailed (0.0025) is less than 5% (0.05) and beta is negative (-0.062). Its means Ha is accepted. So, it can be concluded that earnings manipulation negatively affect stock returns. For the control variables, leverage can be seen have probability value is 0.037 and beta is negative (-0.013), and MTB can be seen have probability value is 0.416 and beta is negative (-0.001).
Discussion
Cruelty of the market and high of competition have given rise to an impulse or pressure on securities firms to compete with the quality and good performance as their action. No matter whether the ways used are allowed or not. “Profile of a typical
earnings manipulator” as defined by Beneish (1999a) is a company that is (1)
growing quickly (extremely high year-over-year sales growth), (2) experiencing deteriorating fundamentals (as evidenced by a decline in asset quality, eroding profit margins, and increasing leverage), and (3) adopting aggressive accounting practices (e.g., receivables growing much faster than sales, large income-inflating accruals, and decreasing depreciation expense) in their financial report (Beneish, Lee, and Nichols, 2013). Therefore, to detect earnings manipulation, this thesis use Beneish M-score model. Suspected companies have M-score value exceeded -1.78. There are 18 suspected samples from 75 samples used as samples in this thesis; it is about 24% from total samples.
results of manipulation. The information in manipulated earnings causes the investor to react negatively which results in a lower stock return. Since the market reacted toward earnings manipulation, it means that the earnings information has information content, the market is able to detect potential manipulation in these earnings number. 5. CONCLUSIONS
Conclusions
The objective of this research wants to prove whether earnings manipulation detection by Beneish M-score model has an impact on stock return. From data analyses which are presented in chapter IV, it is concluded that hypothesis is accepted. It means that earnings manipulation negatively affect stock returns.
Limitations and Suggestion
REFERENCES
Abarbanell, J., and B. Bushee. (1997). Fundamental analysis, future earnings, and stock prices. Journal of Accounting Research 35 (Spring): 1-24.
Aljifri, Khaled. (2007). Measurement and motivations of earnings management: A critical Perspective. Journal of Accounting-Business and management 14: 75-95.
Beneish. (1999a). The Detection of Earnings Manipulation. Financial Analysts
Journal, vol. 55,(September/ October):24–36.
Beneish, Lee, and Nichols. (2013). Detection Earning Manipulation. Financial
Analyst Journalvolume 69:2 Bergstresser, D., dan Philippon, T. (2006).CEO
Incentives and Earnings Management. Available on-line at http://pages.stern.nyu.edu/~tphilipp/papers/dbtp.pdf.
Bruns and Merchant. (1990). The Ethics of Managing Earnings: An Empirical Investigation. Journal of Accounting and Public Policy. p. 79–94.
Dechow, P. M R.G. Sloan, and A.P. Sweeney. (1995). Detecting Earnings Management. The Accounting Review, April Vol. 70 No. 2.
Fama, E. F., and K. R. French. (1992). The cross-section of expected stock returns.
Journal of Finance 47 (June): 427-465.
Gideon SB Boediono. (2005). Kualitas Laba: Studi Pengaruh Mekanisme Corporate Governace dan Dampak Manajemen Laba dengan Menggunakan Analisis Jalur. Simposium Nasional Akuntansi VIII, IAI, 2005.
Hartono, Jogiyanto. (2010). Teori Portofolio dan Analisis Investasi, Yogyakarta: BPFE UGM,
Hartono, Jogiyanto. (2010). Metodologi Penelitian Bisnis. Yogyakarta : BPFE UGM
Healy, P., and J. Wahlen. (1999), “a Review of The Earnings Management Literature and Its Implication for Standard Setting”, Accounting Horizons, 13 (4), 365
383
Horngren. (1998). Introduction to Management accounting. ISBN
Paltrow, S.J. (2002). Accounting for the Fall: Accounting Scandals have some
Purnomo dan Pratiwi. 2009. Pengaruh Earning Power Terhadap Praktek Manajemen Laba. Jurnal Media Ekonomi volume 14: 1.
Rahmawati, Sri Seventy Pujiastuti, dan Anastasia Riani Suprapti. 2010. Model Strategi Manajemen Laba Pada Perusahaan Publik Di Bursa Efek Indonesia: Suatu Pemeriksaan Pergeseran Klasifikasi Serta Dampaknya Terhadap Kinerja Saham, Pemilihan Metoda Akuntansi, Klasifikasi Akuntansi, Dan Pengaturan Waktu Transaksi. Jurnal Akuntansi UNTAR, Januari tahun XIV no. 01.
Pernyataan Standar Akuntansi Keuangan Revision (2009), accessed from http://iaiglobal.or.id on May 2014
Richardson, V. J. (1998). Information Asymmetry and Earnings Management: Some Evidence. http:/www.ssrn.com.
Roychowdury,S. (2006). Earnings Management through Real ActivitiesManipulation, JournalAccounting and Economics 42: 335-370
Surifah. (2001). Studi Tentang Indikasi Unsur Manajemen Laba Pada Laporan Keuangan Perusahaan Publik Di Indonesia. Kajian Bisnis.
Scott, W.R, (2003). Financial Accounting Theory. Third Edition, Pearson Education Canada In., Toronto, Ontario
Sloan, R.G. (1996). “Do Stock Prices Fully Reflect Information in Accruals and Cash Flows about Future Earnings?” The Accounting Review, Vol. 71, No. 3. July, 1996: 289-315.
Weygand, Kieso, Kimmel. (2008). Accounting Principle, 8th Edition, John Wiley & Sons, Asia