TRANSFORMATION OF BED SURFACE STRUCTURES AFTER A SERIES OF RELATIVELY SHORT HYDROGRAPHS
Yusron Saadi
Lecturer, Department of Civil Engineering, Faculty of Engineering, University of Mataram, Jalan Majapahit 62, Mataram 83125, Lombok– NTB
E-mail : [email protected]
ABSTRACT
This paper reports on a laboratory experiments in which a bimodal sediment bed was exposed to an antecedent flow hydrograph followed by a stability test. The applications of these hydrographs were intended to observe the development of bed surface structures after certain duration of exposure by the flow. Probability distributions of bed surface elevations was carried out to estimate the level of grain exposure and the variations of bed surface level. Bedload transport rates were also observed to obtain correlation with the changes in bed topography. The results suggest the changes in bed topography from original condition to the final form. It is evident that the bed surface structure has changed considerably during antecedent flow in which the average bed surface elevation decreased by almost 2.792 mm. Highly exposed areas appeared on the bed after antecedent flow test were removed and no longer exist after stability test. At this stage further erosion continued but with a mere 11.82 % decreased in the bed surface elevation. This indicates the level of erosion during antecedent flow test was significantly different than that during stability test. This study also reveals that the transported bedload during the stability test was dominated by grains in the coarse mode.
Keywords: bimodal sediment, antecedent flow, stability test, bed topography
INTRODUCTION
Changes in bed topography are subjected to the erosion and sediment transport processes. The evolution of a streambed, both in composition by size fraction and variation in elevation with time, is determined not only by the magnitude of the total sediment discharge, but also by how much sediment in each size fraction is transported by the flow (Karim, 1998). In order to fully characterise a gravel bed surface, some researchers have claimed that the measurement of bed texture is necessary as well as a grain size distribution analysis. However, it appears unlikely that the grain size distribution of the bed surface can be linked directly to its surface topography as the bed topography of a surface will also be dependant on the flow history and the type and amount of sediment moved over it (Furbish, 1987). Natural streams exploit widely graded materials to create critically stable conditions on the bed, but the condition is not simply maintained because of the fluctuating flows (Church et al, 1998). It is believed that the degree of structural development depends on the history of recent flows. Therefore the effect of flow history may be important on the behaviour of bed material transport in natural rivers. The grain size distribution of surfaces gives indirect indications of the relative proportions of sheltered to sheltering grains. Topographical measurements will hopefully indicate the potential
LITERATURE REVIEW
and therefore channel stability by dramatically reducing the transport of bed material. However, a range of material sizes is obviously necessary for recognisable structures to develop.
Under a wide range of flow conditions, the transport of heterogeneous sediment leads to the development of a bed surface that is coarser than the subsurface bed material. This coarse surface layer is normally called a bed armour surface. The prevalence of bed armour in gravel bed rivers has led to interest in the evolution of stable armours (Parker and Sutherland, 1990). Regarding the stable armours evolution, Gomez (1994) found that the development of a stable armour is normally associated with the winnowing of fine grain sizes from the bed. Armour layers also formed under conditions of partial bedload transport, in which the composition of transported fraction is not the same as the bed surface composition (Saadi and Tait, 2001).
The bed is said to be armoured if the concentration of immobile material is dense enough to stabilise the bed surface and prevent the further removal of any of the finer underlying material (Bray and Church, 1980) or in some circumstances the transport rate is reduced to zero (Tait et al, 1992). Armouring process is possibly occurred at sufficiently low shear stress where only part of the smaller grain sizes has been removed. As the result of this removal, coarser material will accumulate in the surface layer, which is protected from further erosion at the prevailing flow condition.
At this point the bed has developed a stable armour coat. The stable grain can not be found in the condition that the critical shear stress higher than
the critical value, is applied to the bed, e.g. during flood in natural rivers. The erosion process will continue until for some reason the shear stress is reduced. If the constant discharge is applied to the laboratory flume, the erosion will eventually lead to a reduction of the bed slope (Gessler, 1991). As the consequences the bed shear stress will drop to some extent allowing the stabilisation process become possible.
Development of surface structure is self-organised and its timescale, which occurs at relatively low rates of sediment transport, is long in comparison with typical fluctuations in water discharge. Most of the time, conditions are either subcritical, in the sense that the flow is insufficient to disturb the bed significantly, or the stresses applied by the flow create a transient situation in which the bed is adjusting toward a new critical state. A consequence is that most gravel bed streams are probably not in equilibrium with imposed flows of typically limited competence (Church et al, 1998). There is a lot more work to be done on the subject of water-sediment interaction and resulting morphology.
EXPERIMENTAL WORKS
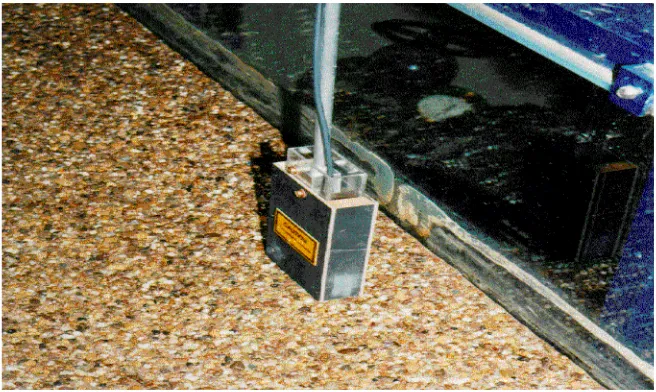
[image:2.595.144.472.522.718.2]The laser displacement meter traversed the grid at 1.0 mm intervals both in streamwise and lateral directions where bed position reading was taken (Figure 1). This interval was selected in order to cover the close range of the bed surface variations.
The primary requirement used to select the sediment mixtures for this experiment was that the mixture must have a range in grain sizes and must be similar in nature to the natural sediment that exist in many rivers. The mixture has two modes with finer mode and coarse mode being at approximately 0.355 mm and 5.60 mm. The geometric standard deviation is 3.42 and d50 is 5.19 mm. No sediment was input at
the upstream inlet to the flume. The concept was to carefully place the mixture from the electric mixer. The mixing time was long enough to produce a well-mixed sediment bed. The changes in the bed surface structure were analysed based on the bed elevation data obtained from the measurement. The topography of the bed surface were measured before and after the antecedent flow applied to the bed. These were compared with the final measurement after stability test. The hydrograph used for the antecedent flow was a three-hour steady flow with constant discharge of 0.0338 m3/s. The stability of
the beds was observed by the application of a shorter hydrograph with one-hour increasing limb followed by another hour of declining flowrate with a maximum discharge of 0.0375 m3/s.
RESULTS AND DISCUSSION
Bed Surface Changes
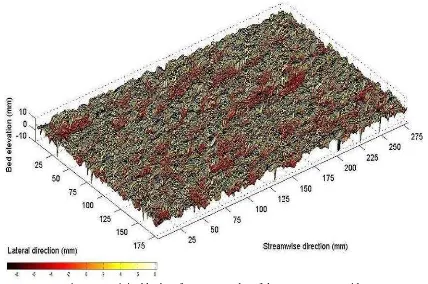
[image:3.595.75.503.391.675.2]The observations show the changes of bed topo-graphy in the measurement grid from original bed condition to the final form. The patterns of changes can easily be recognised by looking at the represented plot of bed surface for each stage of experiments (see Figure 2, Figure 3 and Figure 4 respectively). The bed surface seen in Figure 2 shows little valley formed bed formation. This observation possible because of the spacing measurement of 1 mm allowed the bed surface elevation to be plotted in more details so that small differences in the bed surface are visible. The average bed surface level of original bed is 1.923 mm above the arbitrary zero datum.
Figure 3. Bed surface topography of the measurement grid after antecedent flow test
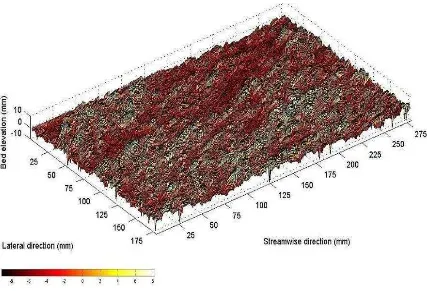
[image:4.595.97.524.363.654.2]It is clear in Figure 3 that the original bed has eroded and the bed surface structure has changed significantly during antecedent flow. The bed surface topography after steady antecedent flow test formed diagonal patches. Different bed surface formations than that in the original bed become apparent particularly elongated valleys and peaks are established in the measurement area. The average bed surface elevation is 0.869 mm below the zero datum, which means the average bed surface level decreased by almost 2.792 mm from the average original bed level. Figure 3 also shows the irregularity in the erosion processes with some small areas of higher elevation indicating the presence of several isolated larger grains. A valley existed on the bed surface after antecedent flow in the area of 125 to 200 mm in streamwise direction (x-direction) and 50 to 75 mm in lateral direction (y-direction). After the application of the stability test to this bed, a similar pattern was observed in which diagonal patches were also formed. The bed features were observed to be continually developing to some extent as further erosion continued. The fluid forces were still able to remove grains with an increasing proportion in the fine mode. Some of these grains
[image:5.595.121.484.397.609.2]were transported downstream and trapped in the collection box whilst other grains, mainly coarse, moved in a rolling fashion and changed the surface of the adjacent area. As the result of erosion process during the stability test, lower bed surface elevations were found over the area of existing valley (Figure 4). It is also noticed that highly exposed areas that were appear on the bed formed by antecedent flow test, e.g. at point (100,150) and (200,125) in Figure 3, were removed and no longer exist after stability test (Figure 4). The higher flowrates during stability test not only removed high exposed grains but also produced exposed areas at different points within the measurement grid. However, it is very clear from all figures that the level of erosion during antecedent flow test was different than that during stability test. Three hours of antecedent flow armoured the bed to some extent so that the stability test unable to erode and change the bed surface topography to the same extent as the antecedent flow test have had to the original bed. The average bed surface level of the final bed is 1.199 mm below the zero datum, which means the average bed level decreased 0.330 mm during the stability test.
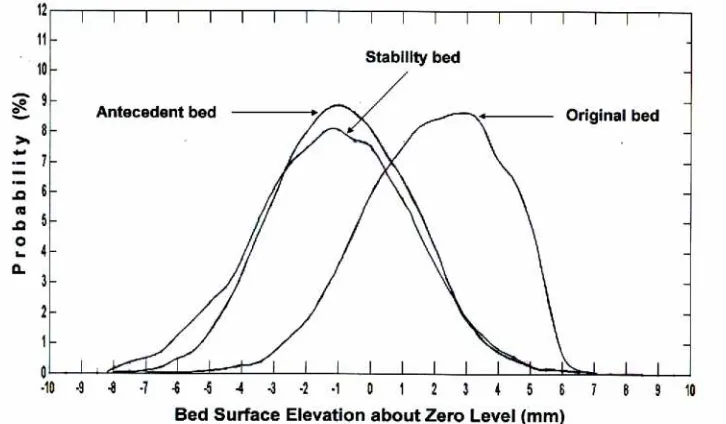
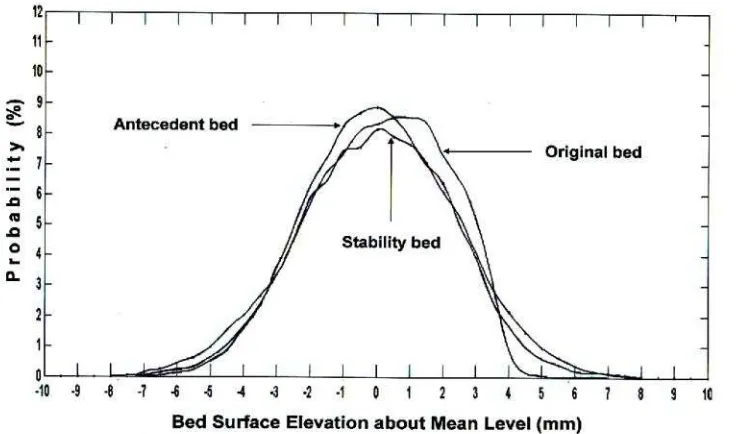
Figure 5. Probability distribution of bed surface elevation about zero level
Given that limited information available from visual examination to the figures of the bed topography, a probability distribution analysis of the bed surface elevations was then carried out in order to estimate the level of grain exposure and the variations in bed surface level. Figure 5 and Figure 6 show the bed surface level evolution during the
within a particular area of the bed to be positioned above or below the mean bed surface even though when examined in detail they may occupy very similar topographic positions in relation to their immediate neighbours. However this method still allows the differences in the bed surface arrangement to be examined by comparing the shape of distribution for different stages of the experiment.
It is apparent that the bed elevation distribution curve of the original bed is not symmetrical. The distribution skews to the right indicating the domination of positive bed elevation. After the bed exposed to three hours of antecedent flow the shape of distribution changes. It skews dramatically to the left. A substantial amount of bed material has been transported during antecedent flow test (see Table 1). The distribution is now quite symmetrical in shape. However there is a large tail on the positive side started about 4 mm above the mean level (Figure 6). This tail indicates the presence of a number of
[image:6.595.141.513.345.562.2]isolated larger grains resting on the bed surface. At the end of stability test, the bed surface elevation distribution indicates that further and different degradational processes occurred. The number of both large positive and negative bed elevations from the mean increases. An increase in exposure of large grains was continued during stability test. However, the level of increase is relatively small in comparison to antecedent flow test. This is caused by the degradation processes that was continued but without any replacement of fine material to fill the gaps. This phenomenon is reflected by the changes in the negative tail which is evident at the end of stability test. In the previous antecedent flow the changes are very small indicating that there were many fine grains filling gaps on the bed surface.
Figure 6. Probability distribution of bed surface elevation about mean level
Stability of the Beds and Mode of Transport The different levels of transport rate during the stability test indicated the influence of flow duration of antecedent flow test. It is found that the beds formed by a constant flowrate with a relatively short duration of 3 hours were very weak. The stability tests show that after certain duration of antecedent
This is believed to be due to the artificial nature of the initial bed. After stability tests the bed topographies are seen to have produced small changes although the amount of bedload transported in the stability tests were higher than in the antecedent flow experiments. This is the characteristic of the intense transport processes that were followed by re-organisation of bed surface. Peak flowrates roughly removed the grains but decreasing flowrates in the declining limb changed the movement. The grains started to move in a rolling fashion allowing the valleys to be re-filled again. Eventually the bed topography is seen to have small changes in its pattern.
Normally when a constant flow discharge is applied, the transport rate, with no upstream sediment feed, is a function of time. The transport rate is expected to decrease rapidly and then remain at a low value. In this case the amount of bedload may be higher for the longer duration of experiments
but this is not as a result of any increase in the transport rate. This is because after a set time the bed had reached an armoured stable condition and very low transport rates existed. However the application of relatively high flowrates of 0.0338 m3/s continually imposed the bed. Further erosion took place and considerable amount of grains in the fine mode were transported. If there is an increase in the amount of grains in the coarse mode transported at this stage, it was because of the transported finer grains changed the surface of “initial stable bed” and increased the exposure of larger grains to some extent. Table 1 shows that during the stability test the grains in the coarse mode dominated the transported bedload. The contribution of this mode in transport almost threefold than the contribution of the fine mode. This is understandable as it reflects the influence of peak flowrates of 0.0375 m3/s in destabilising the armoured bed structures.
Table 1. Summary of transported bedload during the experiment
Bedload transport Mass and proportion of modes
Fine mode Coarse mode
Hydrograph Mass
(g)
Rate
(g/s/m) (g) (%) (g) (%)
Antecedent flow 496.930 0.242 191.282 38.493 198.300 39.905
Stability test 872.58 0.638 191.120 21.880 549.500 62.97
The disruption caused by the higher flowrates in the stability test is also believed to characterise the changes in the bed surface elevations. The bed surface distribution curves before and after stability test are relatively similar compared to the distribution of original bed surface (see Figure 5 and Figure 6). This is very interesting because of the amounts of material transported during the stability test was considerably higher than that transported during the antecedent flow test. It is believed that the disruption not only eroded and then transported the bed material downstream, particularly the exposed grains, but also deposited the material from the upstream part. This suggests that the level of bed stability also appeared to be linked to the bed surface topography. The more stable beds were characterised by a closer distribution of bed surface elevations before and after the stability test (Figure 6). These identical bed surface distributions indicated that the variations of peaks and valleys are relatively balance before and after the stability test.
CONCLUSIONS
The bed topography plots indicated that different
A considerable decreased of 2.792 mm in the bed surface elevation was found at the end of the antecedent flow whilst during the stability test the average bed surface level decreased only 0.330 mm. This reflects the ability of antecedent flow hydrograph to enhance the level of stability that the bed surface decreased only 11.82 % during the last hydrograph.
Different levels of bed stability are clearly shown by the curve of probability distribution of bed surface elevation both about zero and mean level. The shape of distribution curve changes in which the original bed surface elevation curve skews to the right with noticeable gaps. Smaller differences in the probability distribution curves of bed surface elevation before and after the stability tests correlates with the increasing level of bed stability.
RECOMMENDATIONS
Further study of the phenomena associated with the development of bed structures is eagerly awaited to reveal a satisfactorily parameterisation of the aspect of the sediment transport problem. The measurement should cover the intermediate and longer duration of antecedent flow hydrograph to identify how the bed stabilises as well as how the period of destabilisation is affected. The bed topography plot could only be used to recognise the general pattern of erosion without detailed information on the protrusion of individual grains relative to adjacent grains or surrounding areas. It is therefore envisaged that the available data could be re-examined using sophisticated methods to quantify the spatial distribution of grain protrusion.
REFERENCES
Bray, D.I., and Church, M., 1980, Armoured versus Paved Gravel Beds, Journal of Hydraulic Divisions, ASCE, 106, pp. 1937-1940.
Church, M., Hassan, M.A., and Wolcott, J. F., 1998, Stabilizing Self-organized Structures in Gravel-bed Stream Channels : Field and Experimental Observations, Water Resources Research, 34 (11), pp. 3169-3179.
De Jong, C., 1992, Measuring Changes in Micro and Macro Roughness on Mobile Gravel Beds; in Erosion and Sediment Transport Monitoring Programmes in River Basins, Proceeding of Oslo Symposium, IAHS Publication 210, pp. 31-40.
Furbish, D.J., 1987, Conditions for Geometric Similarity of Coarse Stream-Bed Roughness, Mathematical Geology, 19 (4), pp. 291-307. Gessler, J., 1991, Armoring on the Surface of Gravel
Bed Rivers Revisited, Proceeding of the International Grain Sorting Seminar, pp. 299-309, Zurich.
Gomez, B., 1994, Effects of Particle Shape and Mobility on Stable Armor Development, Water Resource Research, 30 (7), pp. 2229-2239.
Gyr, A., and Muller, A., 1996, The Role of Coherent Structures in Developing Bedforms during Sediment Transport ; in Coherent Flow Structures in Open Channels, eds. P.J.
Kirchner, J.W., Dietrich, W.E., Iseya, F., and Ikeda, H., 1990, The Variability of Critical Shear Stress, Friction Angle, and Grain Protrusion in Water Worked Sediments, Sedimentology, 37, pp. 647-672.
Parker, G., 1996, Some Speculations on The Relation Between Channel Morphology and Channel-scale Flow Structures ; in Coherent Flow Structures in Open Channels, eds. P.J. Ashworth, S.J. Bennet, J.L. Best and S.J. McLelland, pp. 423 – 458, John Wiley and Son, Chichester.
Parker, G., and Sutherland, A. J., 1990, Fluvial Armour, Journal Hydraulics Research, 28, pp. 529-544.
Saadi, Y., and Tait, S.J., 2001, The Influence of Different Time Varying Antecedent Flows on the Stability of Mixed Grain Size Deposits, Proceeding of the International Symposium on Environmental Hydraulics (ISEH 2001), Manuscript 00124, 5-8 December 2001, Tempe-Arizona.
Shields, A., 1936, Anwendung der Aehnlich-keitsmechanik und der Turbulenszforschung auf die Geschiebebewegung, Mitt. Preuss. Versuchsanst. Wasserbau Schiffbau, 26, 26 (English translation by W.P. Ott and J.C. van Uchelen, US Department of Agriculture Soil Conservation Serv. Coop. Lab., California Institute of Technology, Pasadena).