gB>liJ
Growth,
Cognitive Development
and Psychosocial Stimulation
Growth,
Cognitive Development
and Psychosocial Stimulation
Growth,
Cognitive Development
and Psychosocial Stimulation
of Preschool Children
in Poor Farmer and Non-Farmer Households
Ali Khomsan
F aisal Anwar
Net! Hernawati
NaniSufianiSuhanda
Oktarina
Department of Communiry Nutrition and Neys-van Hoogstraten Foundation
Faculty of Human Ecology Bogor Agricultural University
2012
' , J
Growth, Cognitive Development and Psychosocial
Stimulation of Preschool Children in Poor Farmer and
Non-Farmer Households
Ali Khomsan Faisal Anwar Neti Hernawati NaniSufianiSuhanda Oktarina
Copyrighr © 2013 Prof. Ali Khomsan , Faisal Anwar, Neti Hern awari, Nani Sun ani Suh anda. Okra rina
Ediror Elviana
Cover Design Ardhya Pra Ea ma
Layou r Design Ardhya Prarama dan M. Abdul Nursidik Ph oto Conrributor : Sani Eryarsah
PT Penerbit IPB Press
Kampus IPB Tam an Kencana Bogor
First Edition: Janu.ri 2013
Printed by Perce takan IPB
Prohibited to quo te or reproduce in wh ole or in parr th e COntenrs of this book withoU( permiSSion of PT Penerbit IPB Press
Title Growth, Cognitive Development and Psychosocial Stimulation of Preschool Children in Poor Farmer and Non-Farmer Households
Researchers Prof. Dr. Ir. Ali Khomsan, MS
and Psychosocial
Prof. Dr. Ir. Faisal Anwar, MSセ」ョ@
in Poor
Farmer
and
Neti Hernawati, SP, MSiDr. Ir. Nani Sufiani Suhanda, MSc.Ag Oktarina, SGz
Institution Address Department of Community Nutrition Faculty of Human Ecology
Bogor Agricultural University
Phone : 62-251-8621258
F a x : 62-251-8622276
E-mail [email protected]
Principal Investigator
SUMMARY
Malnurrition in children under five will have an impact on the delayed physical growth, motor development, and disordered cognitive development. In addition, a lack of nutrition will have an impact on social behavior changes, decreased attention, learning ability, and low learning outcomes. This negative impact on cognitive abilities occurs not only in children with severe underweight, but also in stunted children due (0 」ィイセョゥ」@ malnurrition at an early age (Ojalal 2009). Results
of Basic Health Research (2007) published by Kemenkes/MiniStly of Health of Republic of Indonesia (2008) show the magnitude of nurrition problems facing Indonesia. The number of children suffering from malnutrition reached 18.4%, and stunted children 36.8% of children under five. If the nutrition problem is not resolved, there will be a lost generation.
The objectives of the stUdy were (1) to identify the socio-economic and demographic characteristics of poor farmer and non-farmer households, (2) to identify the eating patterns of preschool children, (3) to analyze the trend of nurritional status among children aged 12, 18, 24 months and at the current age, (4) to identify psychosocial stimulations of preschool children, (5) to analyze the level of cognitive development of preschool children, and (6) to analyze the factors that influence growth and cognitive development of preschool children.
interview using a set of questionnaires, measurement and direct observation. The collected data had been through the process of coding, scoring, entry, and cleaning and then was analyzed using Microsofr Excel 2007 and Sraristical Packages for rhe Social Sciences (SPSS).
The resulrs of rhis study showed thar rhe farmer households and non-farmer households had 4.5 household members on average. Based on rhe number of years rhar farhers and morhers spent for their study, rhe educarion of rhe non-farmer households was relarively berrer rhan of rhe farmer households. However, eirher in rhe farmer households or the non-farmer ones , the farher and morher education was less rhan 12 years.
The income of rhe non-farmer households was higher rhan of the farmer households (lOR 300,245 vs lOR 229,760 per capira per month); where as rhe food expenditure of rhe farmer households was higher rhan the non-farmer households. These phenomena show that the higher the income is, the smaller the food expenditure is.
The mothers with a high nutritional knowledge (rheir scores
セXPEI@ were more frequently found in rhe non-farmer households.
The average score of the nutritional knowledge for rhe mothers in the farmer households was 54.3 while for the mothers in the non-farmer households was higher, that is, 60.8. The result of the t-test showed thar there was a very significant difference (p<O.Ol) berween the nurritional knowledge of the mothers in the farmer households and in rhe non-farmer households.The average score of rhe nutrirional knowledge of the mothers with KMS (growth chart card distributed at posyandul
integrared healrh and nutrition services), 58.2, was not significantly different from thar of the morhers without KMS, 58.8 (p>0.05).
The mothers from the non-farmer households gained a high score of the nutritional arritude, the toral was greater thar that of rhe mothers from the farmer households (82.4% vs 67.1 %). The average scores of rhe nutritional attitude from the non-farmer groups and rhe farmer groups were 87.0 and 83.4, respectively. The t-rest showed that rhere
naires, measuremenc and direct -G セ@ セ MZ@ be-en through the process of coding, -'!e n was analyzed using Microsoft
-ages
lor the Social Sciences (SPSS).=:::: [hat the farmer households and
セ セ ィ ッャ 、@ members on average. Based
Lセ、@ mothers spenc for their study,
M N セセィ ッャ、ウ@ was relatively better than
-Nセ M e: Iher in the farmer households or
M N@ Lセ@ M :.::: ::: ZZZ セ ッ エ ィ・イ@ education was less than 12
G[ セW セ@ households was higher than of
,- .5
\sIDR
229,760 per capita per- G :l/Ie of the farmer households was o!ds . These phenomena show that
="C"f (h e food expenditure is.
[ Z セ hイゥイ ゥ ッョ。ャ@ knowledge (their SCores
Bッセャd 、@ in the non-farmer households . -M M Z セ kno wledge for the mothers in the
- " e iDr the mothers in the non-farmer
セNSN@ Th e result of the t-test showed that
. ::;::e (p <O.Ol) berween the nutritional
M セ@ t ra.rmer households and in the
non-セセ@ £core of the nutritional knowledge of
ill
chan card distributed at posyandul.Zゥッゥセ@ st'nices) , 58_2, was not significantly
o:J,., "-s with out KMS, 58.8 (p>0.05).
BB@ M イM 。 セュ・ヲ@ households gained a high score
.=: Z l セ Z。j@ was greater that thar of the mothers
L セ NZZ@ セアッ@ V5 67. 1 %). The average scores of
-
ZZセ」@ flon -fa rmer groups and the farmerM セ セ 」 ゥカ、ケ N@ The t-test showed that there
Summary
was a very significanc difference (p<O.O 1) berween the nutritional attitude scores of the mothers from rhe non-farmer households and from the farmer ones. However, there was no difference (p>0.05) berween the nutritional attitude ofthe mothers who possessed KMS and of those who did not possess KMS. This is in line with the correlation berween the nutritional knowledge of the mothers who owned KMS and who did not own one, which was insignificantly different. Thus, in this study, KMS possession could not be used to differenciate the nutritional knowledge and attitude of the mothers.
The mothers had the greatest role in preparing food for the children if compared with the other household members, either in the farmer households (88.9%) or in the non-farmer households (85.0%). However, it 'Can be seen that the percentage of the mothers in the non-farmer households who prepared the child food was higher compared with that of the mothers in the farmer households. The percentage of the mothers who always gave attention and supervised when their children under five years old ate was 27.9% in the farmer households, lower than in the non-farmer households (42.0%).
In regards to feeding the children, there were a great number of the mothers who applied a strier discipline to their children under five so that the children could finish eating fast. The farmer household group was, in fact , more disciplined in giving food the children under five than the non-farmer household group. As many as 63.6% of mothers from the farmer household group were disciplined and did not allow their children to eat while playing; on the other hand for the non-farmer household group as many as 51 .9% .
The percentage of the children under five who faced an eating problem either from rhe farmer or non-farmer households were still great, that is, 35.0% ro 38 .9%. The eating problem rhar mosdy dominated the children under five in both household groups was the long eating duration of the children under fi ve. The others were rhe food was often sucked and vomited up, earing had ro be done while playing, and children preferred street-foods.
The average scores of the feeding parrerns for the children under five was 84.3 and 85.7 in the farmer households and non-farmer households, respectively. Based on a statistic test, there was no significant difference (p>0.05) between the average score of feeding parrerns for children under five from the farmer households and of those from the non-farmer ones.
In the non-farmer households the number of the children with the energy adequacy level of <70% was 21.8%. This figure was lower than that in the farmer households (33.6%). This might be connecred with the prosperity level of the non-farmer households which in general was
「・イイセイL@ so the food con sumption of their children under five was also
berrer.The number of children under five with the protein adequacy level of <70% was 7.6%-9.3%. As a whole either in the farmer and non-farmer household, in fact, there were still relatively many children under five who could not meet rhe recommended dietary allowances.
The majority of the children under three when born (0 month) from the farmer households (92.8%) and from the non-farmer households (95.6%) had a normal nutritional status based on an indicaror of weight for age (WIA). However, the average Z-score of the children in the non-farmer households (-0.030) was better (p<0.05) than rhat of the children in the farmer households (-0.372). At the age of 12 months, rhe number of the children with a normal nutritional status slighrly decreased eirher in the farmer households or in rhe non-farmer ones. The decrease of the 12-month-old children's nutritional status may be undersrood as a phenomenon which was relared with
- -
セセA、イ
・ョ@
under five who faced an eating ,, - .-M Gセ NNZョ セM[Bヲ@
or non-farmer households were ' -ZZZ セMセ
N@
The eating problem that mostlyMc セNゥ@
E'.,. in both household groups was the !J-en under five. The others were the--..:. 'Ir.;:;ii:ed up, eating had to be done while
M セ ウセセ・ヲ Mヲ ッッ、ウ N@
- = -':l!'u7ng patterns for the children under ' - ::- :lrme r households and non-farmer
MZッZDセ@ on a statistic test, there was no
j,
セアG・
ョ@
the average score of feeding -セ セ M
':-om (he farmer households and of,.:i :ilt> n umber of the children with the '&; セ@ j .8Q
o.
This figure Was lower thanu . This might be connected with - .,t;"'-.:u.O': households which in general was - _..,,- - M GM セィ ・ゥイ@ children under five was also
- -- -::-ce hve with the protein adequacy
セ@ a v:hole either in the farmer and
' - -:-;e were still relatively many children
-" U:e . ::commended dietary allowances.
..:.:.=-'1 u nde r three when born (0 month) h}:? 8°o) and from the non-farmer
-O.:-TI-:U n u rrirional status based on an
--\ . However, the average Z-score of the tiSChoJds (-0.030) was better (P<0.05) - ,. ':-'.,:n;:r households (-0.372). At the age
:
uャ セ@
;:-hildIen with a normal nutritional- , -
セ ィ・@
fa rme r households or in thenOn--,'e : 2 mon rhold children's nutritional
セ@ ZG^ セ MZZ[@ ZMZ ッ ュ・ ョ ッョ@ which was related with
Summary
:he children's food consumption which did not fully meet nutritional ;cquirements. At the age of 18 months the number of the children with a normal nutritional status decreased more and more, and at the age of 24 months the children's nutritional status based on the mean of Zscore of weight for age (WIA) got worse.
Based on the KMS (growing chart card) possession, the nutritional status of the 0to24monthold children was no difference between the children possessing a KMS and those who did not have any KMS . KMS possession did not make the children's nutritional status get better compared with those who did not have any KMS. Basically, the children without any KMS also visited posyandu every month to get a nutritional service.
cオイイ・ョセ@ nutritional status showed that by indicator of weight
for age (W/A) the children with a normal nutritional status in the farmer households were as many as 71.4% and those in the nonfarmer households were 67.6%. 1here were still relatively many children with underweight status, that is, >25.0% , and this showed that the nutritional problems were still huge in the communiry level. No difference was found in the nutritional status of children in farmer and non farmer households. By using indicator weight for height (W/H), it was known the number of the children with a normal nutritional status was over 80%. However, by using indicator height for age (H/A) the number of the children with a normal nutritional status was in fact lower. The percentage of the stun ted children based on the HIA indicator was relatively high (>30.0%) in this research site.
Based on KMS possession the nutritional status of the children with KMS was not different from the nutritional status of those without Kt'v1.S (p>0.05). Problems of underweight and stunting were encountered in both groups with a similar prevalence (about 30%).
showed that the psychosocial stimulations in both of the groups, the PAUD (early childhood education) members and the nonPAUD members, were insignificantly different (p>O.05). Other research results revealed that the psychosocial stimulations given by the mothers or caregivers in this research were not different for the boys and girls; and the psychosocial stimulations to the children with KMS (growth chard card distributed at posyandu) and to the children without KMS were not significantly different (p>O.05).
The cognitive development achievement of the children in the nonfarmer household group was slightly better than that in the farmer household group . However, the result of the ttest showed that the cognitive developments in both groups were not significantly different
(p=O.Q6). However, the cognitive development of the children in the PAUD member group was significantly better than that of the non-PAUD member group (p<O.05). Based on their sex, the average cognitive development achievements of the boys and girls were relatively similar. Similarly, based on KMS (growth chart card) possession, the result of the research showed that the children possessing KMS and those having no KMS gained average scores of the cognitive development which were almost the same.
The results of a correlation test revealed that a nutritional status indicated by index weight for age (WIA) was positively correlated with the consumption of energy and protein significantly. The nutritional status indicated by the height for age (HIA) index was positively correlated with the feeding pattern, mothers' nutritional knowledge, the consumption of energy and of protein significantly.
The study revealed that the cognitive development was correlated with the length of fathers and mothers' education, involvement in PAUD (early childhood education) , nutritional status by index WIA and H/A as well as the psychosocial stimulation (p<O.O 1) .
<:!imulations in both of the groups, the
-G. '.::arion) members and the nonPAUD
セZ\N@
d ifferent (P>0.05). Other research ± osocial stimulations given by the mothers :: =e nor different for the boys and girls;,s to the children with
K1v1S
(growthtil and to the children without
KJv1S
- : L = ; 1=>0-05).
hievement of the children in the digh tly better than that in the farmer
M Nセ@ resul t of the ttest showed that the
g:o ups were not significantly different
セ@
J e\e1opment of the children in the,,= ''lcan dy better than that of the
non-oj ).
Sセ・、
On theirsex, the average cognitive c':e「ッセ Mウ@
and girls were relatively similar.'g';OWD chart card) possession, the result
」セゥj
、 イ・ョ@
possessingKMS
and thoseセNRZ GZZ ]@ ''':or'0"5 of the cognitive development
. セ・ウH@ re\ealed that a nutritional status
-
GセZB@
\\L\) was positively correlated with ::: p :o re in Significantly. The nutritionalセ eオセ@
to:
age (HIA) index was pOSitively, :":.1 . mothers ' nutritional knowledge, : ::)fotein Significantly.
:' ':ng.nir ive development was correlated
-c
;r:o rne rs ' education, involvement inNセセZNMャN@ n utritional status by index W/A
セRQ@ セサゥ ュ オャ。エゥッョ@ (p <O.O 1).
Summary
Although a good nutrition will improve the children's cognitive '::::\'e!opment, the psychosocial stimulation and the involvement of :"l ildren in early childhood education also played an important role ::.s an inrermediary factor in the cognitive developmenr of preschool
セ ィ ゥャ、イ・ョN@ Based on this evidence we can conclude that the nutritional
セゥ 。エオs@ and psychosocial stimulation as well as the participation of
: hildren in early childhood had an important role in the cognitive 'eve1opmenr of preschool children . In a synergic enrity, a good nutrition can help children prepare themselves ro receive psychosocial stimulation optimally. However, an optimal cognitive developmenr cannot be achieved if it is only supported with good nutrition without any efforrs to provide good stimulation as well. The presence of nutritional .intervention and psychosocial stimulation is expected to
conrribute to the children 's optimal cognitive development.
Following the deep study of this research the researchers recommend the governmenr to arrange socialization for all parenrs on how to practice exclusive breastfeeding, good eating habits for children, and to create good caregiving environmenr and psychosocial stimulation to achieve the children 's optimal cognitive development. It
can be done through extension activities and trainings .
The improvement of PAUD (early childhood education) quality is needed, since PAUD had significanr role in developing cognitive developmenr of children. Trainings for PAUD teachers are recommended. Most PAUD teachers had no psychosocial education background and it is necessary for rhe government to train them.
The researchers want to express their sincere to the folloWing :2nies: Neys van Hoogstraten Foundation that has facilitated this
i M セ・ 。イ」ィ[@ the Government of Subang District with their staffs for
::!:leir permission to collect data and in giving advice in the seminar
セゥ@ research results; the Dean of the Faculry of Human Ecology, Bogor .g ricultural Universiry (IPB); Head of Department of Communiry
_セオ エイゥエゥッョ L@ N f。」オャイケ@ of Human Ecology, Bogor Agricultural Universiry
:PB); and the research assistant as well as enumerators who collected
LIST OF CONTENT
UMMARY ... ... ...
viiLIST OF TABLES ... ... ... .... ... xx i LIST OF FIGURES ... ... ... xxvii
LIST OF APPENDICES ... ... ... .. ... xxix
_\CKl"JOWLEDGMENT ... .. ... ... ... ... ... ... .. ... xv
LIST OF CONTENT .... .... ... .. .. .... ... ... xvii
l. INTRODUCTION ... .... ... 1
1.1. Background ... .... ... .... .. .. ... 1
1.2. Goals and Objectives ... ... ... 5
2. LITERATURE REVIEW ... .... ... 7
2.1. Child Growth ... .. ... 7
2.2. Nutritional Status (Anthropometric Index) ... 10
2.3 . Practice of Breastfeeding and Complementary Feeding ... 12
2.4. General Child Development ... 16
2.5. Cognitive Development of Children ... .. ... 20
2.6. Psychosocial Stimulation ... . 24
2.7. Quality of the Nurturing Environment.. ... .. ... .. ... 26
2.8. Education for Earlyaged Children_ ... 28
2.9. The Influence of Nutrition towards Child Growth and Development ... ... ... 30
4. METHOD ... .. ... 41
4.1. Research Design, Location and Time ... .41
4.2. Sampling... 41
4.3. Data Collection ... .. ... .. ... 45
4.4. Data Management and Analysis ... 50
4.5. Research Limitations ... 51
4.6. Relevance of Research ... .. ... 52
5. DESCRlPTION OF THE STUDY SITES ... 55
5.l. Geographic Condition of Subang District ... 55
5.2. Residents and Human Resources... 56
5.3. Agricultural Potentials ... .. ... ... ... .. ..
57
5.4. Education and Health ... 59
6. SOCIOECONOMIC AND DEMOGRAPIC CHARACTERlSTICS OF THE HOUSEHOLDS ... 63
6.1. Characteristic of the Households ... 63
6.2. Income and Expenditure ... .. ... 69
6.3. Nutritional Knowledge of the Mothers ... ... ... 71
6.4. Nutritional Attitude of the Mothers ... 78
7. CHILD EATING PATTERNS ... 87
7.l. Child Feeding Practice ... .... ... 87
7.2. Feeding Schedule for Children ... 92
7.3. Mother's Attitude and Methods of Feeding Children underfive ... ... .. ... ... 93
8. FOOD CONSUMPTION ... . 93
8.1. Nutrition Intake ... 93
8.2. Food Frequency ... .. ... 104
8.3. Food Preference ... .. ... 107
List of Content
... ... .. ... ... ... ... ... ... . ..
!. . History of Breas tfeeding.... ... .... ... ... ... .. ... 110
-!l7&•. Location and Time ... ... ... ... ... -セ@ The Practice of Drinking Milk in Children underfive... 113
.... ... ... .. ... ... .. ... .... ... .. ... -: .. b . Food Taboo ... ... ... ... ... ... .. ... .. ... 115
... .. ... . . ... . ... . ... .... ... ... ... -1 ....
Eating Frequency of the Households ... 11 7 • «lId Analysis ... 5. ; Q The Practice of Eating Together... .... ... .. 118
.<1s ... ... ... ... .. ... )
",
5.. 9. Milkdrinking Practices in the Household ... 119
..
M セ@
·· .. ·.. ·.. .. ·.. ·.. .. ·... .. ·.... ·... 5.::_: UTRITIONAL STATUS ... ... ... ... .. ... .... ... .... 121
セ
'!}E STUDY SITES ... .. ... ... ... . 55 ··'on ofSub ang District ... ... .. 55
HEALTH STATUS ... 13 1
Nゥセ
Rゥャ@
Resources... ... .. 5610. 1. The History of Children's Diseases since Born ... .... .... 131
-...;:i.lls... ... ... ... ... ... ... ... 57
10.2. History of The Children's Diseases in the Las t :
セZZZZZ[jjj@
ᄋᄋᄋ@
.. ·· ... .... ·... ·.. ·.... ·... .59Two Weeks... .... ... 133
cNイセ
G| d@
DEMOGRAPIC • PSYCHOSOCIAL STIMULATION ... .... ... .... .. ... 137- .. FTHE HOUSEHOLDS ... .. .... 63
..: rlo useholds··.. ·... ·... ... ... 63 _. COGNITIVE DEVELOPMENT ... .... .. ... ... ... 147
..
セZオ ヲ・ ᄋᄋᄋ@ ᄋ ᄋᄋ@ ᄋ@ᄋ ᄋᄋ ᄋᄋᄋᄋ@
.. ·· .. ··· ... 69 3. FACTORS AFFECTING GROWTH .. ...ge of [he Mothers .. ... 71 AND COGNITIVE DEVELOPMENT ... .. ... .... ... .... 155セセセ@
of ,he Mothers... ... .. ... ... 78 13.1. Factors Pertinent to Growth ... ... .... .... 15513.2. Factors Associated with the Cognitive Development ... 158
i@ M セ
G|s@
.. ... ... .. ... .... ... ... 87- - -'C E ... .... .. ... . .. .. ... ... . 87 14. CONCLUSIONS AND RECOMMENDATIONS ... 165
: :c; Children ... .. ... .. ... .... 92 14.1. Conclusions ... .. ... ... ... ... ... 165
セ@ .zn.:i セ ヲ」{ィッ、 ウ@ of Feeding 14.2. Reco mmendations ... ... ... ... ... ... ... ... .... .. 170
....
' . -, '" .... ... ·.... .... ·... . 93
··· .... ··· .. ·· ... .. .. ·... ·.. ·... 93 15. BIBLIOGRAPHY. ... ... ... ... ... ... ... ... .. ... .. ... ... .. ... 173
_... .. .... ... .... ... ... ... ... ... .. 93
APPENDICES ... ... ... ... .... ... ... ... ... .. . 185
··· ·.. ··· .... ··· .. ·.. ·.. .. ... ·... ... 104
ABOUT RESEARCHERS .... ... .... ... .. ... .... ... ... ... .... 195
c セ@ 4.1. Distriburion of sample in Subdistrict of Jalan Cagak,
Subang District ... 44
:2Dle 4.3. Aspects of cog nitive development measured and a ble
5.1.
The tOtal production of the dryland crops in Table 5.2. The number of infants immunized in Subang District Table 5.3. The number of children underfive by their nutritional Table 6.1. Socioeconomic and demographic characteristics Table 6.3. Distribucion of che fathers and mothers' ages Table 6.4. Distriburion of che fachers and mothers' education Table 6.5. Distribucion of the fathers and mothers' jobs セM Ie 4.2 . Variables and indicatOrs of the study ...45examples of items ...
47
:3.ble 4.4. Aspects of psychosocial stimulation ...48
Subang District ... .. ... ... .. .... ... ... ... 48
in 2010 ... .... ... ... ... ... 60
status in Subang Distri ct in 2010 ... ... .... 61
of the households ... 64
Table 6.2. Distribution of che household size ... ... ... 65
by household eype ... 66
by household eype ... ... ... 67
by household eype ... 68
[image:17.595.10.347.143.575.2]List of Tables
Table 6.7 . Distribution oHood expenditure by household
[image:18.595.19.374.121.588.2]rype and food rype (IDR/capita/month) ... ... ... 70 Table 6.8. Distribution of the nonfood expenditures
by household rype (IDR/capita/month) ... ... ... .71 Table 6.9. Distribution of the mothers correctly answering
the nutritional knowledge items by household type ... . 73 Table 6.10. Distribution of the mothers' nutritional knowledge
by household rype ... ... ... 77 Table 6.11. Distribution of the mothers' nutritional knowledge
by KMS (growth chart card) possession ... ... ... ... 77 Table 6.12. Distribution of the mothers' responses to the nutritional
attitude statements by household rypes ... ... ... 79 Table 6.13. Distribution of the mothers' nutritional attitude
by household rype ... ... ... ... .... .. 84 Table 6.14. Distribution of the mothers' nutritional attitude
by KMS (growth chart card) possession ... .. .. ... 85 Table 7.1. Distribution of child feeding practice by household
rype ... .. ... ... ... .. ... ... ... ... .. ... 88 Table 7.2. Distribution of the child feeding schedules
by household rype ... .. ... .. ... ... ... ... ... .. ... ... ... 93 Table 7.3. Distribution maternal attitude in feeding the children
by household rype ... ... .. ... ... ... 95 Table 7.4. Distribution of score categories of feeding patterns
for the children underfive by household rype ... .. ... .. 97 Table 7.5. Distribution of the score categories of feeding patterns
for children underfive and by child sex .. ... ... .. ... ... 98 Table 8.1. Consumption and the nutritional adequacy level
of the children underfive by household rype ... 99
N
"
セoッ 、@
expenditure by householdセ@
::"Je (I DRJcapita/month)... 70 . .MBセ・@ :lo nfood expendituresr fD RJcapita/month) ... ... 71
. Nセ AG@ m others correctly answering
'=lOw/edge items by household rype ... 73
GMセZc@
morhers' nutritional knowledgeセBM -... ... ... .... .. ... 77
: . !..!
セッイN
ィ ・イウG@
nutritional knowledge-'. -:-:u.rr
ca rd) possession .. ... .. .... 77 , ....セ@ セッH
ィ・ イ ウG@
responses to the nu tritional-.<.';
「Mセ G@
ho usehold rypes ... 79 •.. セ@ ::lothers' nutritional attitude- '-E __ . . ...
84
MM N ヲMNセ@
Darn ers' nutritional attitude' r card) possession ... .. ... 85 . Feedi ng practice by household ... ... ... .. ... 88
セ M セセ@ : : ild feeding schedules
セ MMᄋM ᄋᄋ@ ᄋᄋᄋᄋᄋᄋᄋ@ .. ·· .. ·.. · ... 93
セイイ ゥ@rude in feeding the children
;;:r-._ . . . ...
95
M セ セ」@ ca tegories of feeding patterns
MZ 」セ N Mィ| ᄋ・@
by
household rype ... 97Mセ M M・@
"core categories of feeding patterns] M Mセ N@ [GB@
an dby
child sex ... 98.:
ゥNNイNセ・@
m l[[i tional adeq uacy level:cerSYe
by
household rype ... 99セ@ .. セ@ 8.2. The categories of energy and protein adequacy levels ... 101 ,e 8.3. The energy consumption by rypes of food
and household ... ... ... 102 Ie 8.4. The protein consumption by food rypes in the farmer
and nonfarmer households ... ... ... ... ... 1 03 :.mle 8.5. Distribution of the undernve children's eating
frequencies by household rypes ... l04 :,;,bl e 8.6. Frequency of the undernveyearold children's food
consumption per month by household rypes .. ... 1 05
MZMセNセ ャ・@ 8.7. Distribution of undernve children in nnishing
the portion of food by household rype ... 107 ::able 8.8. Distribution of daily fruit availabiliry at home
by household rype ... ... .... ... .. .. 108 :a ble 8.9. Distribution of fruits loved by the children
undernve by household ryp e ... 108 Table 8.10. Distribution of vegetables the children
undernve like by household rype ... 1 09 Table 8.11. Distribution of kinds of snacks loved by children
undernve by household rype ... ... ... .. 110 Table 8.12. Distribution of exclusive breastfeeding provision
by household rype ... ... 111 Table 8.13. Distribution of the duration of breastfeeding
by household rype ... ... 112 Table 8.14. Distribution of the history of giving formula milk
by household rype ... .. ... .. ... 114 Table 8.15. Distribution of the history of giving cowmilk
to children by household rype ... ... .... ... ... 115 Table 8.16. Distribution of the kinds of taboo food
[image:19.595.14.349.28.576.2]List ofTabJes
Table 8.17. Distribution of reasons for food taboo
by household type ... 117 Table 8.18. Distribution of households' eating frequency
per day by household type ... 117 Table 8.19. Dimibution of the households' practices of eating
together by household type ... 118 Table 8.20. Distribution of the meanings of eatingtogether
practices by household type ... 119 Table 8.21. Distribution of havingbreakfast practices
by household type ... 119 Table 8.22. Distribution of milkdrinking practices
. in the households by household type ... ... 120 Table 9.1. Distribution of nutritional status of 0to24monthold
children by household type ... 122 Table 9.2. Distribution of the nutritional status of
0to24monthold children by KMS
(growing chan card) possession ... 125 Table 9.3. Distribution of the current nutritional status
of the children underfive by household type ... ... ... 126 Table 9.4. Distribution of current nutritional status
of the children under five by KMS (growing chart card) possession... ... .... ... ... ... ... ... ... .. ... ... .. 127 Table 10.1. Distribution of the diseases the children underfive
have ever suffered from by household type ... 131 Table 10.2. Distribution of the diseases the children underfive
suffered from in the last two weeks by household
type ... ... ... .. ... ... 134
[image:20.595.22.381.50.585.2]:. fo r food taboo
.. · .. ···· .... ... ·· .. .. ... 117
セLッA 、 ウG@ eating frequency
- -";': 0]>e ... .... ... ... ... 117 J.Seholds' prac tices of eating
セセセ
_ ・@
... · ... · ... .. ... ... 118 :. MC!"'..:.l i ngs of eating[OgetherGZjセ 」N@ iype .... ... ... 1 19 gQ:;:akfast practices
·· .. · .. ·· .... · .. ... ·· .. .. ... ··· ... 119
::an
ki
ng pranicesセM イNゥs・「 ッャ、@ rype ... 120
セQセ M lNRQ@ stat us ofO[O24mo m hold
M セA[ NZZ@ セ M _・@ .. ... ... ... .... 122
M セ@ "='=;-;- :"1'1 n utri tio nal status
.
NNNZNZZセ
ᄋ ゥゥ ᄋ@
::
by household rype ... 126 . セセ@ &jl:uirional sta tusM NZセセ@
E"
e 「セ G@ K.c\1S (growing chan card) .. · .. ·· .... ··· ... · .. ··· ... 127.:'2;S ;'S [he children underfive
... -NNオNセ@ セ@ .. household rype ... ... . 131 (he children underfive
. M セ@ fast: [l.vo weeks by household
[image:21.595.14.349.63.576.2] · ··· · .. ·· .. ·· ··· ···· ···· ... 134
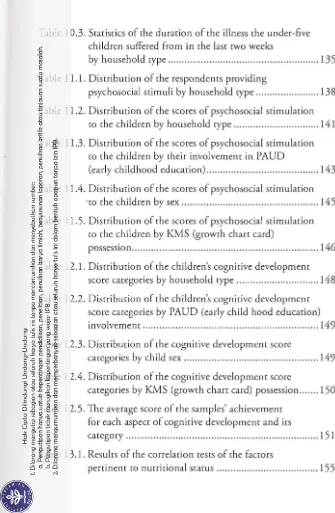
Table 10.3 . Statistics of the d uration of the illness the underfive children suffered from in the las t two weeks
by household rype .. ... .. ... ... ... .. .... ... .... ... 135 Table 11.1. Distribution of the respondems providing
psychosocial stimuli by household rype ... ... 138 Table 11 .2 . Distribution of the scores of psychosocial stimulation
[0 the children by household rype ... ... .... .... ... 141
Table 11.3. Distribution of the sco res of psychOSOCial stimulation
[0 the children by their involvemem in PAUD
(early childhood education) ... ... ... .... ... 143 Table 11.4. Distribution of the scores of psychosocial stimulation
'[0 the children by sex .... ... ... ... ... ... .. . 145
Table 11.5. Distribution of the scores of psychOSOCial stimulation
[0 the children by KMS (grow th chart card)
possession .... .. ... .... ... ... ... ... 146 Table 12.1. Distribution of the children's cogn itive develop ment
score categories by household rype ... ... .... .... .. .. . 148 Table 12.2 . Distribution of the children's cognitive development
score categories by PAUD (early child hood education) involvement ... .... ... ... ... ... ... .. 149 Table 12.3. Distribution of the cognitive development score
ca tegories by child sex ... ... ... 149 Table 12.4. Distribution of the cognitive development score
ca tegories by KMS (growth chart card) possession ... .. 150 Table 12.5 . The average score of the samples' achievement
for each aspect of cognitive development and its
category ... ... .. .. ... ... ... .. ... ... ... ... 151 Table 13.1. Results of the correla tio n tests of the fac[Ors
Lis( of Tables
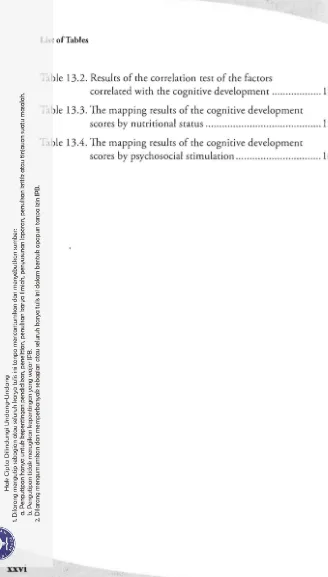
Table 13.2. Resulrs of rhe correlarion resr of rhe faccors
correia red wirh rhe cognirive developmenr ... 15S Table 13.3. The mapping resulrs of rhe cognirive developmenr
scores by nurrirional srams ... 15 9 Table 13.4. The mapping resulrs of the cognirive developmenr
scores by psychosocial srimularion ... .. . 160
[image:22.595.32.360.16.593.2];:esuJrs of the cognitive development " =onal status ... ... .... ... ... I _
M セ@
:crulrs of the cognitive development ::':v<cocial stimulation ... ... .. .... ... 16C
Conceptual framework ... ... ... ... ... ... .. ... 39 Trend of nutritional status o f the ch ildren
LIST OF APPENDICES
=oie Appendix 1. Distribution of the mothers correctly answering the nutritional knowledge items by KMS (growth chart card) possession ... 186
t' :\ppendix 2. Distribution of the mothers' responses to
the nutrirional attitude statements
by KMS (growth chart card) possession ... 187
--Ie Appendix 3. Distribution of child feeding practice
by sex ... 188 :c,le Appendix 4. Distribution maternal attitude in feeding
the children by sex ... 189
-
Ie
Appendix 5. Recommended dietary allowances (RDA)of the children underfive ... 190 wl e Appendix 6. Distribution of the diseases the children
under five have ever suffered from
by KMS (growth chart card) possession' ... 190 '":'"ab le Appendix 7. Distribution of the diseases the children
under five suffered from in the last two weeks by KMS (growth chart card)
possession ... 191 : able Appendix 8. Distribution of the respondents according
to psychosocial stimulation and PAUD
(early childhood education) members ... 191 able Appendix 9. Regression analysis of factors affecting
Cognitive Development
and Psychosocial Stimulation
of Preschool
Children
in Poor Farmer and NonFarmer House holds
r
-Wfl
セ i@
Gセi@
NHF
Neysva n Hoogstraten Foundation , the Netherlands
PT Penerbit IPB Press
Kampus IPB Taman Kencana
JI. Taman Kencana No.3, Bogor 16128
Telp . 0251- 8355158 E-mail: [email protected]
Penerbit tPB Press @IPBpress
S U I.. I .I I
ISBN 97 8·979-493-480·7
1/1111111111111/1111111111111/