INTANI DEWI
GRADUATE SCHOOL
BOGOR AGRICULTURAL UNIVERSITY
BOGOR
STATEMENT OF THESIS, SOURCE OF INFORMATION
AND COPYRIGHT
I hereby declare that thesis titled Price Volatility Analysis in Indonesian Beef Market, was independently composed by me under the advisory committee supervision and has not been submitted to any other universities. Source of information derived or quoted from works published and unpublished from other writers have been mentioned in the text and listed in the References at the end of this thesis.
I hereby assign the copyright of my thesis to the Bogor Agricultural University.
Bogor, April 2016
Intani Dewi
SUMMARY
INTANI DEWI. Price Volatility Analysis in Indonesian Beef Market. Supervised by RITA NURMALINA, ANDRIYONO KILAT ADHI and BERNHARD BRÜMMER.
Agricultural product prices always fluctuate over time. The Indonesian beef price movement increasing erratically and tends to be volatile in recent years. Based on the price monitoring in several production centers, there are beef price fluctuations in the consumer level across time and between provinces. The beef price volatility is a risk factor that must be faced and will affect the decision making. Behind the concerns over price volatility it would appear also concerns about price levels and their relation to food security, especially for the people with low income levels. Governmental action to address this issue was launched called the Beef Self-Sufficiency Program (BSSP). This government policy main goal is to achieve food security animal origin based on local resources, by increasing population and domestic production to meet the needs of the national beef.
Indonesia will experience a very great beef deficit in the medium to long term if the government has not made any efforts to increase production. Great deficit meat will further difficult the price stabilization in the country. This study tries to present the relationship between the beef price volatility and Indonesia's efforts to ensure food security through self-sufficiency in beef. Therefore it is interesting to see how the beef price responds to the import reduction policy through beef self-sufficiency program and how it is affecting the beef price volatility.
The aims of this study are, to understand beef price volatility in Indonesia and to analyze the impact of beef self-sufficiency program to the beef price volatility in Indonesia This study is using secondary data to understand the volatility of beef price series in Indonesia, the data used in this analysis are daily observations from January 2006 to December 2013, with total 2086 observations. Data was obtained from Ministry of Trade, Government of Indonesia. The data was collected through market survey from three different markets in 33 capital provinces in Indonesia.
We also add dummy 3 (D3) in the variance equation as the additional regressor to capture the change policy, we want to see whether the beef self-sufficiency policy implementation in 2010 influence the beef price volatility. From the model in table 4, the dummy 3 coefficient is negative and significant at 1 percent, so it is statistically proven that beef self-sufficiency program makes beef price volatility lower than the 2006-2009 periods. However the magnitude of the parameter in external regressor of dummy 3 is relatively small, it implies that the government policy through beef self-sufficiency program strive small impact on overall volatility development. Based on the above considerations, we will then use the GARCH (1.1) model with D1 and D2 in the mean model and D3 as the external regressor to discuss more detail about beef price volatility in Indonesia.
GARCH (1.1) model gives information that beef price movements are influenced by the volatility from the previous period and yesterday variance. We can say from this model that if we have relatively large price residual and variance
in today’s price then the next day price level will tend to be larger. Based on the model we can conclude that beef price volatility in the future will tend to be smaller and persistence. Parameter of the dummy variable in the variance equation to capture the change policy is statistically significant. It indicates that the beef self-sufficiency program may lower the beef price volatility.
Since beef price driven by the dynamics of beef supply and demand. It is necessary for the government not only doing the production approach by increasing the beef cattle population through beef self-sufficiency program but also through price control policy at balance proportion. In relation to price stabillization, it is important that Indonesian government should develop an effective and efficient beef supply chain, this can be done by improving the market mechanisms, transportation and infrastructure for distributing beef cattle from production areas to consumption areas. Due to low production and high demand of beef the government should be more flexible in relation to food policy in order to make faster response to any situations such as hold sufficient beef stock in the storage in Ramadhan, Idul Fitri festival and other big celebration day in Indonesia.
RINGKASAN
INTANI DEWI. Analisis Volatilitas Harga di Pasar Daging Sapi Indonesia. Dibimbing oleh RITA NURMALINA, ANDRIYONO KILAT ADHI dan BERNHARD BRÜMMER.
Harga-harga produk pertanian selalu berfluktuasi sepanjang waktu. Harga daging sapi di Indonesia terus meningkat dan cenderung volatil pada saat ini. Berdasarkan pemantauan harga di beberapa pusat produksi, terdapat fluktuasi dari harga daging sapi di tingkat konsumen di beberapa waktu dan diantara provinsi. Volatilitas harga daging sapi adalah faktor resiko yang harus dihadapi dan akan mempengaruhi pengambilan keputusan. Dibalik kepedulian terhadap volatilitas harga akan muncul juga kepedulian terhadap tingkat harga dan hubungannya terhadap ketahanan pangan, terutama untuk masyarakat dengan level pendapatan yang rendah. Aksi yang dilakukan pemerintah untuk mengatasi permasalahan ini adalah dengan mencanangkan program swasembada daging sapi. Tujuan utama dari kebijakan pemerintah ini adalah untuk mencapai ketahanan pangan asal ternak domestik, dengan meningkatkan populasi sapi dan produksi daging sapi domestik untuk memenuhi kebutuhan konsumsi nasional.
Indonesia akan mengalami defisit daging sapi yang sangat besar pada jangka panjang menengah jika pemerintah tidak membuat suatu usaha untuk meningkatkan produksi. Defisit daging sapi yang tinggi akan menyulitkan stabilisasi harga di dalam negeri. Studi ini mencoba untuk menampilkan hubungan antara volatilitas harga daging sapi dan usaha pemerintah Indonesia untuk menjamin ketahanan pangan melalui swasembada daging sapi. Oleh karena itu sangat menarik untuk melihat bagaimana harga daging sapi merespon terhadap kebijakan pengurangan impor melalui program swasembada daging sapi dan bagaimana hal tersebut akan mempengaruhi volatilitas harga daging sapi.
Tujuan penelitian ini adalah untuk memahami volatilitas harga daging sapi di Indonesia dan menganalisis dampak dari program swasembada daging sapi terhadap volatilitas harga daging sapi di Indonesia. Penelitian ini menggunakan data sekunder untuk memahami volatilitas dari series harga daging sapi di Indonesia, data yang digunakan pada analisis ini adalah observasi harian dari Januari 2006 sampai Desember 2013, dengan total 2086 observasi. Data diambil dari Kementrian Perdagangan Republik Indonesia. Data dikumpulkan melalui survey pasar dari tiga pasar berbeda di tiap ibukota provinsi di Indonesia.
Kami juga menambahkan dummy 3 (D3) dalam persamaan varians sebagai regressor tambahan untuk menangkap perubahan kebijakan, kami ingin melihat apakah implementasi kebijakan swasembada daging sapi pada tahun 2010 berpengaruh terhadap volatilitas harga daging sapi. D3 memiliki nilai koefisien yang negatif dan signifikan pada taraf alfa 1 persen, sehingga secara statistik terbukti bahwa program swasembada daging sapi dapat membuat volatilitas harga daging sapi lebih rendah dari periode 2006-2009. Namun besarnya parameter di regressor eksternal dummy 3 relatif kecil, hal ini menunjukkan bahwa kebijakan pemerintah melalui program swasembada daging sapi berdampak kecil pada pengembangan volatilitas harga keseluruhan. Berdasarkan pertimbangan di atas, maka kami akan menggunakan GARCH (1,1) model dengan D1 dan D2 dalam model mean dan D3 sebagai regressor eksternal untuk membahas lebih detail tentang volatilitas harga daging sapi di Indonesia.
Model GARCH (1.1) memberikan informasi bahwa pergerakan harga daging sapi dipengaruhi oleh volatilitas dari harga periode sebelumnya dan varians hari kemarin. Dapat dikatakan dari model tersebut bahwa jika kita memiliki residual harga yang cukup besar dan varians dari harga hari ini maka tingkat harga esok hari akan cenderung lebih tinggi. Berdasarkan model juga dapat kami simpulkan bahwa volatilitas harga daging sapi di masa yang akan datang akan cenderung lebih kecil dan persisten. Parameter dari variabel dummy pada persamaan varians untuk menangkap perubahan kebijakan signifikan secara statistik. Hal ini mengindikasikan bahwa program swasembada daging sapi dapat membuat volatilitas harga daging sapi lebih kecil.
Harga daging sapi didorong oleh dinamika pasokan daging sapi dan permintaan oleh karena itu pemerintah sebaiknya tidak hanya melakukan pendekatan produksi dengan meningkatkan populasi sapi potong melalui sapi program swasembada tetapi juga melalui kebijakan pengendalian harga. Pemerintah Indonesia harus membuat rantai pasok daging sapi yang efektif dan efisien, hal ini hanya bisa dilakukan dengan mengembangkan mekanisme pasar, transportasi dan infrastruktur untuk mendistribusikan ternak sapi potong dari daerah produksi ke daerah konsumsi. Kebijakan yang dibuat pemerintah harus lebih fleksibel untuk produksi daging sapi yang rendah dan permintaan yang tinggi, seperti mengadakan stok persediaan pada bulan-bulan tertentu disaat harga daging sapi sedang tinggi seperti saat Ramadhan, Idul Fitri dan juga hari besar keagamaan lainnya di indonesia.
© All Rights Reserved by Bogor Agricultural University, 2016
Copyright Reserved
It is prohibited to quote part or all of this paper without including or citing the source. Quotations are only for purposes of education, research, scientific writing, preparation of reports, critics, or review an issue; and those are not detrimental to the interest of the Bogor Agricultural University.
PRICE VOLATILITY ANALYSIS
IN INDONESIAN BEEF MARKET
INTANI DEWI
Master Thesis
as one of requirements to obtain a degree of Master Science
in
Agribusiness Study Program
GRADUATE SCHOOL
BOGOR AGRICULTURAL UNIVERSITY
BOGOR
ACKNOWLEDGMENT
All praise to Allah, The Almighty, The Gracious and The Merciful, for Allah blessings during the process of this thesis writing. I feel grateful to finally finish my thesis. This research would have been impossible without the support from many people. I would like to appreciate everything they have given to me.
I would like to express my deepest appreciation to my supervisors from George-August Göttingen University Germany, Prof. Dr. Bernhard Brümmer as my first supervisor who supports me academically in thesis writing from the beginning until the last step. Without his guidance this thesis would not have been possible. It also gives me great pleasure in acknowledging the support and help from my second supervisor Prof. Dr. Stephan von Cramon Taubadel. My gratitude also goes to my supervisors in Bogor Agricultural University Indonesia, Prof. Dr. Ir. Rita Nurmalina, MS and Dr. Ir. Andriyono Kilat Adhi.
I dedicate this thesis to my beloved husband Galih Sudrajat and my dearest son Sultan Al Farizy and also to my lovely parents, who allowed me to continue my study in Germany, for their prayers, never ending support and encouragement for me. Furthermore my sincere thanks to all my friends and family in SIA program year 2013, SIA year 2012, Indonesian students community and my international friends who supported and gave me valuable relationship while I am studying in Germany.
Last but not least I would like to acknowledge the support the Indonesia-Germany Joint Degree Scholarship program from Directorate General of Higher Education, The Ministry of national Education Republic of Indonesia, for their finance and trust given to me to study in George-August Göttingen University Germany.
Bogor, April 2016
TABLE OF CONTENTS
LIST OF FIGURES x
LIST OF TABLE x
LIST OF APPENDICES x
LIST OF ABBREVIATIONS xi
1 INTRODUCTION 1
Background 1
Problem Statement 4
Research Objectives 4
Study Limitation 4
Organization of Study 4
2 BEEF MARKET OVERVIEW IN INDONESIA 5
Production, Consumption and Import 5
Policies on Beef Trade 9
Beef Market Chain 13
3 FRAMEWORK 16
Theoretical Framework 16
Price Volatility: Concept and Measurement 16
Drivers of Price Volatility 16
ARCH and GARCH Models 17
Previous Study 18
Operational Framework 20
4 RESEARCH METHODOLOGY 21
Data Description 21
Data Processing and Data Analysis Method 22
Price Volatility Analysis 22
5 RESULT AND DISCUSSION 26
Result 26
Discussion 32
6 CONCLUSIONS AND RECOMMENDATIONS 35
Conclusions 35
Recommendations 36
REFERENCES 37
APPENDICES 41
x
LIST OF FIGURES
1 World food and meat price index 1990-2014 1
2 Beef price development 2006-2013 3
3 Beef cattle population in Indonesia 2000-2013 5
4 Beef production in Indonesia 2000-2013 6
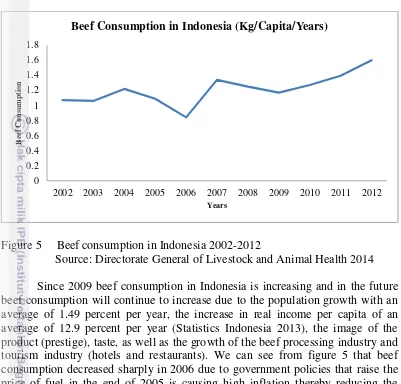
5 Beef consumption in Indonesia 2002-2012 7
6 Indonesia beef and cattle import 2006-2013 8
7 Local beef and beef cattle supply chain 13
8 Imported beef cattle and imported beef supply chain 14
9 Imported frozen beef supply chain 15
10 Operational framework 21
11 Flowchart estimation process for GARCH model 25
12 Daily beef price in Indonesia 2006-2013 26
13 Daily return of beef price in Indonesia 2006-2013 27
14 Conditional variance of beef price return 31
15 Conditional standard deviation of beef price return 33
LIST OF TABLE
1 Descriptive statistics of beef price 28
2 Unit root test result using ADF 28
3 ARCH LM test for ARMA model 29
4 Optimal parameter results 30
5 ARCH LM test for GARCH model 31
LIST OF APPENDICES
1 Graph of monthly beef price return 42
2 ARCH effect test for monthly beef price 42
3 ARCH effect test for monthly beef price 43
4 Unit root test result in daily return beef price 44
5 ACF and PACF Plots 45
6 ARMA (1.1) model output estimation 46
7 ARMA (1.1) model output estimation with two dummy variables 47
8 ARCH LM test after ARMA estimation 48
9 GARCH (1.1) model output estimation without dummy variables 49 10 GARCH (1.1) model output estimation with two dummy variables 50 11 GARCH (1.1) model output estimation with external regressor 51
12 ARCH LM test after GARCH estimation 52
13 Residual plots 53
14 Standardized residual plots 53
15 Correlogram of standardized residual 54
16 Normality test of residual 55
LIST OF ABBREVIATIONS
APFINDO : Asosiasi Produsen Daging dan Feedlot Indonesia (Indonesian Meat Producers and Feedlot Association)
ARCH : Autoregressive Conditional Heteroskedasticity
ASPIDI : Asosiasi Pengusaha Importir daging Indonesia (Indonesian Meat Importer Association)
BAPPENAS : Badan Perencanaan Pembangunan Nasional (National Development Planning Agency)
BSSP : Beef Self-Sufficiency Program
BULOG : Badan Urusan Logistik (National Logistics Agency) DGLAH : Directorate General of Livestock and Animal Health FAO : Food and Agriculture Organization
GARCH : Generalised Autoregressive Conditional Heteroskedasticity NAMPA : National Meat Processor Association
1
INTRODUCTION
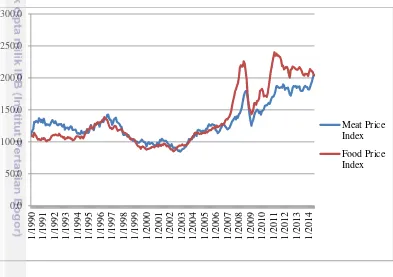
BackgroundIn recent years, the risks and uncertainties faced by consumers and producers due to fluctuations in food prices are likely to rise. The increase begins in 2004 and reached its peak at the end of 2007 to the summer of 2008. Price fluctuations may occur in short term, per month, per week, even per day, or may occur in the long term. Food prices including beef price are fluctuates. Food prices often fluctuate due to various factors, both natural phenomena (climate), market failures, also distribution problem. The existence of price fluctuation is a risk faced by producers and also consumers. We can see the fluctuations in food prices and world meat prices from 1990 through 2014 in Figure 1.
Figure 1 World food and meat price index 1990-2014 Source: FAO 2014
We can see in Figure 1 that the food prices from 1990 to 2000 are relatively stable and have been increasing since 2004 and a peak surges in 2008 due to the economic crisis that hit the world. Once it decreased until it finally rose again in 2011. Meat as one of many agricultural commodities is also experiencing the same effect with its prices following the pattern of food prices. As we can see, the economic crisis in 2007/2008 and 2011/2012 affected the price of meat, this is indicated in the figure where the two highest peaks occurred in 2008 and 2012.
Within the county some srategic food price commodities also increased, food commodities whose prices often fluctuate and become the spotlight in Indonesia are rice as staple food, corn, soybeans, wheat flour, sugar, cooking oil, onions, pepper, eggs, meat and milk (Sumaryanto 2009). This cause the risksand uncertainties faced by consumers and producers due to fluctuations in food prices.
2
Related to food consumption pattern of the Indonesian people, over this time the government's biggest concern focused on the retail price of rice as a staple food, wheat flour, palm oil, sugar, chili and red onion. But along with the increase in population, economic growth, and better education in Indonesia, there is changing dietary pattern in the middle income people. Their concern in healthy food is increasing and they add more proteins in their meal, such as: egg, chicken, beef and milk. Beef is one of food commodities from animal origin that has positive income elasticity, it means that people tend to buy more beef when their income is increasing (Soedjana 2011). Therefore it is also important to see the development of beef price because beef is a source of protein with increasing consumption number and has high price, beef also one of contributor to inflation in Indonesia. Indonesia became the country with the highest selling price of beef compared to some countries such as Malaysia, Singapore and Australia (Izzaty 2013).
The price increase is influenced by various factors, including closely related to the increase in demand, which reduced the amount of supply, as well as import and beef prices prevailing in the international market. The increase in demand commodity beef is very significant due to national religious festivals such as Ramadhan, Idul Fitri, and Idul Adha which will potentially increase the price, especially if it is not corresponded with sufficient supply. Besides the beef shortage which triggered from the high demand and low supply, another thing that causing high beef price in Indonesia is the distribution process from beef production center to the consumption center.
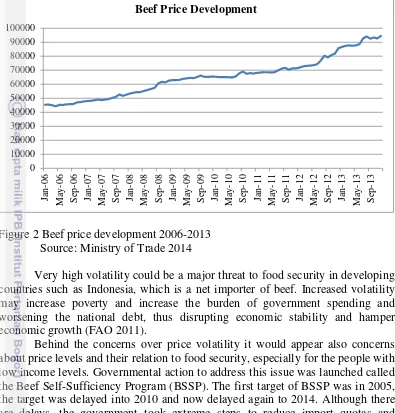
The Indonesian beef price movement increasing erratically and tends to be volatile in recent years. This can be seen from figure 2, which shows the development of beef prices over the last eight years which always rises every year. Based on data from the Ministry of Trade, the average increase in the beef price is 9 percent per year. With the highest price increase occurrs in 2008 which reach 14.57 percent compared to the previous year, from Rp 52 841/kg to Rp 63 544/kg. Growth rates which quite high also occurs from the year 2011 to the year 2012 in the amount of 10.37 percent and the highest growth of 17.58 percent was from 2012 to 2013 with a maximum price of Rp 97 709/kg.
Nationally, the beef prices situation in 2012 (until September 2012) is gradually increased from the beginning of January and begin to experience a surge in July 2012 (before Ramadhan), which reached 3.36 percent from Rp 74 393/kg to Rp 76 895/kg and in August 2012 rise again 3.78 percent from Rp 76 895/ g to Rp 79 800/kg. Based on the price monitoring in several production centers, there are beef price fluctuations in the consumer level across time and between provinces. The largest price fluctuations over time occurred in 2012.
expenditure. The impact will be significantly affect poor households and small scale farmers who are acting as net buyers.
Figure 2 Beef price development 2006-2013 Source: Ministry of Trade 2014
Very high volatility could be a major threat to food security in developing countries such as Indonesia, which is a net importer of beef. Increased volatility may increase poverty and increase the burden of government spending and worsening the national debt, thus disrupting economic stability and hamper economic growth (FAO 2011).
Behind the concerns over price volatility it would appear also concerns about price levels and their relation to food security, especially for the people with low income levels. Governmental action to address this issue was launched called the Beef Self-Sufficiency Program (BSSP). The first target of BSSP was in 2005, the target was delayed into 2010 and now delayed again to 2014. Although there are delays, the government took extreme steps to reduce import quotas and empowering potential local farmers in order to develop more. This government policy main goal is to achieve food security animal origin based on local resources, by increasing population and domestic production to meet the needs of the national beef.
Indonesia will experience a very great beef deficit in the medium to long term if the government has not made any efforts to increase production. Great deficit meat will further difficult the price stabilization in the country. The government needs to do a variety of urgent breakthrough efforts in the short term and medium term for the beef commodity price stability in the market, so that it can be maintained and affordable by consumer purchasing power.
The government's policy of the beef self-sufficiency program, although considered to be successful in increasing the population in the country and reduce the gap between demand and supply, but the target of Indonesia to be able self-sufficient in producing beef sparked controversy because it increases the price of
4
beef and disturb the domestic supply that makes the price volatile especially with beef cattle import reduction policy.
Complete information about the commodity prices behavior is needed not only the tendency or direction of change but also the volatility. It is important to understand the price volatility, and find out the cause and its effects on the economy in order to increase the effectiveness of the price stabilization policies and programs as well as to formulate more effective protection measures because the concept is closely related to the risks and uncertainties in decision making. Moreover, when communities are faced with price condition that are unstable and the pattern is irregular.
This study tries to present the relationship between the beef price volatility and Indonesia's efforts to ensure food security through self-sufficiency in beef. Therefore it is interesting to see how the beef price responds to the import reduction policy through beef self-sufficiency program and how it is affecting the beef price volatility.
Problem Statement
The Indonesian government has intervened in the beef market through many policies and one of the policies is beef self-sufficiency program. These interventions very likely influence the market performance, especially the price volatility. Therefore this study wants to find how the beef price responds to the beef self-sufficiency program. Thus the research questions of this study are: 1. How volatile is beef price in Indonesia?
2. Is Beef Self Sufficiency Program influence beef price volatility?
Research Objectives
Following the research questions, the objectives of this research are: 1. To understand beef price volatility in Indonesia.
2. To analyze the impact of beef self-sufficiency program to the beef price volatility in Indonesia.
Study Limitation
The scope of this study is the price volatility analysis to measure how volatile the price of beef at the consumer level and wants to explain one of the government programs to achieve food sufficiency through beef self-sufficiency program, whether or not the program affects the volatility of the beef price in the market. This study does not look beyond the effect of volatility on the marketing agents in each market chain.
Organization of Study
chain. Chapter 3 explains the literature reviews about theory and the framework of this study. Chapter 4 details the methods of this study. Chapter 5 presents the result and discussion. Chapter 6 concludes this study with conclusion, policy implications, and recommendations based on this study.
2
BEEF MARKET OVERVIEW IN INDONESIA
Production, Consumption and Import
Beef cattle in Indonesia spread throughout many provinces, but its concentration vary by region. Based on the data from Statistics Indonesia that were obtained from 33 provinces, the distribution of livestock population is mostly concentrated in Java. The biggest herd number is in East Java which accounted for more than 5 million of cattle, followed by Central Java, and South Sulawesi. The rest are spread in other provinces.
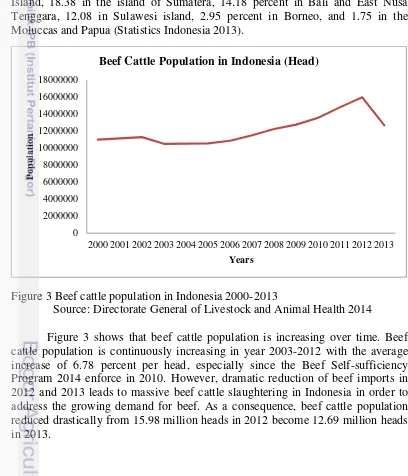
Based on the island, 50.68 percent of beef cattle population is in Java Island, 18.38 in the island of Sumatera, 14.18 percent in Bali and East Nusa Tenggara, 12.08 in Sulawesi island, 2.95 percent in Borneo, and 1.75 in the Moluccas and Papua (Statistics Indonesia 2013).
Figure 3 Beef cattle population in Indonesia 2000-2013
Source: Directorate General of Livestock and Animal Health 2014
Figure 3 shows that beef cattle population is increasing over time. Beef cattle population is continuously increasing in year 2003-2012 with the average increase of 6.78 percent per head, especially since the Beef Self-sufficiency Program 2014 enforce in 2010. However, dramatic reduction of beef imports in 2012 and 2013 leads to massive beef cattle slaughtering in Indonesia in order to address the growing demand for beef. As a consequence, beef cattle population reduced drastically from 15.98 million heads in 2012 become 12.69 million heads in 2013.
2000 2001 2002 2003 2004 2005 2006 2007 2008 2009 2010 2011 2012 2013
P
6
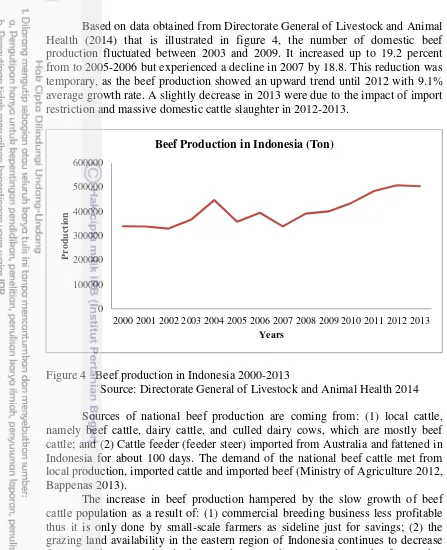
Based on data obtained from Directorate General of Livestock and Animal Health (2014) that is illustrated in figure 4, the number of domestic beef production fluctuated between 2003 and 2009. It increased up to 19.2 percent from to 2005-2006 but experienced a decline in 2007 by 18.8. This reduction was temporary, as the beef production showed an upward trend until 2012 with 9.1% average growth rate. A slightly decrease in 2013 were due to the impact of import restriction and massive domestic cattle slaughter in 2012-2013.
Figure 4 Beef production in Indonesia 2000-2013
Source: Directorate General of Livestock and Animal Health 2014
Sources of national beef production are coming from: (1) local cattle, namely beef cattle, dairy cattle, and culled dairy cows, which are mostly beef cattle; and (2) Cattle feeder (feeder steer) imported from Australia and fattened in Indonesia for about 100 days. The demand of the national beef cattle met from local production, imported cattle and imported beef (Ministry of Agriculture 2012, Bappenas 2013).
The increase in beef production hampered by the slow growth of beef cattle population as a result of: (1) commercial breeding business less profitable thus it is only done by small-scale farmers as sideline just for savings; (2) the grazing land availability in the eastern region of Indonesia continues to decrease due to residential used and others; and (3) slaughtering productive beef cattle that are very difficult to control so that the born calves growth decreased (Bappenas 2013).
Data show that on aggregate Indonesia is a net importer of livestock products, including beef products that tend to increase yearly. This condition illustrates the lack of supply nationwide. Domestic beef cattle production is fail to meet consumption needs in Indonesia so that the level of dependence on imports is still very high. Contributions beef to the needs of the national meat by 23% and expected to be continue to increase (Directorate General of Livestock Services
2000 2001 2002 2003 2004 2005 2006 2007 2008 2009 2010 2011 2012 2013
production growth is increasing by only 2%, so clearly there is a gap between the supply and demand that creates shortage in beef.
Figure 5 Beef consumption in Indonesia 2002-2012
Source: Directorate General of Livestock and Animal Health 2014
Since 2009 beef consumption in Indonesia is increasing and in the future beef consumption will continue to increase due to the population growth with an average of 1.49 percent per year, the increase in real income per capita of an average of 12.9 percent per year (Statistics Indonesia 2013), the image of the product (prestige), taste, as well as the growth of the beef processing industry and tourism industry (hotels and restaurants). We can see from figure 5 that beef consumption decreased sharply in 2006 due to government policies that raise the price of fuel in the end of 2005 is causing high inflation thereby reducing the purchasing power of the beef.
Beef consumption distribution is not spreading evenly in every province. In Indonesia there are different levels of meat consumption by community from one region to another. People in the western part of Indonesia (Sumatra and Java) have a high level of beef consumption, while in eastern part of Indonesia where a large numbers of cattle population spread, people has comparably low consumption level. Potential excess of beef cattle population is quite large that makes it difficult to be distributed to Java and Sumatra, which still needs large additional supply. Due to logistic constraints, especially cattle transportation system which is still inadequate in the end will affect the high price when they arrive in the hands of consumers.
Indonesia’s beef exports are very small, and export cattle did not even exist. The Indonesian import volume development of beef and beef cattle during 2006-2013 is shown in figure 5. Indonesia imported beef in the form of meat, edible offal and feeder cattle for fattening.
Imports of feeder cattle mainly are from Australia while imports of beef are from different countries of the world. Over the last 20 years Indonesian imports beef from Australia with a share of 50.54 percent per year, followed by
0
2002 2003 2004 2005 2006 2007 2008 2009 2010 2011 2012
8
New Zealand, USA, other Asia and Singapore with a share of 33.39 percent, 7.99 percent, 3.77 percent, and 2.89 percent. In addition, Indonesia also imported from European countries, Canada and other countries (Ardiyati, 2012). But Indonesia stops importing beef from USA since the country affected with food and mouth disease.
Ardiyati (2012) also writes Australia and New Zealand are two main exporting countries of imported beef in Indonesia. Besides giving the largest share, the development of Indonesia's imports from these two countries is fairly high respectively 44.75 percent and 43.68 percent each year. This can occur partly due to relatively close distance and well-developed trade relations. Thus the prices tend to be cheaper.
Yati (1993) states that the price of beef imported from New Zealand and Australia are relatively 50 percent cheaper than the price per kilogram of beef drastic decrease in the volume of imports of feeder cattle (Bappenas 2013). This policy is expected to drives local farmers to increase the amount of their cattle. This is consistent with the Government policy that targeted beef self-sufficiency by 2014 as stated in the Regulation of the Minister of Agriculture No. 19/Permentan/OT.140/2/2010.
Figure 6 Indonesia beef and cattle import 2006-2013 Source: Statistics Indonesia 2013
Imports of beef and feeder cattle was originally intended only to support and meet the needs of the growing beef demand in in the country amount.
2006 2007 2008 2009 2010 2011 2012 2013 0
Indonesian Beef and Cattle Import 2006-2013
However, in some areas it turns beef and feeder cattle imports this would potentially disrupt the local beef cattle agribusiness. Imported beef prices are relatively cheaper than the local beef because of the harvest management, production resource management of beef cattle in the exporting countries are more efficient resulting in lower production costs compared with beef cattle business in Indonesia. At the same time due to the increasing demand for meat, local productive cows illegal slaughter is also continue to occur and cause a national replacement stock diminishing and the long-term will inhibit the growth of local cattle population in the country. economically, which includes operational measures to increase population and the production and exploration of tariffs and steps of the SPS (Sanitary Phytosanitary) application (DGLAH 2011).
Beef self-sufficiency plan already started in 1999/2000 due to concerns over the low growth livestock cattle and increasing trend of beef consumption that follows the increase of per capita income resulting high beef imports. However, the realization on the 2000 plan is only by giving soft loan credits for the farmer to raise their cattle without up with a structured, systematic program formulation and targets.
According to the Regulation of the Minister of Agriculture No. 19/Permentan/ OT.140/2/2010 concerning the General Guidelines for Beef Self-Sufficiency Program 2014, this program is a joint determination and became one of the main program from the Ministry of Agriculture concerning the efforts to achieve food security based on domestic animal livestock resources, especially beef cattle. Self-sufficiency in beef has long been desired by the public so that dependence on imported cattle and beef both decreased by developing the potential resources in the country.
It clearly states in the Regulation of the Minister of Agriculture No. 19 year 2010 that the beef self-sufficiency program will obtain some advantages and value added, namely: (1) increasing the income and welfare of farmers; (2) additional absorption of new workers; (3) foreign exchange savings; (4) optimizing the utilization of local cattle; and (5) increasing the supply of beef that is Safe, Healthy, Whole and Halal (SHWH) for the community so that tranquility is guaranteed.
10
from the previous beef sufficiency program in 2005 and the beef self-sufficiency acceleration program in 2010, which both are failed to achieve.
Beef self-sufficiency phase according to the Directorate General of Livestock and Animal Health (2011):
1. Pre 2000
The government provides credit loans to help small farmers with fattening and breeding cattle.
2. Plan of 2000
The first beef self-sufficiency program was initiated to be realized in 2005 with the name of Beef Sufficiency Program (BSP). But this program is not successfully realized due to limited supply chain, land shortage for breeding and production. The program lasts from year 2000 to year 2005, but the program did not achieve the desired target because at that time the program is too characterized by discourse, seminars and workshops without being followed by concrete measures both policy and technical activities.
3. Plan of 2005 called Accelerated Beef Self-Sufficiency Program (ABSSP) between 2008 and 2010. heads. To compare, the cattle’s slaughtering in various abattoirs in Indonesia around 2.4 million heads a year. It means that more than 60% of the slaughtering in Indonesia has been dominated by imported cattle.
4. Plan of 2010
Beef self-sufficiency program was declared unsuccessful because of the failure to achieve three main objectives of the program. Moreover Yusdja et al. (2004) discussed that there are five reasons of the failure, they are: 1) program policies which formulated are not accompanied by a detailed operational plan, 2) programs are made top-down and a small scale compared with the objectives to be achieved, 3) generalized strategy in implementing the program without consideration about the uneven population region, but more oriented to the competitive commodity, 4) implementation of programs do not allow for evaluation of the impact of the program implemented, 5) programs are not clearly have an impact on the growth of the national population. Ashari et al. (2012) also adds that during the 2000-2005 periods the implementing organization is not formed, so that the implementation of activities is unclear and unfocused. While in the period 2005-2010, the executive is the technical team but non-operational.
The government's policy is intended to reduce the import of beef either in the form of frozen meat, beef cattle or edible offal in the hope of encouraging growth in domestic beef production and the added value of livestock subsector also create jobs. Beef self-sufficiency can be achieved if domestic beef production can meet at least 90 percent of the total national beef. Self-sufficiency is defined as 90% 95% of beef consumption from domestic production with imports is 5% -10%.
Tariff and Import Quota
In order to give protection to local farmers it is necessary to impose tariff on imports of beef and live cattle. There are two different types of tariff implies for beef and for beef cattle. The government implied 5% import tariff since 1999 until today for beef and for the edible offal which turned out to be equated with type of meat. However the government imposed 0% tariff for breeding cattle and feeder cattle. Cattle imports required for breeding business and produce feeder cattle, thus imposed tariff 0%. Import tariff feeder cattle also charged an entrance fee of 0%, this is possible because the fattening activities will provide added value and create jobs.
The import quota policy imposed to support the achievement of beef self-sufficiency. Thus, frozen beef and live cattle import is restricted since 2010. The establishment of import quota also leads to problem because the government is less accurate in calculating the amount of meat for domestic consumption, processing industry and others, and the ability of local cattle to provide beef. The administration of larger quotas causing local cattle prices fall in 2008-2009, while granting smaller quota causing beef prices to rose sharply as it did in 2010-2012.
Import restriction policy of the Australian feeder cattle and beef imports have caused the supply of beef in the country became increasingly scarce so that the price of beef lifted. The increase in fuel prices, Ramadan and Eid festivals also raised prices so beef prices continue to climb and difficult to go back down. These conditions cause the movement on the livestock policy authority from the Ministry of Agriculture to the Ministry of Commerce.
12
National Beef Price Control Policy
The government, through the Ministry of Trade removes the limited import quota system and replaced it with a reference price mechanism. Minister Decree No. 46 / M_DAG / PER / 8/2013 has been established on 30 August 2013 on the terms of import and export of Animals and Animal Products. One article which leads to controversy is Article 14 verse 2 about the reference price to stabilize prices. Price reference is reference price of sales at the retail level set by the beef prices monitoring team established by the Ministry of Commerce. The effort is to regulate the import mechanism of animals and animal products by using the reference price. Import will be automatically done if domestic prices exceed 15 percent of the reference price. It also Give permission to the government to appoint a National Logistics Agency (BULOG) to import animals and animal products, as long as the imported beef is distributed to the retail market.
Beef imports trading activities carried by BULOG is to stabilize the price of beef in the country. In this beef trade, BULOG bought beef imported from Australia according to Import Letter of Approval from the Ministry of Trade which required by beef importers who purchase or import beef in Indonesia. Procurement by BULOG is currently concentrated to fulfill the beef stock in Jakarta and West Java. The stock of imported beef is saved in cold storage in
Jakarta that is near from BULOG’s beef sales area. Locations of the distribution
are including areas of Jakarta, Depok, Bogor, Tangerang, Bekasi and Bandung. Besides, BULOG through BULOGMart also distributes beef imports through cheap market, bazaar, weekly market and an exhibition of food products, which are sold by retailers.
BULOG beef imports selling mechanism to maintain price stabilization in the beef market are (BULOG 2013):
1. Sales in strategic markets both traditional markets and modern markets; 2. Provide Freezer by BULOGMart to be distributed to the village, Cooperative
and houses;
3. Selling through Association and Distributor;
4. Direct Selling by renting a stall in strategic markets.
BULOG’s activities conduct so far is keeping the floor prices for grain, particularly the cost of price stabilization, rice allocation to the poor, and management of food stocks. Although the focus of BULOG previously only on a single commodity, namely rice, but BULOG actually also have experience in terms of stabilizing and multi-commodity supply management in the era of the 1980s until the early 1990s, before finally BULOG limited authority.
The appointment of BULOG as a price stabilizer of meat is to give permission to import frozen beef from Australia, accounted for 3000 tons in the year 2013, divided into two delivery mechanisms, 800 tones by air and 2200 tones by sea. Furthermore, BULOG will conduct market operations to stabilize the price of beef by cooperating with meat retailers who are members of the association, as well as selling directly to traders at the market stalls. The price that will apply by BULOG ranged from Rp70000 to Rp80000 / kg (Permana, 2013).
amendment to the Regulation Decree No. 46 / M-DAG / PER / 8/2013. The amendment is highlighting chapter 18 which stated the role changes of BULOG, so that its authority to distribute to retail market is eliminated.
Beef Market Chain
In general, beef supply chain in Indonesia consists of: farmers, middleman, cattle market place, wholesaler, butcher or small scale trader, slaughter house and consumers. It can be divides into domestic beef cattle, imported beef cattle and imported frozen meat.
Figure 7 illustrate the domestic cattle supply chain. The farmers sell their cattle to the middleman or village collector and in Indonesian term called
“Blantik” or they also can sell it to the nearest cattle market place. Furthermore, the cattle are sold to wholesalers or to beef butcher (traders who buy live cattle and cut it by themself to be sell). Large cattle traders sell cattle to other areas, including Jakarta, Bogor, Depok, Tangerang, Bekasi and even beef from cattle production centers in east Indonesia (East Nusa Tenggara, West Nusa Tenggara, Bali) sold to Borneo.
Figure 7 Local beef and beef cattle supply chain Source: Bappenas 2013
Consumer
Large Cattle Trader Beef Retailer
Beef Wholesaler/ Slaughter House
Cattle Market Place
Village Collector/ Middleman
Farmer
14
Cattles slaughtered by butcher in either public owned or private owned slaughter house, or in individual slaughtering place. The beef cuts from this process consist of various meat part, offal (intestines, liver, lung, heart, etc.), head, tail, skin and feet. These beef cuts and its edible offal will be purchased by beef retailers who will then sell them in traditional market, with various types of buyers such as household consumers, restaurant/food stalls, and meatball seller.
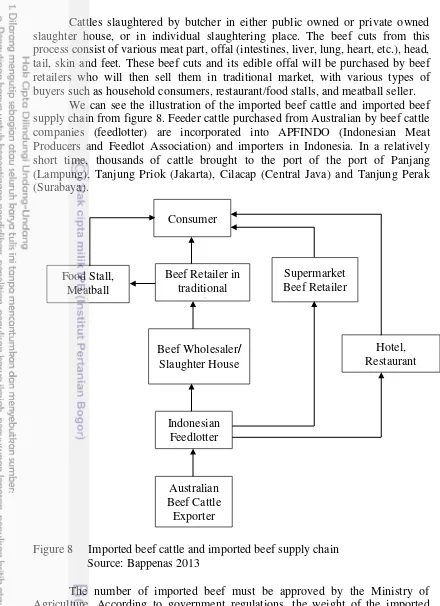
We can see the illustration of the imported beef cattle and imported beef supply chain from figure 8. Feeder cattle purchased from Australian by beef cattle companies (feedlotter) are incorporated into APFINDO (Indonesian Meat Producers and Feedlot Association) and importers in Indonesia. In a relatively short time, thousands of cattle brought to the port of the port of Panjang (Lampung), Tanjung Priok (Jakarta), Cilacap (Central Java) and Tanjung Perak (Surabaya).
Figure 8 Imported beef cattle and imported beef supply chain Source: Bappenas 2013
The number of imported beef must be approved by the Ministry of Agriculture. According to government regulations, the weight of the imported cattle should not be more than 350 kg/head for fattening period of 90-100 days in Indonesia, thus, it has an effect in economic terms by creating added value in the form of increase in the weight of the meat, employment, utilization of transport services, utilization of industrial waste for feed, and others (RPJMN 2013). However, in urgent circumstances to meet the needs of the domestic market, the
Consumer
Hotel, Restaurant Beef Retailer in
traditional market
Beef Wholesaler/ Slaughter House
Indonesian Feedlotter
Australian Beef Cattle
Exporter Food Stall,
Meatball Seller
weight of the imported cattle could exceed the provisions and can be directly slaughtered after arriving in Indonesia. Feedlot companies and importer cut their own beef cattle and they also sell it to the public slaughter house or private slaughter house.
Cattle slaughtered at the slaughter house owned by the feedlotter company can directly distribute to supermarkets, hotels and restaurants. While other retailers who is selling in the traditional market usually buy beef from the public slaughter house or private slaughter house, which will be sold to the meatball seller, food sellers and household consumers.
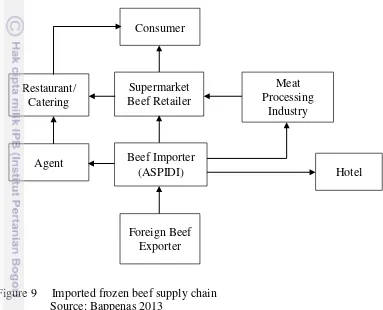
Figure 9 Imported frozen beef supply chain Source: Bappenas 2013
Figure 9 illustrates the imported beef supply chain. Imported beef from Australia, New Zealand, and other countries are usually in the form of frozen beef meat (including offal, liver, heart, tail, etc.). They are purchased by the company member of Indonesian Meat Importer Association (ASPIDI).
Imported frozen meat is directly sold to the meat processing industry which joined NAMPA (National Meat Processor Association), supermarkets, hotels, and agents. It is not allowed to be sold to the traditional market. The quality of the meat sold to the processing industry generally is second class, while the first class (prime cut) being sold to the luxury hotels and supermarkets. Processed meat that produced by the processing industry are: sausage, smoked beef, burgers, and others. Processed products are then sold to supermarkets. Supermarkets sell fresh meat to the restaurant/catering, and sell processed products to consumers. Agents selling beef imports meat (including offal, liver, heart, tail, etc.) to the restaurant / catering.
Consumer
Hotel
Agent Beef Importer
(ASPIDI)
Meat Processing
Industry
Foreign Beef Exporter Restaurant/
Catering
16
3
FRAMEWORK
The underlying theories and concepts of this study are addressed in this chapter. However these explanations were not aimed to prove how the theories and concepts work in detail, but to indicate the relevancy of this empirical study to the theories and concepts.
Theoretical Framework
Price Volatility: Concept and Measurement
Volatility term refers to the unstable conditions, tend to vary and difficult to estimate. The two principal concepts for volatility are variability and uncertainty. Overall movements away from the mean refer as variability and unpredictable movement refer as uncertainty (Prakash 2011 and Sumaryanto 2009).
We can define volatility as a measure of price fluctuation over some period of time or a prediction of a price movement over a time period. Volatility also explains the variance of data compared to their mean. According to OECD (2011) volatility is variations in economic variables over time. Brümmer et al. (2013a) described that volatility is unobservable that refers to unexpected price changes, but still needs to be estimated.
Price volatility is generally associated with a rapid price changes in each period. Some measure of volatility and risk assessment are based on the variance, standard deviation, and coefficient of variation (Anderson et al. 1977). Measuring price volatility using the standard deviation of log changes in price returns is the simplest way (Gilbert and Morgan 2010).
There are two types of measurement that is frequently used in calculating price volatility, they are:
1. Realized volatility, this calculation is based on the historical or observed movements from an economic variable like agricultural prices in the past that reflects the determination of supply and demand factor (Tothova 2011).
2. Implicit volatility, this measurement wants to know the volatility of an asset in the future that shows the responsiveness of the commodity price to current market conditions (Tothova 2011).
Drivers of Price Volatility
Prices of agricultural commodity are often random, that can lead to risk and uncertainty into the process of projecting and modeling the market. There are many available methods to analyze price volatility, but agricultural commodity prices cannot be analyzed as financial price volatility because of agricultural commodity price has its own characteristic (Piot-Lepetit and M’Barek 2011). Furthermore Piot-Lepetit (2011) mentioned that price volatility is an important factor that reflects the risk on product availability, especially in perishable agricultural products which have inelastic demand and uncertainty in production.
According to Brümmer et al. (2013a; 2013b) based on summarize from recent empirical research, there are several main drivers that influenced price volatility, they are:
2. Demand, increasing trend of middle class in developing countries, including Indonesia, which increases the consumption of meat as dietary pattern changes.
3. Storage, in the periods of low stocks, with high demand the stock availability of stock seems to be decreasing higher price volatility.
4. Oil Prices, there are direct effect of increased oil prices on production processes in agriculture, especially for the use of machinery and transportation.
5. Macroeconomic factor, macro policies have a substantial impact on the stability of a whole economy that will affect the agricultural price volatility. 6. Specific policies, government policies concerning the control of the market
price, import restriction policy affects price volatility.
ARCH and GARCH Models
Modeling of time series data is generally done by using the assumption that constant residual variance (homoscedastic). But in reality there are many of the time series data that have non constant residual variance (heteroskedastic), especially for the time series data in economics. That is why the time series models with homoscedastic could not be used.
ARCH (Autoregressive Conditional Heteroscedasticity) is a model that takes into account the presence of heteroskedasticity in time series of data analysis. The primary principles of modeling autoregressive conditional heteroscedasticity (ARCH) was originated by Engle (1982) which is used to model the residual variance that depends on the square of the residual in the previous period in autoregression. The model was applied to analyze the behavior of inflation in the United Kingdom in the period 1958:2-1977:2. The equation used is first order autoregression and estimated using ARCH models. In the paper, Engle explains that the the time series data model with high volatility are likely to contain the problem of heteroscedasticity.
Bollerslev (1986) complete ARCH models developed by Engle (1982), but in the same analytical framework. This is done by inserting the residual elements of the past and the residual variance in the autoregressive equation. The model is called the Generalized Autoregressive Conditional Heteroscedasticity (GARCH). Using data on United State of America inflation with autoregressive equation, Bollerslev try reevaluate ARCH inflation model of Engle. The results show that by incorporating elements of the residual variance in the regression equation produces better than ARCH models (Bollerslev 1986).
Volatility based on GARCH (p, g) the model assumed that the variance and fluctuations of data is affected by a number of p data from previous fluctuations and q data from previous volatility. In general, this model as autoregression (AR) and moving average (MA), that looks the relationship of random variables with the random variables in the period before.
In ARCH models, the residual variance of time series data is not only influenced by the independent variable, but also influenced by the residual value of the variables studied. ARCH (1) model can be represented as:
18
Where: Ytis dependent variable, X is independent variable, ε is residual/error,
is residual variance and is the ARCH component.
Residual variance has two components, they are constant and residual from the previous period. That is why the ARCH model called the conditional model, when recent period influenced by the previous period. In reality, conditions that often happens that this mean is very dependent on the volatility of the past few periods (conditional mean) or the current variance depends on the volatility of some of the previous period. This raises the number of parameters in the conditional mean or the conditional variance to be estimated. Estimating these parameters is difficult with accurate precision. To overcome these problems, the team Bollerslev (1986) developed a GARCH model.
GARCH model is an improvement on ARCH model is actually a further elaboration of ARCH models that have conditional information. Along with the increasing lag (p) are estimated on ARCH models, it will be more difficult to estimate a parameter because the likelihood function will be very flat or in other word the estimator precision is less. Because of that GARCH models usually recommended to estimate volatility. GARCH models allow the calculation of time-varying volatility (time varying volatility) and volatility clustering, as well as an extremely flexible model and perform well with reasonable restrictions on the coefficients and using only a few parameters. The simplest GARCH model called GARCH (1.1) can be written as follow:
………..………...…………..………(2)
From the equation (2) above, we can tell that GARCH model assume
today’s conditional variance from error ( ) consist of three parts, they are: (1) constant variance, , (2) volatility from previous period which is measured as lag from mean residual quadrat from previous period or we can call it ARCH term, , and (3) variance forecast of previous period or GARCH term, . Thus we can say that is a parameter that describes the effect of stochastic deviations in the previous period on the conditional variance, and is the influence of the variance of previous period on current variance.
In order to make the above equation possible to estimate there are two restrictions to fulfill, they are: (1) all the variances must be positive ( >0, >0, >0) and the sum of all weights must be smaller than 1 ( + <1). This number shows the persistence degree of volatility in time series data. Piot-Lepetit (2011) describes that if the sum of + is close to 1, it means that the greater of the volatility tendency to persist for long time, and if the sum of + is greater than 1, there is an indication that the data series exploded with a tendency to meander away from the mean value.
Previous Study
changes in short time. This also supported by Piot-Lepetit and M’Barek (2011) which highlight some characteristics of agricultural prices, namely: (1) seasonality, some natural factors like weather, diseases and other factor could
impact the farmer’s expectation regarding to the cattle output, price of the cattle and input like feed needed to produce. (2) Other agricultural linkage, there are long chain in beef cattle agribusiness process, from the up-stream industry like the cattle breeder industry, medicine and feed industry before finally the cattle reared
and fattened by the farmer. Farmer’s yield will be distributed and processed and
by the end will impact the prices of the end product. (3) Production responsiveness, small changes in supply quantity could result a large price change, it means that in short term the price elasticity of agricultural supply and demand are inelastic. If the beef price increased when stock is low, then the short term supply could not give much response to the beef price. In contrast when the beef price decreased the producer may have to postpone the sale until the price is improved. (4) Elasticity, it shows the magnitude of the agricultural commodity price fluctuation, which can be illustrated by the supply and demand curve.
Volatility of agricultural prices also influenced by political situation that happens in a country so that the price volatility can be differ over time. In the case of Indonesia, Sumaryanto (2009) finds that volatility of some agricultural commodities retail prices in Indonesia is more volatile in the period after the reform in 1998 compared to the period before the reform. Interesting findings from his research is empirically proves that since the reform food prices volatility is increasing, so these conditions shows the influence of socio-economic stability of the volatility of food prices, besides that changes in trading systems and political policies also have an impact on the volatility of the price of food commodities.
The government has a major role in setting policy that able to overcome the price volatility on agricultural commodities problem. OECD-FAO (2011) explains that a coherent policy is needed as an effort to reduce volatility and restrict its negative impacts. The policy consist of: (1) mitigate volatility through increased market transparency, improvement of global and national information as well as increased surveillance system of the market outlook, and (2) the management of volatility through the social security mechanism to help consumers who are most vulnerable when the price food increase. One important
factor that can influence the success of the government’s policies efforts to overcome price fluctuation is the knowledge of the volatility pattern.
Arifin (2011) explains that in order to reduce the volatility of food prices, Indonesia requires policies that can improve the functioning of the running economic system and strengthen the country resistance in tackling a wide range of negative impacts due to the extreme food price volatility. Meanwhile, Daryanto (2010) explains some important efforts to cope with repeatable price fluctuations are: effective logistics management, marketing infrastructure improvements, improved marketing channels, improved market information, and the development of agro-industries that create added value based on form utility.
20
and GARCH models have been used in several studies in various field like finance and agriculture.
ARCH-GARCH models use in agriculture including research conducted by: Gilbert & Morgan (2010), Apergis & Rezitis (2011), and Busse et al. (2010). Gilbert & Morgan (2010) find in their study that there are several factors driving volatility, namely production, consumption, stocks and speculation. They calculate volatility using logarithm of standard deviation and also GARCH model. They empirically prove that food prices become more vary. Meanwhile Apergis & Rezitis (2011) study about domestic food price volatility in Greece, the purpose of their study was to determine the impact of several macroeconomic factors on volatility. They use GARCH and GARCH-X models, and their findings show that higher volatility increases uncertainty of the price in the food market. Busse et al. (2010) use GARCH models to analyze the time series data of rapeseed prices, they find that rapeseed prices are sensitive to shocks and there is an increasing correlation between rapeseed and crude oil prices volatility.
Based on these studies, the ARCH/GARCH model is an appropriate model to analyze the price volatility using time series data. Therefore, this study was conducted using the ARCH/GARCH model to analyze the beef price volatility in Indonesia.
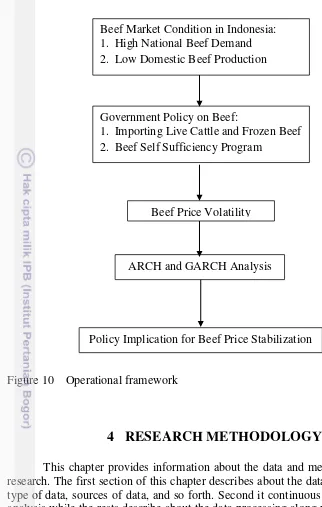
Operational Framework
Beef is one commodity which has a big influence on the nutrition improvement of the community in Indonesia, especially animal protein that is needed in human development because it is closely related to physical health and development of human intelligence. In line with the addition of the population, economic growth and a better level of education in Indonesia, the demand and the level of consumption of beef shows increasing annual trend.
Household incomes improvement shift the consumption patterns of the middle class that makes beef consumption increased but not followed by an increase in domestic beef production. Domestic beef production growth is lower than the growth in beef consumption which can lead to fluctuations in the price of beef. If the beef supply is high then the price will be low, otherwise if the supply is low, then the price will increase (ceteris paribus). The high beef price is because of the limited supply in response to demand.
Since 2010, the Indonesian government policy tries to achieve self-sufficiency in beef which is targeted to be achieved in 2014, in response to high domestic demand for beef. Domestic beef demand has been met from domestic production plus imports. Beef self-sufficiency program has a target to meet domestic demand of 90-95% through domestic production with imports only about 5-10%. Therefore, over the last 5 years since 2010, the government tried to reduce imports. The objective of self-sufficiency of beef in addition to reducing dependence on imported beef from other countries, it is also to improve the beef productivity from local farmers in the country so as to improve their welfare.
Figure 10 Operational framework
4
RESEARCH METHODOLOGY
This chapter provides information about the data and methodology of the research. The first section of this chapter describes about the data description: the type of data, sources of data, and so forth. Second it continuous with the method analysis while the rests describe about the data processing along with steps and all operations conducted.
Data Description
This study is using secondary data to understand the volatility of beef price series in Indonesia, we consider a series of consumer daily beef price, the data used in this analysis are daily observations from January 2006 to December 2013, with total 2086 observations. Data was obtained from Ministry of Trade, Government of Indonesia. The data was collected through market survey from three different markets in 33 capital provinces in Indonesia.
Beef Price Volatility
ARCH and GARCH Analysis
Policy Implication for Beef Price Stabilization Beef Market Condition in Indonesia:
1. High National Beef Demand 2. Low Domestic Beef Production
Government Policy on Beef:
22
Data Processing and Data Analysis Method
Data processing in this study is using descriptive analysis and quantitative analysis. Descriptive Analysis is used to describe the beef price volatility phenomena. Quantitative analysis is used to analyze the magnitude of beef price volatility in Indonesia using GARCH model. The Data is process using Microsoft Excel and Eviews 6. Graphic analysis of price movement conducted with a plot graph to see the time series trend. GARCH analysis stages consist of identifying the ARCH effects, the model estimation, model evaluation and volatility measurement.
Price Volatility Analysis
GARCH Model
We do further volatility analysis using ARCH/GARCH models. The stages of volatility analysis using ARCHGARCH models are: identification of ARCH effects, model estimation and model evaluation.
1. ARCH effect identification
ARCH-GARCH modeling starts by identifying whether the beef prices data contains heteroskedasticity or not. One of ARCH effects test on beef price data can be done by observing the autocorrelation of the squared coefficient of the price data. We can say whether the data has ARCH effect when the data has autocorrelation in the squared value of beef price data and the square of beef price data is significant at the 15 first lag examined of the Autocorrelation Function (ACF) and Partial Autocorrelation Function (PACF) data.
2. Model Estimation
There are two steps in the Estimation of ARCH-GARCH models, namely the (a) identification and determination of mean equation and (b) identification and determination step in ARCH/GARCH models.
A. Identification and determination of the mean equation
Determination of the mean equation is performed by following procedure Box-Jenkins method. Box-Jenkins procedure consists of several stages of stationarity test data, the determination of the tentative ARIMA model and the selection of the best ARIMA model.
1) Unit Root Test
In a time series analysis, stationarity is important. Therefore, prior to further analysis of the ARCH-GARCH models we have to employ the stationarity test. The stationary of each series data is needed to prevent the spurious regression in the model. Spurious regression implies that the result of the regression may not be as good or significant as they seem. If the variable has a unit root, then the data is said to be biased and data are not stationary so it is necessary for a differentiation until the data becomes stationary.