PROCESS-BASED MODELLING
OF
GROWTH AND CARBON SEQUESTRATION
OF
YOUNG
TEAK (Tectona grandis
LA)
BY
E L I Y A N I
SCHOOL OF POST GRADUATE
BOGOR
AGRICULTURAL UNIVERSITY
ABSTRACT
ELIYANI. Process-Based Mdelling Growth and Carbon Sequestration Of Young Teak (Tecmna grandis L.f.1. Under the direction of H ANDQKO, YONN
Y
KOESMARYONO, RUDY C. TARUMINGKENG a d RONALD F. KUHNE.The objectives of the research are : 1 )
To
understand the processes in phenology, growth, and water balance of teak and its interaction with environmental factors, as the basis for designing quantitative relationships in modelling activity, 2) To caiibrate a process-based model that can describe the relationship between teak growth and soil water availability, 3) To predict the carbon sequestration of teak.The research consists of a modelling project and a field experiment to obtain model parameters. The model consists of three sub-models, 1.e. development, growth, and soil water balance. The objective of the m d e l is to simulate teak growth, development and carbon sequestration as affected by soil moisture regime and weather variables. The model predicts individual teak
growth, development and carbon sequestration on a daily time step.
The field experiment was conducted for two years in Jakarta, with three levels of irrigation: control (0) , 7 and 14 mm day-' to reflect varymg seasonal water regime. The measurements included pheno fogy,i. e. : leaf emergence and drop, growth, i. e. : biomass production, arbon content, w d density, stem height diameter and volume, leaf number and leaf area index, climate variabies, i.e. : rainfall and solar radiation, and soil water content. The climatological data to run the model was obtained from the Climatological Station at Pondok Betung,
Tangerang, Province of Banten, Indonesia.
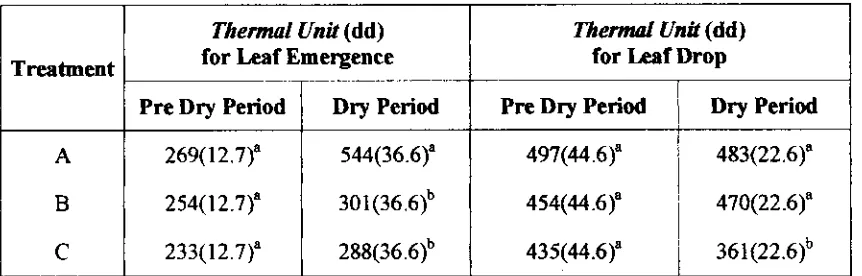
The results show that soil water availability affected teak development and growth. Leaf emerged regularly after reaching a thermal unit of 265 dd in the non- water deficit condition. Leaf dropped regularly in wet and dry seasons after reaching a thermal unit of 460 dd. Water deficit inhibited leaf emergence and
fasten leaf drop for the plants that always received excessive water input.
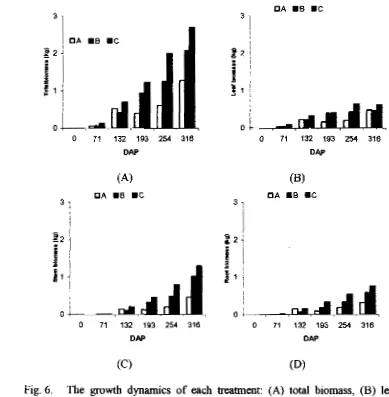
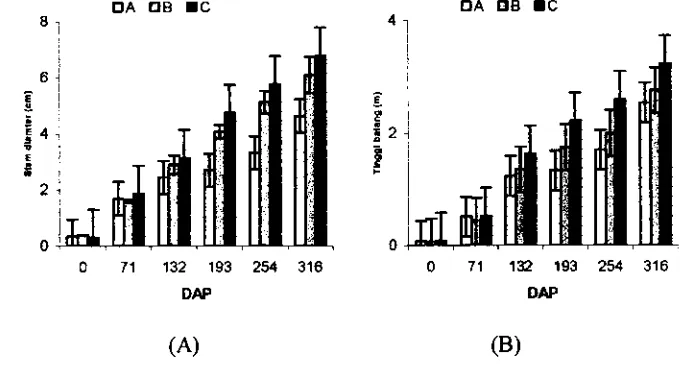
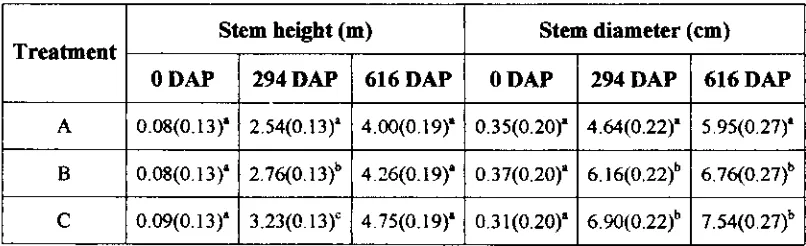
Water deficit reduced biomass production, stem diameter and height, stem volume, light use efficiency. leaf number and leaf area index. Water availability did not affect carbon sequestration by teak. The excessive of water tended to reduce wood density.
As water deficit affected growth and development, biomass prduction in
the model was corrected by a water availability factor. The water availability factor used in this model is the ratio of actual and maximum transpiration.
DECLARATION
I declare that all of the statements in this dissertation titled:
"PROCESS-BASED MODELLING OF GROWTH AND CARBON SEQUESTRATION
OF YOUNG TEAK (Tectona grandis L.f.)n
are the ideas and research results of my own dissertation under the duection of the Advisory Committee, except the statements which are clearly referred to. This dissertation has not been submitted to obtain a degree in similar program in other
universities.
All of the data and information used have been stated clearly and wuId be
examined.
PROCESS-BASED
MODELLING
OF GROWTH AND CARBON SEQUESTRATlON
OF YOUNG TEAK
(Tectona grandk
Lf.)
BY
E L I Y A N I
A dissertation submitted to
Graduate School of Bogor Agricultuml University, Indonesia I n fulfillment of the requirements for the degree of
Dactorate in Study Program of Agroclima tology
SCHOOL
OF
POST GRADUATE
BOGOR
AGRICULTURAL UNIVERSITY
Dissertation Title : PROCESS-BASED MODELLING OF GROWTH
AND CARBON SEQUESTRATION OF YOUNG
TEAK (Tectona gmndts L.f.)
Student Name : ELIYANI
Student ID : 995195
Study Program : Agroclimatology
T h s dissertation is approved by:
1 . The advisory committee
Dr. Ir. Handoko. MSc. Supervisor
Prof. Dr. IT. Rudy C. Tanuninaeng Co-supervisor
-
w
Dr. Ir. Yomy Koesmaryono, MS. Co-supervisor
Dr. Ronald F. Kiihne
Co-supervisor
L o o 1 of Past Graduate
2. Chairman of Study Program
-&&2,
Prof. Dr. Ir. Ahmad Bev , a -
.
Ir. gafnda Manuwoto, MSc. 4 ~ c 9 ! & 3 P //CURRICULUM VITAE
The writer was born in Bangka Island on 21 February 1 %9 from Bapak Abdul Malik Akoem (Alm.) and Ibu Syamsiar Marzuki, as the eldest of three children. In
1986, the writer was graduated from senior high school SMA Negeri Belinyu-Bangka.
In the same year, she was accepted in Bogor Agncultwal University at Faculty of
Mathematics and Science, Department of Geophysics and Meteorology, Study Program
Agrometeorology , graduated in 1 99 1
.
The writer has been working as a lecturer since 1994 in Mercu Buana
University, Jakarta, Faculty of Agriculture, Study Program Agronomy. In 1998, the writer was accepted in Study Program Agroclimatology, School of Post Graduate,
Bogor Agricultural University with the scholarshp fiom Mercu Buana University. h
1999, the writer had a chance to up grade the study from Master Degree to Doctorate
Degree and received a scholarshp from the Habibie Center for one year and continued
with the schoImhip fiom Mercu Buana University for two years and the last two years
horn Ministry of National Education. In 2004, the writer was granted a scholarship from DAAD for the short visit in Georg-August Universitiit Wttingen, Germany.
The writer is a founding member of International Society of Agometeorology (INSAM) in 2002 and a member of Indonesian Society of Agrometeorology
FOREWORD
All the praises and thanks be to Allah, the Lord of the 'Alamm. The title of the
research, which was held in April 2002 to February 2004 is "Process-Based Modelling
of Growth and Carbon Sequestration of Young Teak (Tecronu g r a d s L. f.)".
The results had been presented in Georg-August Universiut GCIttingen in Institut fir Tropen Pflanzenbau on 20 April 2004 with the title: "Introducing Fast Growing
Teak (Tecfonn g d i . ~ L. f.) in Indonesia" and Institut
fiir
Bioklimatologie on 17 May2004 with the title: "The Possibility to Develop Fast Growing Teak Plantation In
Central Sulawesi Indonesia". The paper with the title: "Modelling Growth and Carbon
Sequestration of Teak (Tectonn gmndis L. f)" was presented in Deutcher Tropen Tag on 6 October 2004 in Humbolt Universi~t Berlin. The abstract of the paper has been published on the proceeding and can be downloaded via Internet.
I would like to express my heartfelt thanks and sincere appreciation to my
supervisors: Dr. Ir. Handoko, MSG., for the guidance, encouragement, and the 'soul' of
the process-based modelling, Dr. Lr. Yonny Koesmaryono, MS and Prof. Ir. Rudy C.
Tarumingkeng, MSG., PhD for the guidance and encouragement during the research,
and Dr. Ronald F. K h e , for the guidance, the chance to be and to present the research
result in Georg-August Universitit Gdttingen.
I am also most grateful to the Agroclimatology Program, particularly to Dr.
Ir.
Yonny Koesmaryono, MS for allowing me to up m emy study from Master degree to Doctorate degree and to all my lectures.
Thank you to Prof. Dr. Ir. Hidayat Pawitan, Prof. Dr. Ir. Cecep Kusmana,
MS
and Dr. k. Hattisari Hardjomidjojo for bemg available to be the examiners of my final
Thanks are also extended to my fiiends Temmy Desiliyarni, MSi., A h D.N.
Makalew, MSc., Fadjry J u h , MSi, Agus Muhammad Sholeh, MSi Dr. M. S y u h Nur,
N u d Aini, Msi, Ema Adiningsrh, MSi and Rudy Sulistyono, MSi for the discussion
and help. The appreciation also goes to my Indonmian friends in GCittingen especially
Dodo Gunawan, MSc. for the library card, data and the chance to be in the lnstitut fiir
Bioklimatologie, Dr. A. Shodiq, Nunung Nuryantono, MSi
and
Teh Iis for guiding meto use the on-line library also for the fiendship, and to Pak Arif and Inan for the bicycle
and friendship. Thanks also to the staffs of Agroclimatology, the staffs of Service and
Soil Laboratory SEAMEO-BIOTROP and the staffs of Soil taboratory IPB for all the
best support they extended in terms of facilities and services. Special thanks to Dim Jdiarti, Wan, k a and Nini for the help in the field.
figh appreciation goes to Mercu Buana University, SEAMEO BIOTIIOP, the
Habibie Centre, DAAD, the Ministry of National Education, Institut fth Tropen
Pflanzenbau and Inmtut fiir Bioklimatologie Georg-August Universitai Gottingen for the facilities and financial support of t h i s study.
The most profoundly and deeply appreciation must go to my mother and my
sisters, Tity and Nini, for the encouragement and help. For my hther, who is far away
from me now, I always say thank you. Thank you aIso for my best fhend, Ancha, who
liked to accompany me in the field especially in lcllling the worms, also to Bang Nas
and &ly for some stays in Bogor.
Hopefully, this hard work can be useful.
Bogor, Desember 2004
TABLE OF CONTENTS
Foreword
Table of Contents
List of Tables List of Figures
List of Appendixs
1. INTRODUCTION
1 . I. Background
1.2. Objectives
1.3. Benefits
1.4. Hypothesis
11. LITERATURE REVIEW 2.1. Teak
2.2. Site Condition
2.3. Carbon Sequestration
2.4. The Process-based Forest Model
111. RESEARCH METHODOLOGY
3.1 . Model Construction 3.2. Field Experiment 3.3. Model Calibration
IV. RESULTS AND DISCUSSION
4.1. Results
4.1.1. Field Experiment 4.1.2. Model Calibration 4.2. l3scussion
4.2.1. Field Experiment 4.2.2. Model Calibration
4.3. Model Profile
4.3.1 . Simulating The Effects of Irrigation
4.3.2. SimulahgneEffectsofDifferent ClhteConditions
V.
CONCLUSION AND RECOMMENDATION 5.1. Conclusions5.2. R~cornmendations
Page
iv vi vii . . . Vlll
X
REFERENCES
LIST OF TABLES
Table
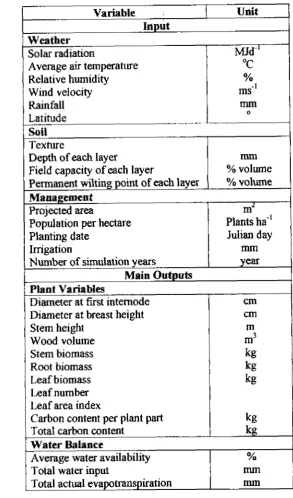
1 Model inputs and main outputs as well as the measurement units used
2 Thermal unit for Ieaf emergence and drop in pre and dry period
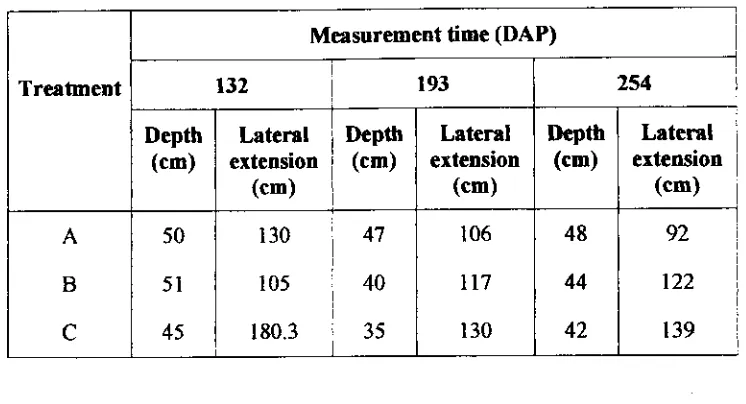
3 The stem height and diameter at 0,42 and 88 WAP in each treatment 4 Total leaf number and LA1 of seedlings and 42 WAP for each treatment
5 . The length of the roots for each treatment in 4,6, and 8 MAP
6 . The wood density of each treatment from 0 to 10 MAP
7. Climate variables (Year 2002) at Lampung,, Jakarta , Malang & Situbondo
Page
32
40
43 44 46 49
72
LIST OF FIGURES
Figure
1 The sub-model of growth
2 The submodel of water baIance
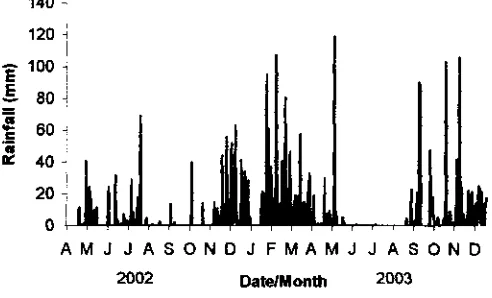
3 The daily rainfall pattern in the research period
4 The fluctuation of average, maximurn and minimum air temperature
5. The fluctuation of relative humidity and solar radiation
6.
The
growth dynamics of each treatment: (A) total biomass, (B) leaf biomass, ( C ) stem biomass,(D)
root biomass7. The growth dynamics of each treatment: (A) stem diameter at 5 cm
from soil surface and (B) stem height
8 (A) The volume diameter height, (B) form factor
9 Stem shrinkage during dry season
10 The dynarmcs of standing leaf area index for each treatment
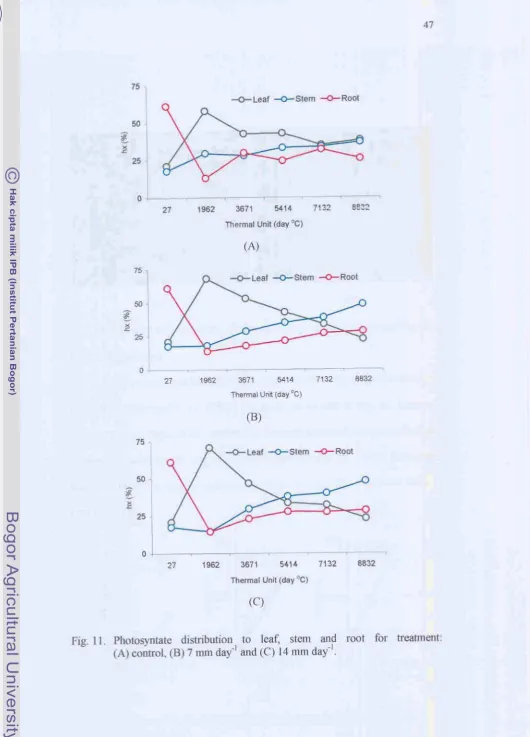
1 1 Photosyntate distribution to leaf, stem and root for treament:
(A) control,
(B)
7 mm daym' and (C) 14 mm day-'1 2 Different teak leaf size: transition h m seedling (A) to sapling (B)
13. Light use efficiency of treatment: (A) control,
(B)
7 mm daym' and( C ) 14 rnm daym1
14 The c x b n content for treatment: (A) control, (B) 7
mm
day-', and (C) 14 mm clay-'15. The simulated and measured dynamics of leaf emergence for treatment: (A) control, (B) 7 mm day-', and (C) 14 rnrn daym'
16. The sirnutate. and measured dynamics of stem diameter for treatment:
(A) control,
(B)
7 mm day", and (C) 14 mm dayL117 The simulated and measured dynamics of stem height for treatment: (A) control,
(B)
7 mm day-', and (C) 14 mm day-18 The simulated and measured dynamics of stem volume for treatment: (A) control, (B) 7 mm day-', and (C) 14 rnmdaym'
Page
25
27
37
38
19 The simulated and measured dynamics of leaf, stem and root biomass for
treatment: (A) control, (B) 7 mm day-', and (C) 14 mm day-' 55
20 The simulated and measured dynamics of C 0 2 content for treatment A (control),
(B) 7 mm day-', and (C) 14 mmday-' 56
2 1 The simulated and measured leaf number for treatment (A) control,
(B) 7 mm day-', and ( C ) 14 mmday-l 57 22. The simulated and measured leaf area index for treatment: (A) control,
(B) 7 m day-', and
(C)
14 mm day" 5823 The simulated and measured soil moisture content for treatment: (A) control,
(B)
7 mrn day", and ( C ) I4 mm day-' 5924 The simulation results of the effects of irrigation to DBH and stem height
of teak planted at 1"' January and I
"
July in Situbondo 73LIST OF APPENDICES
Appendix
1 The model program in MS Visual Basic 6.0
2 List of symbols used in the program (in alphabetical order)
3 Model parameters
4 Daily weather input data of Jakarta (Year 2002)
5 Daily weather input data of Situbondo (Year 2002)
6 D d y weather input data of MaIang ( Y m 2002)
7 Daily weather input data of Lampung (Year 2002)
8 The soil physical and chemical properties
9 The analysis
of
variancePage
84
%
98
99
107
115
123
I. INTRODUCTION
I. I. Background
Teak (Teciona grandis L.f.) has been grown in Indonesia since the
begnning of 1 4 ~ century. Teak fqrests in Indonesia are found mainly on the
island of Java, which cover an area of about 1 million ha (Indonaia Forest
State Enterprise, 1992). Outside Java, the natural area of teak is Muna
Island, Southeast Sulawesi (Simon, 1997). In some recent years, teak has
been planted in some other islands of Lndonesia from Sumam to Papua
mainly by private sectors and farmers. Some of these plantations are in areas
that would have been considered marginal for teak growing two decades
ago.
This phenomenon was encouraged by reIatively new perception of
teak planting as a commercially profitable venture, as well as by policy and
legal changes. The rotation cycle of new highintensity teak plantations is
generally between 20 and 25 years which is three to four times shorter than for older low-intensity plantations (Nair & Souvannavong, 2000).
Nowadays, the government does not control its harvesting and utilization for
teak grown on private land.
The high interest of planting East growing teak will support
which was estimated from land use change data and atmospheric data, in the
range of 1 . 1 to 2. f Pg C Deforestation and subsequently tillage
practices resulted in an increase in bulk density, a decrease in organic matter and total nitrogen, and a decrease in sutubfe ions comparing to the undisturbed forest soil (Hajabbasi, Jddian, & Karirnzadeh, 1997).
The advantages of teak for planting programs are:
The high economic value of teak which can motivate people to grow
it. Niskmlnen ( 1 998) showed
tbat for reforestation, land expectation
value (LEV) of teak bath financially and economically is better than
that of eucalyptus (Eucalyptus grandis) or according to the research by Nieuwenhuyse ei a/. (2000) dso of melina (Gmelina arborea
Roxb).
Teak
can improve the soil characteristics. Mapa (1995) showed thatreforestation using teak can increase infillration and soil water
retention therefore reducing run-o ff and erosion. Balagopalan and Jose (1 997) found that soils under teak were less deteriorated than under eucalyptus.
Teak is potential as a carbon sink. As a fast growing clone, b a d on the calculation by Wahid er a!. (19991, carbon sequestration potential
for reforestation without rotation and wood plantation is always
hlgfier than that of the slow one. As teakwood is more durable than
other timbers (Vallil, 1
W ) ,
the carbon storage in the plant's productcould be increased by extending the live duration of products and by
reducing wood waste during processing (Adi el al., 1999).
Poverty can be r e d u d because the poor families who live around
the teak plantations can grow their crops in an intercropping system with teak (Saleh, Fattah & PoedjoraharJo, 1997).
Furthermore, planting and nursing some agricultural crops with the
trees can be conducted by women so this system can empower
women with some additional resources. Generally, women are also
engaged in marketing small hausehaId teak products such as some souvenirs fiom teak as we can see in Cepu, Central Java.
hformation on growth response of thls lund of teak to climate is
very Iimited. Although teak management has been established through
experiences of nearly two centuries, but those experiences are derived h m
a limited area, especidly Java which has been known as a suitable Iand for
many agricultural systems. The models or allometric equations which have
been built possibly cadd not be applied to other regions due to its empirical
characteristics.
Process based modeIs with a high generality can be used to achieve
that purpose. The potential uses of forest growth models as management tools for plantation management might include : ( I ) the prediction of growth
and yleld fiorn established plantations; (2) selection of new plantation sites
or of species for particular sites; (3) identification of site Iimitations to
locations or forest management options; (5) questions fbr which 'real-time'
e x m e n t s are not feasible, e.g., long term impact of practices on
sustainability or the effects of climate change on forest succession (Battagtia
& Sands, 1998).
1.2. Objectives
The objectives of this study are:
1. To undatand the processes
in
phenology, growth, and water balance ofteak and its interaction with environmental factors, as the basis for
desigmg quantitative relationships in modelling activity.
2. To calibrate a process-based model that can describe the relationship
between teak growth and soil water availability.
3. To predict the carbon sequestration of teak. 1.3, Benefits
The process-based mode1 built in this study could describe the dynamics of growth, development and carbon sequestration of teak at
different soil moisture contents. Therefore, it can be used as a basis for land
management, risk analysis and zoning of teak. The field experiment results
that were not covered in the m d e l can be considered in teak silviculture.
1.4. Hypothesis
1 . The change in developmental phases of teak can be determined using the
thermal unit concept.
3. The model can describe the effects of soil moisture content on teak
growth, development, and carbon sequestration.
The hypothesis can be explained as follows:
1 . The assessment of the effects of water availability on teak
deveIopmentd rate (phenology) needs to be determined if the model
only needs to estimate the time between the developmental phases based
on air temperature (thermal unit concept) or should also consider the
water availability factor.
2. This hypothesis is to p m f if the miations in water availability affect
teak growth and carbon sequestration. l h s is important as a consideration in determining some model parameters as a result of the
change in water availability.
3. This hypothesis is needed to be assessed before it is validated or applied in the field. This hypothesis can be assessed by comparing the model
11. LITERATURE REVIEW
2.1. Teak
Teak has a centuries-old reputation as the king of brnbers. The genus name "Tectona" is derived born the Greek word ''tektw" whch means "carpenter". It
implies that teakwod has long been considered as the carpenter's pride.
Teak is put into a wide variety of uses. Its timber is ided for small span
permanent engineering structures like trusses and purlins. It is a very popular timber for furniture, panelling and veneering. It is used in the construction of sea
going vessel, railway carriages, musical instrument, plywoods, fine fire w d s , or
making models and figures for cast metal work. Carved and polished teak stumps
and roots are good decorative pieces.
Tribals use teak leaves as a thatching material. It is a popular wrapping
material among provisional shop owners and fish vendors (ValIil, 1997). In Java,
teak leaves are used as a wmpping material for "tempe" or rice or use it for colouring fd such as for "gudeg", a special food b m Yogyakarta. Some dyestuff is extracted
corn
teak leaves, which can be used for colouring silk, wooland cotton. Extracts fiom teak flowers or wood can be used as a medicine such as
for treating leuderma, dysentery or promoting hair growth.
It is highly durable, easily worked, attractive, relatively strong and light. However, fiorn strength point of view, teak may not score high when compared to
some species like Shorea mbusta, Messua ferrea or VI tex alfissima (Vallil, 1 997).
In addition to endemic countries, e-g. India,
Myanmar,
-land and Laos(Bhat, 20001, teak has been introduced in foreshy contexts in almost all tropical
Bangladesh, Nepal even Australia, East and West African regon such as
Tanzania, Ghana or Nigeria, and Central and South American region such as
Cuba, Costa Rica and El-Salvador. According to Bhat and Ma as published in the newsletter of ITTO Tropical Forest Update 14/1 (2004), the
teak
plantation inindonesia is the second largest teak pIantation area in the world (3 1 %) after India
(43%).
Teak in Java might have been introduced &om India by Indian merchants
(Sdeh et al., 1997). However, since its occurrence was not limited to Java and
Madura, where Hindus settled, there is no proof to strengthen the theory f Simon,
1997).
In Java, natural teak forest covers extensive low land regions from the
eastern parts of West Java, through most of the provinces of Central Java,
Yogyakarta, and East Java, including the surrounding small islands like
Karimunjawa, Bawean, and Kangean (Simon, 1 997). With the drastic decline in
the area of teak forests, at present Myanmar is the only counby that still relies on natural forests for most of its teak wood production (Nair & Souvannavong.
2000). The last natural forest of teak in Java was cut in the 1970s (Simon, 1997).
Based on ownership, objectives of management, intensity of management
and technology adopted, teak production systems can be broadly grouped into
three categories: natural forests; block pIantations; and farm forestry, including
home gardens (Nair & Souvannavong, 2000). Management of natural forests
traditionally involved removal of trees above specified exploitable diameter,
during successive felling cycles (Gyi & Tint, 1998 in Nair & Souvannavong.
2000).
The high prices of teak while the natural teakwood is available only in
limited amounts on the international market have prompted the establishment of teak plantations across the tropics. The first systematic effort to establish teak
plantations was made more than 150 years ago in India and Myanmar (FAO, 1993
in Nair & Souvannavong, 2000). In Indonesia, teak plantation forest has been
established since 1895 using the taungya method. Existing teak plantation forests
are about 868 000 ha, of which 626 000 ha are produrrtive (Indonesia Forest State
Enterprise, 1992).
Changes in land and tree tenure and improved access to markets in some
countries have encoumged cultivation of teak by farmers as an integral part of
their fanning system, in small woodlots, in home gardens or in mixtures with
other trees and agricultural crops (cf. Subrammian er al., 1999 in Nair &
Souvannavong, 2000). Farmers decide to cultivate teak because of comrnerciai considerations (Nair & Souvannavong, 2000; Rder, Keoboualap ha & Manivanh,
1995), the desire to enhance overall profitability from the land (Nair &
Souvannavong, 2000) and the securing of land tenure (Roder et al., 1995).
Insufficient h c i a l resources, non-availability of land, lack of seedlings, Iack of
labor and Iack of experience were regarded as the main reasons for not planting
teak (Roder el al., 1995).
Lack of seedlings can be induced by low seed production and percentage
20 to 80 percent (Bank, 1992). Some efforts have been done to accelerate the
germination of teak fruit. The best treatment is by soakmg the fruits for 48 hours in running water before sowing. Fruits stored for one year before sowing
frequently germinate more rapidly than fresh fruit (Bank, 1992). Using seeds
from selected plus trees planted directly at the spacing of 3 x 3 m in plots of I0 x
10 m, Lndonesia Forest State Enterprise (1 992) found that the percentage of germination ranges fiom 60% to 90%, the growth of seedlugs is relatively faster
than the ones originated from seeds of non-plus trees.
Tissue culture technique was developed to solve the problem of teak
seediing availability. Tissue culture multiplication involves use of somatic tissues,
so that the progeny is identical with the parent. The number of plants obtained
from a single termindaxilary bud is very high and the plant multipIication can be
carried out all around the year. It is possible to prduce 500 plants fiom a single bud of a mature tree (I00 years old) or 3000 plants from a seedling in a year
(Kumaravelu, 1 992).
The tentative indication is that the performance of teak tissue culture
plants is better than of the others tiom stump or polypot origms with the same
morphological and histological characters, also susceptible to defoliator and
skeietonizer (Subramanian ef al., 1997). The tissue culture derived plants show better growth than plants
from
seed (Kurnaravelu, 1992). Indonesia Forest StateEnterprise (1992) found that the height of the plant from tissue culture reached up
to 1 5 m within two years. Subramanian e t a!. (1 997) found that the tissue culture
plants are flowering and ii-uiting earlier than the others from stump or polypot
The plus trees mdtiplicated by tissue culture technique supported by
changing demand and utilization technologies have resulted in a gradual reduction
in teak rotations &om around 100 to 80 years. 60 to 40 years, then currentIy
around 25 to 20 years. The price of teak and the possibility for faster return are the main reasons for some private sectors to be involved in teak management. It is supported also by policy and legal changes (Nair & Souvannavong, 2000) such as
investment- fiendly environment or no control regulation in harvesting and
utilizing teak.
There are some indications that the wood quality kom the short rotation
plantations is Iower as compared to the one b m the natural forest. It has a high proportion o f sapwood and juvenile wood, lower density and strength, a larger microfibril angle that I d s to grater shrinkage, less durable heartwood with the
wood figure including colour, grain and texture are supposedly inferior. It made
the price fbr teak from short rotation plantations lower as compared to its natural
forestcounterpa& i. e. the US$300 per m3 on average to US$700 per m3 ( Akwasi
& Oteng-Amoako published at ITTO Tropical Forest Update 1 4 1 2004).
Some other wood quality variables such as specific gravity and mechanical propaties are not different between the two different sources of wood. Bhat
(2000) found that trees selected for faster growth in forest plantations of different
ages (2 1, 55 and 65 years) mostly display non-significant difirences in wood
specific gravity and mechanical propemes, includmg fibre stress at elastic limit,
Young's modulus, modulus of rupture and maximum crushing stress (parallel to
Some variations are also found in wood quality of teakwod from short
rotation plantation due to different environment and plantation management.
Therefore, genetic selection and manipulation as well as prudent silvicuItural
practices or wood technologies can increase the wood quality of teak from short rotation management.
Data available on the effects of spacing/ thinning regmes on wood quality
are insufficient for designing an efficient management strategy but pruning was
found to be usell for achieving the desired grade and for recovery of sawn wood
with fewer defects (Bhat, 2000). In India, Bhat (2000) found that krtilizer
(mixture of nitrogen, phosphorous and potassium) treatment of 5-year-old trees
prompted a greater than twofold increase
in
ring width and a 15% increase in wood specific gravity, while vessel diameter and fibre wall thickness did not showsignificant changes. Irrigation increased the values for bending and compression
strength but the quality of water should be considered.
%hat (2000) found new evidence, which suggests that differences between juvenile and mature wood are not sufficient to affect meeting end-user's requirements. Mechanical maturity of teakwood occurs at 20 years old and further
improvement of strength properties with age is practicaIly negligible. With a
higher penebabiIity, sapwood is easier to treat with environment-friendly
preservatives. The differences in wood colours are due to geographic locations but
not lo different age. However, fast grown juvenile w m d is thus likely to be finer
2.2. Site Condition
The site mn&tions a f k t teak growth, development and wood quality. 1 t is
indigenous to South East Asia but has been spread out to many regions in the
world. In China, teak stands are found in 26'35' north latitude and 12 1'40' east
longtude (Research Institute of Tropical Forestry, Chese Academy of Forestry,
1 992).
NaturalIy, teak was found in monsoon regions with a distinct wet and dry
season. Many species of the monsoon regon are deciduous, therefore teak is
classified as a deciduous tree. Leaves fall on summer and will emerge again as the
humidity increases (Banik, 1992).
Fire is very common in monsoon forests during the dry season. Teak is one
of the rare species in monsoon regions, which is able to withstand the fire hazards. Teak seed (fruit) has a thick and hard coat, which is not broken during fites.
Germination
of
teak seeds is actually aided by the fire. In Java, the flowering period of teak is from December to February in the western part of the island and one month later in the eastern part (Simon, 1 997).Teak grows better in Indonesia in the range of r;imfaI1 between 1250 mln
to 3759 mm per year. If the rainfall is less than 1250 mm per year, teak grows
very slowly with the low stem quality because of too many branches with the irregular shape of branch (Simon, 1997). In the dry regions, root competition
restricts the growth before crown competition takes place (Banik, 1992). In the
wet regions or the regons with the higher r d l l , teak grows faster but with low
wood quality because of the thicker sapwood and the iight thinner heartwood
quality producing cylindrical and sound logs occurs in the Bago Yomas where the
annual rainfall is 1 500 to 1 950 mrn (Kyaw, 2003).
The difference between wet and dry season is important for teak growth
(Research Institute of Tropical Forestry, Chinese Academy of Foresby, 1992 and
Indonesia State Forest Enterprise, 1 992), natural regeneration (Kumaravelu,
19921, and wood quality (Indonesia State Forest Enterprise, 1992). Tomazello &
da SiIva Cardoso (1999) found that the activity of teak cambium, xylem and
phloem followed the rainfall pattern, active in wet season and declined again in
dry season. It determines growth ring characteristics. However, if a long dry speI I
follows germination of the fruits, germinated seedlings dry up kern moisture
stress (Kurnaravel y I 992).
Teak has a shallow root system, needs full d i g h t , and is very sensitive to
root as well as crown competition. The optimum yearly temperature is in the
range of 22 to 27OC (Simon, 1997), In China, 98 % of teak plantations are in the
area with the absolute minimum temperature between 0 O C to 5 OC (Research
Institute of Tropical Forestry, Chinese Academy of Forestry, 1992). Pumijumnong
(1999) shows that in Thailand, there is no correlation between the monthly air
temperature and teak growth.
Teak is indigenous to low land area but in India, teak is still planted in an
altitude of I200 m a.s.1. (KumaraveIu, 1992). In Indonesia, there is almost no teak
in the attitude more than 700 m a.s.1. (Simon, 1997 j.
Teak grows well in the humid loamy and well-drained soil (Banik, 1992 j and thrives best on soils with pH values ranging fiom 6.0 to 7.0 (Kyaw, 2003).
1997). Statistical analysis shows that beside precipitation, N nusition and rooting depth are the most important variables influencing teak growth in West Africa (Drechsel & Z s h , 1994).
2.3. Carbon Sequestration
The rapid industrialization over the last century has improved the living
standards of millions of people. However, it also brought some problems such as
global warming, a change in global climate because of an increase in the
concentration of green house gases, i. e. a h o n dioxide
(CO*),
methane (CHd), andnitrous oxide
(N20
and NO) in the atmosphere resultmg in an increasem
the airtemperature.
The
impacts of the climate change to the developing countries such asIndonesia are greater than to the developed countries (Murdiyarso, 2003). One of
the likely consequences of globd warming is a melting of polar ice caps and a rise
in sea level. Perhaps some small islands of Indonesia will disappear. Indonesia
Country Study on Climate Change (1998) using a certain simulation model found
that climate change affects rice production, vegetation type of forest, ratio of
water demand and supply and coastal resources.
Among those greenhouse gases, COz conlributes more than 50% of the
global wwarming. The main cause of m c r ~ s e d COz level is the anthropogenic disturbance especially the burning of fossil fuel and land use change especially
global precipitation of 7 to 16% (Indonesia Country Study on Climate Change,
1998).
Some efforts have ken made to reduce its concentration such as a legally binding international convention UNFCCC (the United Nations Framework
Canvention on Climate C h g e ) . UNFCCC is one of the results of the United
Nations Conference on Environment and Development (UNCED) in Rio de
Janeiro, Brazil, on June 1992. In 1997, the Kyoto Protomi negotiated at the
Conference of the Parhes to the UNFCCC resulted in legally binding emission
targets for a number of industriahzed countries and countries in tramition (the 'Annex B notions'). The international flexibility mechanisms h a t can be used by the Annex B countries to meet carbon reduction obligation include Lntemtiod Emissions Trading (IET), Joint Impiementation (JI), The Clan Development
Mechsrn (CDM) and Joint Fulfilment.
Among the four mechanisms, the most relevant mechanism to developing
countries is
CDM.
This mechanism allows Annex B nations to implement projectsin developing countries and additional carbon emission saving resulted from the
project will be credited to Annex
B
nations (Wahid et al., 1 999).Trees and forest can play an important role
in
carbon sequestration althoughnot as much
as
of the oceans and may be vulnerable to release the C back to theatmosphere,. The C stocks in
dl
the forests, trees and soils of the w d d amount to5.5 Tt (tera ton, 1 Tt = 1 0'' t = 1 0Igg) with soils store much more than vegetation. J l e C-stcck in the oceans is 39 ouf of the 48 Tt of
C
and fossil C is 6 Tt (HairiahTypes of activities in foreshy sector that can reshun the rate of increase in
atmospheric C a are (Sathaye & ~~~~~ath, 1 997 in Wahd el al., 1999):
Management for C conservation, i.e. activities controlling deforestation.
protecting forests in reserve, changing harvesting regrmes and conwolling
other anthropogenic disturbances such as B e .
Management for storage, t.e. activities expanding forest ecosystems by
increasing the area, andlor biomass and soil carbon density, of natural and
plantation forests a d increasing storage in durable wood products.
Management for C substitution, i.e. activities inu-easing the transfer of
forest biomass C into products rather than using fossil-fuel-based energy
and products, cement-based products, and other non-wood buiidmg
materials.
In Indonesia, based on Forest Inventory
Data,
the m a technically avadable for the plantabon program (afforestation and reforestation without and with rotation) amounted to about 27 million hectares consisting of unprductive land at about 7.8 million ha, grassland at about 9 million ha and critical land at about 10.2 million ha (Walud et al., 1999).Paul el al. (2002) found that there is generally an initial decrease in sod C
after afforestation before gradually increasing so that, after 30 years, C within the surface 30 cm of soil is often greater than that in the previous agricultural soil.
Some factors influences the extent of change in soil C are previous land use, climate
and
forest type. They found also most C accumulated under soil of short-rotation deciduous hardwoods or Nz-fixing species established on abandoned crop
of Iong-rotation softwoods established on abandonned pastoral land in temperate
regions.
2.4.The Process-based Forest Model
A model is simplicity of a system (Handoko, 19941, as description of a real thing or as a system of postulate, data, and deduction, which is presented by some
of mathematical descriptions of entities or state of affairs (Hanks & ktchte,
1991). The modelling of plant growth is a quantitative scheme to predict growth, development and plant yield, giving a set of genetic coefficients and relevant
environmental variables (Monteith, 19%). PIant growth modelling is also a dynamic simulation of plant growth with the numerical integration of processes,
which are involved in using the computer (Sinclair & Seiligman, 1996). The model of plant growth and yield consists of single equation or a set of submodel
(Peng, 2000).
Although the plant growth and development is very complex, Bwte,
Jones, & Pickering (1 996) stated three reasons why plant modelling should be
developed. Plant modelling can be used as a m h tool, for decision support
systems, and policy analysis. In forestry, growth and yield models have a long
hrstory. Forest management decisions are made based on information about both
current and future conditions.
The
modelling of growth and yield in forestry can be on the level of standor individual tree. The model for the stand level can be classified for even-aged
and uneven-aged stand structures. An even-aged stand is a group of trees composed of a single age class, and thus originated within a short period of time.
at breast height (DBH) is less than the variation in the uneven-aged forest. A stand
consisting of trees of many ages is said to be uneven-aged.
Individual Qee models simulate each individual tree as a basic unit with
respect to establishment, growth and mortality, and sum of the resulting individual
tree estimates to produce a stand level value. Individual tree models can be further
classified into distance independent, where tree spatial locations are not required
and dependent models where inter-tree spatial locations are required (Peng, 2000).
Individual tree models can be empirical or mechanistic. Empirical models
are formed by some field data
and
describes the growth rate as a regressionfunction of some variables such as land index, age, tree density, and basal area. The process-based models (mechanistic models) are developed
after
someknowledge has been accumulated using some of empirical models and describes the primary ecosystem processes or simulates the dependence of growth to some
processes such as photosynthesis, respiration, decomposition, and nutrient cycling
f Peng, 2000).
The question of forest management in relation to sustamability,
biodiversity, and climate change, has increased the potential use of mechanistic
process models. The main contributions of this kind of model include the use of
eco-physiological principles in deriving model development and specification and
long-term forecasting capability within changmg environments (Peng, 2000).
Some
of
process-based models, which were created for forestry and havebeen assessed in some environmental conditions, are 3-PG, FORMIX and FORSANA. The other models are
MAESTRO,
BIOMASS and ECOPHYS whichmodels. To understand the process-based model of forest, the overview of 3-PG
and FORMIX by some authors is described below.
Almeida, Landsberg, & Sands (2004) tried to establish a set of p a m e t e r
values of 3-PG (the acronym stands for physioIogical principles predictrng
growth) model that would allow
them
to describe accurate1y the growth patternsof fast growing Eucalyptus gmndis in terms of the output variables produced by
the model, i.e. stem
mass,
root mass, foliagemass,
leaf area index, stem votume,mean annual increment, mean diameter at breast height (DBH) and basal area.
The sensitivity analysis was carried out for parameters h t characterize the
differences between clones. Esprey, Sands & Smith (2004) anafysed the
sensitivity of the model to the same plant for parameters considered to be the most
important for explaining allornebic relationship and biomass partitioning, canopy
structure, branch and bark fractions, litterfall, canopy conductance and the effects
of temperature, soil water and site nutrition on canopy quantum efficiency, and to
variations in the site and climatic factors needed to run 3-PG.
According to an overview by Almeida er al. (20041, this model has been
applied and used successfidly for different purposes and various forest types
occurring in different regions with a range of climates. Coops, Waring &
Landsberg (1 998) for example, have demonstrated the application of 3-PG to
f arge areas using spatial data bases.
The 3-PG model uses a simple radiation absorption model to calculate the
photosynthetically active radiation intercepted by a stand (APAR). APAR is
converted to gross primary production using the canopy quantum efficiency,
temperature, days of frost, the availability of soil water and site nuttlent status.
The model created by Landsberg & Waring (1997) uses a monthly time-step.
Biomass partitioning in 3-PG assumes that the proportion of net primary
production a1Iocate.d to roots is influenced by soil nutrition
and
available soilwater. The input of the model are total monthly rainfall, monthly daily mean values of temperature, solar radiation, monthly daylight vapour pressure deficit
(VPD), site latitude, maximum and minimum available soil water content, and soil
fertility rating (Almeida et al., 2004).
Glauner, Ditzer & Huth (2003) used thc process-based model FORMIX
applied in combination with a geopphic information system (GIs) to predict the
forest growth and yield of lowland dipterowp stands in Sabah, Malaysia,
considering different low-impact harvestrng scenarios. Growth dynamics are
simulated
on
the basis of ecophysiological p m s s e s (photosynthesis andrespiration rates, competition for light and space, regeneration and mortality) and
by considering different site qualities c h a r a c t d by topography (slopes), forest
strata (distribution of "big trees"), exchangeabIe soil nutrients, and plant-available
water capacity index. Based on the review by Glauner er al. (2003), the model
FORMIX is capable of simulating forest development with and without timber
b e s t i n g with varying input parameters. The input could be a minimum cutting diameter, the number of trees to be harvested per unit area, or a minimum number
of seed trees to be retained after harvesting, depending on the objectives of the
simulation. Ths model is created by Bossel and Krieger (1991, 1994) based on
eartier work of Ktra (1978) and Okawa (1 985). The work was continued by Huth
er a!. (2000) with the model FORMIX 3-Q. K6hler et a/. (2001 ) created the successor of FORMIX3 named FORMIND which was developed for the
simulation of tropical rain forest in Malaysia.
Grote & Erhard (1999)
used
the output of a physiologcaily based modelFORSANA, which simulates daily physiological variables to describe annual tree
growth and tree mortality of three Scots pine (Pi= sylvesfris
L.
) stands in easternGermany whch are exposed to different levels of nitrogen deposition and SO2 air pollution. The model outputs were compared with tree ring analysis
and
forestinventory data. They concluded W the approach is a possible method for
regional assessment of forest development under environmental change.
Although the potential use of process-based model in forest management
has been recogused since some years ago, just some of the rndels have been actually used. It is very different h m tree crop plantation management where
process-based and semi-empirical models are used as a decision support tool. The
primary cause of thls is the higher complexity of forestry model and the difficulty
III. RESEARCH METHODOLOGY
The research consisted of a modelling project to construct and calibrate the
model and a field experiment to obtain model parameters.
3.1. Mode1 Construction
The model consists of three sub-models: development, growth, and water
balance.
The Deveiopmnt Sub Model
Plant development is described by the occurance of new leaves based on
thermal unit concept while the development stage determines the partition of
biomass to leaf, stem and root. The teak's growth is initiated with the bud
development, which is followed by expansion of the leaf lamina and renewal of
the shmt (Tomaze110 & da Silva Cardoso, 1999). Thermal unit for leaf emergence
is derived h m field experiment.
The Growth Sub Mudel
Plant growth is derived from biomass produdon using the approach of
light use efficiency, respiration
aud
soil water availability. Dry matter productionis proportional to the amount of short wave radiation intercepted by plant canopy
(Monteith, 1977; Gallagher & Biscoe, 1978 in Horie et a!., 1W5). That relationship applies to tree crops (Linder, 1985; Wangy et a/. , 1991 ; Beadle &
Turnbull, 1992 in Sands, 19%). Therefore, the potential prduction of biomass
(Bb) is cdcdated using:
B b = E Qint (1)
where E is light use efficiency (LUE, kg
MP')
and Qid is intercepted radiationa convenient basis for empirical production functions in simple model of tree
growth (Linder et a/. , 1985; Byrne et al., 1986; McMurtie, 1991 in Sands, 1996).
It is customarily defined as increase E in dry matter production per each unit
increase in intercepted radiation (Sands, 1996). In this study, E is derived from
field experiment.
The intercepted radiation by the canopy is calculated using Beer's Law (Rosenberg, 1974):
Qint = (I
-
e-k QS (2)where k is an extinction coefficient (unitless), LA1 is leaf area index (unitless), the
area of leaf material per unit of ground surface covered and
Q,
is short wave irradiance above the canopy(MJ
mm2}.The extinction coefficient is assumed to be constant. Its value and the
initial value of LAI are derived 6om field experiment. The increment of LAI
(dLAI) is calculated as a function of daily leaf growth rate (d
WL,
kg ha'' d-' ) andspecific leaf area (sA, ha kg'):
dLAI = SA dWL (3
1
Specific leaf area is assumed to be constant and the value is derived from field
experiment.
The actual production of biomass
(B,)
is calculated as a function of wateravailability factor (Fw) and potential production of biomass:
B, = Fw Bb (4)
In this model, we assume that water availability is the only factor limiting the
production of biomass. Water factor is a hnction of relative transpiration (Ta/Tm,
where Ta is actual transpiration (mm d-I) and Trn is maximum transpiration
(rnm d-I). Ta and Tm are calculated in the water balance sub mdel, which is
presented in Fig. 2.
The actual biomass production is partitioned into leaf, stem, and root. A
part of the biomass is lost due to maintenance respiration
(h,
kg haL' d-I)therefore the increment of biomass of organ x (dWx, kg ha-' d" ) takes the form:
d W x = q x B g R , ( 6 )
R, depends upon organ weight
(Wx,
kg ha-' d-') and temperature (T, "C) (Handoko, 1992) as:where 7, is proportion of biomass allocated to organ x, k, is maintenance
respiration coefficient, and Qlo is the temperature quotient. The value of q, is
derived from field experiment and the d u e
of
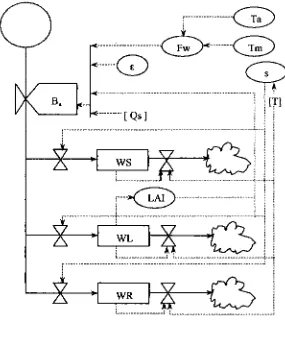
km fiom the iteration of the model.The Forester diagram of the growth sub-model is presented in Fig. I .
As the developmental phase is determined by the occurrence of new leaves with the associated shoot, the partition of biomass into stem and leaf is calcuIated
per internode:
where y ~ i ) is the partition coefficient of biomass to leaf of i n t e d e i, qqi j the
partition coefficient of biomass to stem of internode i, and dilti is the partition
I
i j j ... .i i ---., :Remarks : B,=actual biomass, &=light use efficiency, Fw-water availability factor, Ta=actual transpiration, Tm=rnaximum transpiration, Qs=solar radiation,
s=developmental stage, T=temperature, WS=stem biomass, WL=leaf biomass,
WR=root biomass, LAI=leaf area index.
Symbol .
0
=source& =sink- =madenergy flow---* =information flowX
W
=raten
=state v e r i a b l e o =auxiliary variable [image:38.612.199.484.135.478.2][
)
= exogenous variableFig. 1 . The sub-model of growth.
The leaf and stem weight of internode i are calculated as:
where Wuil is leaf weight of internode i (kg), WWi, is stem weight of internode i
TWL and TWs are calculated as:
TWi, = ZWui) (13)
TWs =
CWS
(i, ( 1 4 )The stem volume of internode i (Vqo, m3) is calculated using:
Vqi) = W q i W (15)
Vs = T W W (16)
where Vs is stem volume and WD is wood density of teak which its value is derived fkom field experiment and is assumed to be constant in all stem part.
Stem height
(H,
m) is calculated as:where Qi, is the height of internode i. Hi is calculated as a funtion of thermal unit.
The stem diameter of internode (cm,
D!;,)
is calculated using the volume equationof a cylinder:
where x: = 3.14.
Carbon contained in biomass stock, which has been converted to carbon
dioxide (CO2) is earnated by the equation recommended by the International Panel on Climate Change (IPCC):
CO2 (biomass stock j = (Ba Cf) 12/44 (19)
c
f : Carbon fraction of biomass12/44 : conversion factor C to COz
In the model, the COz sequestered by plant is calculated per each plant
The Wakr Balance Sub MdeZ
The water balance submodel is to derive a water availability factor which
is calculated kom computed soil moisture. Soil moisture is affected by inputs
(rainfall and irrigation) and water losses comprising canopy interception, run-off,
drainage, evaporation and transpiration. The Forester diagram of the water
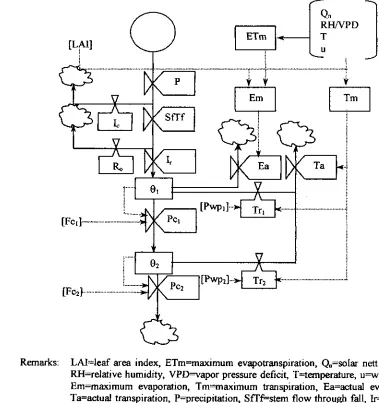
Balance sub-model is presented in Fig. 2.
Remarks: LM=leaf area index, ETm-maximum evapotranspiration, Q.=soIar nett radiation, RH=relative humidity, VPD-vapor pressure deficit, T=temperature, u=wind speed, Em=maxirnum evaporation, Tm=rnaximum transpiration, Ea=&ual evaporation,
Ta=actual transpiration, P=precipitation, Sff+stem flow through fall, Ir=irrigation 01,2=soil water content in layer 1 and 2, Pc1,2= percolation from Iayer 1 and 2,
Fc1,2=field capacity of layer 1 and 2, Pwpl,2=pmanent wilting point of layer 1
and 2, Tr 1,2=root water uptake from layer I and 2, Ic=canopy interception, Ro=run
[image:40.612.101.480.267.670.2]off.
The tree crown intercepts a part of the rainfall and all o f this interception (I,) will be evaporated. The values of I, were determined by Zinke ( 1 967) as a
function of leaf area index (LAI) and rainfall (P) as described by the equation:
1, = (l.2/3)*LAI O<LAI < 3
Ic = 1.2 LAI 1 3
I c = P P < It
The rest of the rainfail will reach the soil surface as stem flow and through
fall (Sftf). When evaporation = 0, if soil water content (0(1,) is more than field
capacity (Fa,,) or if Sftf is more than extractable water (EW), i.e. available water
between wilting point of first layer (Bwp(l]) and field capacity, run-off (&) will
take place and is calculated as:
Ro
= 75%*
YosIope*
(Sflf - EW)SRf
> EW, or:Ro
= 75%*
slope*
Sttfe,,,
'
Fell (21)The rest o f Sfif and irri-on (I,) is absorkd as infilmtion (I,), where:
I, = Sftf
+
I, - Ro (22)In this study, we assumed that soil is divided into two layers. Percolation
(PC) will take place from each soil layer when soil water content of the layer m
(8,) is higher than the field tapcity (FL) and is calculated as:
p,,, = (em - Fcm) e m > F h
P=(,,
= 0 0,s Fc,The soil water percolation h m the lowest layer is lost as drainage. The
other losses of water are from evapotranspiration. The maximum
evapotranspiration
(ETm)
was assumed to be 80% of the potentialevapotranspiration (ETp), which is calculated using the equation b r n Penman
( 1 948):
where- A is the gradient of saturation vapour pressure against air temperature (Pa
K-' ), Q , is net radiation (MJ m-'1, y is psychrometric constant (66.1 Pa K-I), f(u) is aerodynamic function
(MJ
m-' pa-'), (e,- e,)
is vapour pressure deficit (Pa),and h is specific heat of vaporisation (2.454
MJ kg").
The values of A and f(u) are calculated using the equation from Meyer el al. (1987 in hpron & Handoko, 1993):
where u is wind velocity (km h-' ).
Qm is caIculated as:
where CL is albedo and Qt is long wave radiation (MJ m-').
Saturated vapour pressure (%) is calculated by the equation from Tatens
(1930 in Javanovic, Annandde & Mhlauli, 1999) as:
e, = 0.6 11 exp117.27 T/(T+237.3)]
and actual vapour pressure (%) is calculated by:
e, = %
*
RW100 130)The maximurn soil evaporation and the maximum transpiration are
approximated from maximum evapotnmspiration assuming that proportion of
radiation intercepted by crop canopy equals TmlETm (Stapper, 1984;
The actuaI evaporation (Ea) is calcuIated using the two-stage soil
evaporation of Ritclue (1972). The first stage occurs as maximum soil evaporation
(Em) until a characteristic cumulative evaporation (U) is reached (Eq. 28). During the second stage, evapomtion decreases exponentially with time (Eq. 29):
lSlstep: Ea=Em CEa I
U,
e,%.~
8-1 (33)2"d step: ~a = a :t CEa >
U
0,*.5 0,i (34): EaO 0,a.5
where t 2 is time during stage-2 drylng (days), OV1 is wilting point of surface layer
and
a
is a constant. Measurements of a consistently result in values of about 3.5mrn d-In(Ritchle & Johnson, 1990 in Lascano, 1991).
To calculate the actual transpiration, it is assumed that roots will absorb
the water firstly from the most upper layer, then the next layer until Ta = Tm or
until the root depth limit has been reached (Handoko, 1992). Soil water limits
water uptake if soil water content in layer m (0,) falls below 40% of extractable water (Turner, 1991 in Handoko, 1992). The root water uptake in layer m is
expressed by:
Tr, is the root water uptake in layer m (mm), 8, is soil water content in layer m
(m), ewp, is permanent wilting point of Iayer m (mm) and BFc, is field
capacity of layer m (rnm).
The program of the model is written