GENETIC STUDY OF STAGNANT FLOODING TOLERANCE
IN RICE
TRIAS SITARESMI
GRADUATE SCHOOL
BOGOR AGRICULTURAL UNIVERSITY BOGOR
DECLARATION OF THE THESIS, SOURCE OF
INFORMATIONS, AND COPY RIGHT*
Here, I declare that this thesis entitled Genetic Study of Stagnant Flooding Tolerance in Rice in my manuscript under supervision of supervisor committee and never been proposed to other university elsewhere. Any source of information’s from other authors in the published and non-published articles are cited in the texts and reference in the end of this thesis.
Therefore, I give the copy right of this manuscript to the Bogor Agricultural University.
Bogor, November 2016
RINGKASAN
TRIAS SITARESMI. Studi Genetik Toleransi Genangan pada Padi. Dibimbing oleh HAJRIAL ASWIDINNOOR, SINTHO WAHYUNING ARDIE, dan WILLY BAYUARDI SUWARNO.
Kendala utama budidaya padi di daerah banjir adalah sedikitnya varietas toleran yang adaptif di lingkungan tersebut. Padi tidak dapat tumbuh normal karena adanya cekaman kelebihan air. Tesis ini mempelajari dasar genetik toleransi genangan sebagai kontribusi untuk perakitan varietas padi rawa.
Tujuan pertama studi ini adalah mengidentifikasi karakter-karakter morfologi dan agronomi yang penting terkait dengan cekaman genangan. Perlakuan air adalah genangan bertahap dan kontrol. Perlakuan genangan dimulai sejak 30 hari setelah tanam dengan ketinggian air 20 cm, kemudian ditingkatkan 5 cm setiap minggu sampai mencapai 50-60 cm. Ketinggian air dipertahankan 50-60 cm sampai masak fisiologis. Model linier meliputi bobot 1000 butir, panjang malai, diameter batang, intensitas warna hijau daun, dan panjang batang dapat menjelaskan keragaman sebesar 92.30 % dari indeks toleransi stress. Panjang batang, intensitas warna hijau daun, dan panjang malai mempunyai variabilitas genetik luas dan hertitabilitas tinggi di bawah kondisi cekaman sehingga karakter-karakter tersebut mudah diseleksi. Jumlah anakan produktif berkorelasi nyata dengan hasil gabah pada kondisi cekaman dan memiliki heritabilitas tinggi. Karakter-karakter tersebut mudah diamati dan tidak memerlukan sampel destruktif. Intensitas warna hijau daun, panjang malai, diameter batang, dan jumlah anakan produktif dapat direkomendasikan sebagai karakter sekunder dalam kriteria seleksi untuk genotipe yang memiliki level toleransi medium. Berdasarkan indeks toleransi stress, IR 64, Ciherang, dan INPARI 30 berpenampilan baik pada kondisi genangan air 50 - 60 cm, sebaliknya IR 42 tidak dapat tumbuh baik pada kondisi tersebut. Level toleransi genotipe-genotipe yang diuji masih perlu dikonfirmasi selama beberapa musim percobaan.
diperlukan kombinasi pemuliaan “shuttle” pada kondisi cekaman dan kondisi optimal.
Tujuan ketiga dari studi ini adalah mengidentifikasi marka 384 marka SNP terkait dengan karakter morfologi dan agronomi yang berhubungan dengan toleransi cekaman genangan. Data fenotipe yang digunakan adalah tinggi tanaman dan jumlah anakan yang berasal dari populasi bi-parental P1 (IR 42), P2 (IRRI 119), and F2. IR 42 sebagai tetua peka dan IRRI 119 sebagai tetua toleran (donor). Genotyping dilakukan dengan menggunakan Golden Gate Illumina assay. Analisis pemetaan hubungan antara marka SNP dan data fenotipik dilakukan dengan perangkat lunak Tassel 5 menggunakan General Linear Model. Marka yang berpengaruh nyata terhadap tinggi tanaman (p<0.05) adalah TBGI275345, TBGI275367, dan TBGI424383. Marka yang berpengaruh nyata terhadap jumlah anakan adalah TBGI000722, TBGI258600, TBGI270843, TBGI271066, TBGI271076, TBGI272122, TBGI272241, and TBGI327790. Dua di antara marka tersebut di atas, yaitu TBGI424383 dan TBGI271066 diduga berasosisasi dengan gene yang mengendalikan akitivitas protein kinase, dimana protein ini berperan dalam stress signaling.
SUMMARY
TRIAS SITARESMI. Genetic Study of Stagnant Flooding Tolerance in Rice. Supervised by HAJRIAL ASWIDINNOOR, SINTHO WAHYUNING ARDIE, and WILLY BAYUARDI SUWARNO.
The major constrain of cultivating rice in flood-prone ecosystem is lacking of appropriate varieties. In the flood-prone ecosystem, common modern rice varieties are unlikely grow normally, due to the water depth. To contribute the breeding tolerance stagnant flooding in rice, here we studied the genetic basis of stagnant flooding tolerance in rice.
The first objective in this study was aimed to identify major morphological and agronomical traits associated with stagnant flooding tolerance. The water regime were normal condition (shallow flooding of 5 cm) and gradual flooding which was started at 30 days after transplanting (DAT) with 20 cm water depth then gradually increased weekly by 5 cm up to 50-60 cm. When 50-60 cm had been reached, it was maintained until the maturity. A linear model involving weight of 1000 grains, panicle length, stem diameter, intensity of leaf green colour, and stem length could explain 92.30 % of the variance of stress tolerance index (STI). Stem length, intensity of leaf green color, and panicle length had broad genetic variability and high heritability, therefore it would be relative easily to select the characters under flooding stress. Number of productive tillers was correlated with grain yield under stagnant flooding stress and highly heritable. The characters were easy to observed and non-destructive in measurement. The characters would be candidate as secondary character for stagnant flooding selection. These characters may be relevant when studying intermediate genotypes with tolerance. However, their relevance as selectable traits still needs to be assessed. We identified IR 64, Ciherang, and INPARI 30 had good performance while IR 42 did not under 50 – 60 cm of water depth. However, the levels of tolerance of the genotypes are still needed to be confirmed by further experiments across several seasons.
© Copy Right of IPB, 2016
The Copy Right is protected by law
It is prohibited to recite apart or whole of this manuscript without mentioning or refers to its source. The citations only for the purposes of education, research, scientific publication, report, critic, and opinion; and these citations will not detriment to Bogor Agricultural University (IPB)
GENETIC STUDY OF STAGNANT FLOODING TOLERANCE
IN RICE
TRIAS SITARESMI
Thesis
As a requisite to obtain the degree of Master of Science
in
Study Program of Plant Breeding and Biotechnology
GRADUATE SCHOOL
BOGOR AGRICULTURAL UNIVERSITY BOGOR
PREFACE
Grateful to Allah Subhanahuwata'ala for His blessing in accomplished of this manuscript. The research topic chosen is promising subject for genetic and breeding studies. As flooding stress is major constrain in swampy area, the genetic study of tolerance to stagnant flooding is important. The study was done since April 2015 to June 2016.
This work could not be accomplished without support from supervisors, research team, colleagues, friends, and family members. The author would like to gratitude to:
1. Dr. Hajrial Aswidinnoor, Dr. Willy Bayuardi Suwarno, and Dr. Sintho Wahyuning Ardie for time, support, and excellent supervision each have provided throughout my study.
2. Southeast Asian Regional Center for Graduate Study and Research in Agriculture (SEARCA) Scholarship for financial support provided over my candidature, Indonesian Center for Rice Research (ICRR) for providing field and laboratory facilities, and Indonesian Centre for Agricultural Biotechnology and Genetic Resources Research and Development (ICABIOGRAD) for providing molecular laboratory facility.
3. Dr. Indrastuti Apri Rumanti, Dr. Dwinita Wikan Utami, and Dr. Untung Susanto who provided field research support, laboratory facilities, suggestion, and advices.
4. Senior scientist, Dr. Aan Andang Daradjat, for sharing knowledge and ideas, guidance, suggestion, supporting to pursue my career in rice breeding at ICRR. 5. Dr. Moh. Ismail Wahab as Director and Dr. I Made Jana Mejaya as former
Director of Indonesian Center for Rice Research for endorsement of scholarship through SEARCA Scholarship.
6. Colleagues at ICRR: Dr. Yudhistira Nugraha, Rina Hapsari Wening, Suhartini, Ahmad Hidayatullah (Ayat), Dr. Buang Abdullah, Wage Ratna R, Mr. Sudibyo TWU, Mr. Uan DS, Mr. Meru, Ahmad Hidayat, M. Ramdhan K., and Desi Prastika. Thank you for always give your hand.
7. Team of Molecular Biology Laboratory at ICABIOGRAD: Siti Nuraini (Neng) and Mrs. Siti Yuriyah for helping in molecular work.
8. Friends of Plant Breeding and Biotechnology Study Program of 2014, especially Dhieni Hayati for helping in collecting data in the field.
9. My parents and my sisters for supporting, motivation, encouragement, and sacrificing many things during my study.
Hopefully this work would be benefit for breeding science.
LIST OF CONTENTS
LIST OF TABLES xiii
LIST OF FIGURES xiv
LIST OF APPENDICES xv
1 INTRODUCTION 1
1.1 Background 1
1.2 Objectives 2
1.3 Research Scope 3
2 REVIEW OF LITERATURE 4
2.1 Flood-prone Environment 4
2.2 Genetic of Stagnant Flooding Tolerance 5
2.3 Physiological Mechanism of Stagnant Flooding Tolerance 6
2.4 Characteristic of IRRI 119 and IR 42 6
2.5 Selection Criterion 7
3 AGRO-MORPHOLOGICAL TRAITS ASSOCIATED WITH
STAGNANT FLOODING TOLERANCE IN RICE
9
Abstract 9
3.1 Introduction 9
3.2 Materials and Methods 10
3.3 Result and Discussion 12
3.4 Conclusion and suggestion 24
4 INHERITANCE STUDY OF AGRONOMICAL TRAITS OF RICE UNDER STAGNANT FLOODING AND NORMAL CONDITION
25
Abstract 25
4.1 Introduction 25
4.2 Materials and Methods 26
4.3 Result and Discussion 28
4.4 Conclusion 42
5 MARKER-TRAITS ASSOCIATION OF AGRONOMICAL TRAITS RELATED TO STAGNANT FLOODING TOLERANCE IN RICE
43
Abstract 43
5.1 Introduction 43
5.2 Materials and Methods 44
5.3 Result and Discussion 47
5.4 Conclusion 50
6 GENERAL DISCUSSION 51
7 GENERAL CONCLUSSION 55
REFERENCES 56
APPENDICES 63
LIST OF TABLES
3.1 Mean square of combined analysis of variance of plant height, yield and its components of rice
12 3.2 Plant height and number of productive tillers of rice under normal
and stagnant flooding (SF) condition
13 3.3 Grain yield components of rice under normal and stagnant flooding
(SF) condition 3.6 Stem length and stem diameter of rice under normal and stagnant
flooding (SF) condition
16 3.7 Length and width of leaf blade of rice under normal and stagnant
flooding (SF) condition
16 3.8 Panicle exertion and length of panicle of rice under normal and
stagnant flooding (SF) condition
17 3.9 Stagnant flooding response index of rice genotypes 18 3.10 Correlation coefficient among stress index of rice 18 3.11 Standardized stress tolerance index of rice 19 3.12 Descriptive statistic and correlation of STI 20 3.13 Analysis of variance of linear regression of rice 20 3.14 Parameter estimates of linear regression of rice 20 3.15 Analysis of variance of multiple linear regression of rice 21 3.16 Parameter estimates of multiple linear regression of rice 21 3.17 Correlation among traits of rice genotypes under stagnant flooding
stress
22 3.18 Genetic and phenotypic variability of rice traits under stagnant
flooding stress in dry season of 2015
24 4.1 Mean and standard error of rice population P1, P2, F1, F2, BCP1,
and BCP2 of IR 42 x IRRI 119 crossing under stagnant flooding
4.3 Goodness of fit testing (χ2) genetic model with six parameter from IR 42 x IRRI 119 rice crossing under stagnant flooding stress
32 4.4 Estimate value and standard error of joint scaling test with six
parameter model from IR 42 x IRRI 119 rice crossing under stagnant flooding stress
33
4.5 Mean and standard error of rice population P1, P2, F1, F2, BCP1, and BCP2 of IR 42 x IRRI 119 crossing under normal condition
35 4.6 Estimate value and standard error of scaling test with three
parameter model from IR 42 x IRRI 119 rice crossing under normal condition
36
4.7 Goodness of fit testing (χ2) of genetic model with six parameter from IR 42 x IRRI 119 rice crossing under normal condition
4.8 Estimate value and standard error of joint scaling test with six parameter model from IR 42 x IRRI 119 rice crossing under normal condition
37
4.9 Mean and stress tolerance index (STI) of P1, P2, F1, F2, BCP1, and BCP2 of rice generation 5.1 T test of minimum and maximum value of grouping genotypes on
plant height and number of tillers
47 5.2 SNP marker significantly associated with plant height, number of
tiller, weight of 100 grain, panicle length, and grain yield of rice genotypes under stagnant flooding stress
49
LIST OF FIGURES
1.1 Flowchart of the research activities 3
2.1 The difference of flash-flood and stagnant flooding stress (Hattori et al., 2011)
5 4.1 Distribution number of plant P1, P2, F1, F2, BCP1, and BCP2 of
grain yield and its component in rice population of IR 42 x IRRI 119 crossing under stagnant flooding condition
30
4.2 Distribution of filled grain number in F2 rice population from IR 42 x IRRI 119 crossing under stagnant flooding condition
34 4.3 Distribution of unfilled grains number in F2 rice population from
IR 42 x IRRI 119 crossing under stagnant flooding condition
35 4.4 Distribution number of plant P1, P2, F1, F2, BCP1, and BCP2 of
grain yield and its component in rice population of IR 42 x IRRI 119 crossing under normal condition
36
4.5 Distribution of filled grains number in F2 rice population from IR 42 x IRRI 119 crossing under normal condition
38 4.6 Distribution of unfilled grains number in F2 population from IR 42
x IRRI 119 crossing under normal condition
38 5.1 Distribution of plant height (left) and number of tiller (right) of rice
group genotypes
47 5.2 Quartile-quartile plot (QQ plot) determines marker-traits
association compare to the expected result of rice genotypes
LIST OF APPENDICES
1 Performance of rice genotype under stagnant flooding condition in Experimental Station of ICRR in dry season of 2015
63 2 Performance of rice genotype under stagnant flooding condition in
Experimental Station of ICRR in wet season of 2015
1
INTRODUCTION
1.1 Background
Agricultural expansion to flood-prone area is potential for increasing national rice production. Rice (Oryza sativa L.) is cultivated in these main ecosystems namely irrigated, rain-fed low land, upland and flood-prone areas (Halwart and Gupta 2004). Flood-prone area is defined as area that is always saturated or waterlogged for a long period of the year. This condition is caused by its position in between land and coastal area, therefore is saturated or having shallow ground water. Grounds are flooded to the least of 50 cm in depth or more over period of time, weeks to months or so. In total, Indonesian flood-prone area covers around 33.41 billion hectares, consists of swampy (13.28 billion hectares), and tidal swamp (20.13 billion hectares) (Subagyo 2006).
Swampy area is surrounded by big waterways and the branches on the left and right side. On the flat landscape, waterlogging occurs in wet season and drought or remains stagnant in dry season. In South Sumatera, the swampy area can be found along the Musi river (Muba and Palembang Districts), Komering and Ogan rivers (OKI, OKU, and Muara Enim Districts) (Djafar 1992). According to the characters of ground level variation, depth and flooding duration, swampy area can be distinguished into three groups (Alihamsyah 2005; Noor 2007). They are Lebak pematang, medium swamp, and deep swamp areas. The first has fairly high topography, that is 50 cm of water depth in wet season and the flooding duration is less than 3 months. Medium swamp has lower topography, which is 50 – 100 cm of depth and duration of flooding about 3 – 6 months. The latter, has lowest topography, which is the flooding depth of more than 100 cm and continuing flooding of more than 6 months to year-long.
The major constrain of cultivating rice in flood-prone ecosystem is lacking of appropriate varieties. In the flood-prone ecosystem, common modern rice varieties are unlikely grow normally, due to the water depth. Submerged rice is characterized as grown in flooded condition with more than 50 cm of water depth for one month or longer (Catling et al. 1988; Catling 1992). Yield is lose ranges from 10 to 100% under flooding stress. It is depend on flood duration, depth, and floodwater conditions (Ismail et al, 2012). So far, genotype that have been identified as stagnant flooding tolerant with high yielding is still limited (Vergara et al. 2014). Elongation of stem ability trait and its relationship to the phenotypes is complex. The earlier studies were varied considerably, depending on the parental lines used. Hamamura and Kupkanchanakul (1979) reported that partially dominant genes with additive effects control internodes elongation in submerged rice. Thakur and Hillerislambers (1988) reported that internodes elongation ability is controlled by two dominant complementary genes, one for plant height and the other for elongation.
2
Some constraints prevent the rice breeding progress of stagnant flooding stress. Those are limited information on survival mechanisms, particularly of their physiological mechanisms, biochemical interactions and inheritance, also the lack of effective screening techniques. Information regarding genetic parameters and their heritability under stagnant flooding (SF) is still limited (Nugraha et al. 2013). International Rice Research Institute (IRRI) began to develop unfavourable area tolerant rice, such as stagnant flooding of 25 to 50 cm water depth above the ground over the whole lifetime. No varieties were officially released that tolerant to stagnant flooding until today. Furthermore, development of rice varieties tolerant to both of submergence and stagnant flooding is principal in IRRI. Some of IRRI lines that have submergence and stagnant flooding tolerance have been tested in Asia and Africa over 2011 to 2012 (Mackill et al. 2010).
Studies on mechanism and genetic basis for stagnant-flooding stress tolerant trait have not been studied thoroughly. Information about genetic control, inheritance, and heritability, and so forth, associated to stagnant flooding tolerance is important. Therefore, further study is required to determine the appropriate selection method in rice breeding for stagnant flooding tolerance.
Most of rice is grown in the medium swampy area. Stagnant flooding stress with 50 – 100 cm of water depth mostly occur in this area. Therefore this study focus on stagnant flooding stress in medium swampy area.
1.2 Objectives
The main aims of the study were to:
1. Identify major morphological traits associated with stagnant flooding tolerance 2. Identify the inheritance of stagnant flooding tolerance in rice
1.3 Research Scope
The research consisted of three activities; those were (1) morphological study for selectable characters that have high correlation with stagnant flooding mechanism, (2) inheritance study of stagnant flooding tolerance and (3) selection of segregated population using characters correlated to stagnant flooding tolerance through molecular marker. In general, all activities were illustrated below (Figure 1.1)
Figure 1.1 Flowchart of the research activities
Activity
Choice of parents
(IRRI and ICRR collection)
Agronomical and morphological study of
genotypes tolerant to stagnant flooding
Development of Single Crosses (1 Crosses; 2 Parents)
Planting of single crosses in F1 Nursery
F2 seeds
Backcrossing
Inheritance study of stagnant flooding
tolerance (P1, P2, F1, F1R, F2, BCP1,
and BCP2)
2 REVIEW OF LITERATURE
2.1 Flood-prone environment
Rice (Oryza sativa L.) is a semiaquatic plant whose growth, at both the seedling and adult stages, is well investigated. It is cultivated in five ecosystems where the source of water supply and the degree of flooding are the major environmental determinants. The rice types corresponding to these ecosystems distinguished itself from most modern rice varieties by its ability to survive in more than 50 cm of water depth for at least 1 month (Catling, 1992). Among deep-water rice types, the so-called floating at rates 20 to 25 cm/d when partially submerged and can reach a length up to 7 m in water depth (Vergara et al. 1976; Catling 1992).
Mackill et al. (1996) classified five major rainfed ecosystem of rice based on two major hydrology systems, inadequate and excess of water, namely (1) fed shallow, favourable environment, (2) fed shallow, drought prone, (3) rain-fed shallow, drought and submergence, and (4) rain-rain-fed medium deep, waterlogged rice land. Rice field that falls under the third term is facing problems on rice productions due to flash flooding or submergence during vegetative growth stage. Short-term complete submergence may frequently occur when there is a high tide and heavy rain during rainy season, especially where is located near of coastal and riverbank. The rice field that falls under fourth term experiences the accumulation of water with the depth of 25-50 cm for its substantial period growth season, is called stagnant flooding. This condition frequently occurs in some basin areas, where no drainage system or continuing of heavy rain during rainy season. In Indonesia, stagnant flooding areas mostly are found in the basin swampy area or lebak.
Flooding is a major stress constrain for rice production, especially in rain-fed lowland. The flooding of the major river basins and deltas of Asia has provided the sustenance for the rice growth that has been a prominent feature of the region for millennia. However, this flooding is also a cause of yield fluctuations because of erratic rainfall patterns and poor drainage of many rice fields. This results in excess water in these fields for varying depths and durations (Ismail et al. 2010). Flooding can be classified into four types depending on the plant traits and varietal types that are adapted to the conditions:
a) Flooding during germination (anaerobic germination; AG): a problem when direct seeding is practiced and heavy rains result in submergence before germination
b) Flash flood (submergence): plants are completely submerged for up to 2 weeks. Varieties tolerant to submergence is required for this condition c) Stagnant flooding (medium deep or semi-deep): flooding occurs for a longer
duration, more than 2 weeks and often several months, at depths up to 50 cm. Varieties tolerant to stagnant flooding conditions are required.
Figure 2.1 Difference of flash-flood and stagnant flooding stress in rice (Hattori et al. 2011)
Recently, research on flood-tolerant rice plants revealed that some rice
varieties have evolved to overcome two different flood types, ‘flash flood’ and
‘deep-water flood’ by using two mechanisms. During ‘flash-flooding’ the tolerant
plants that are fully submerged for a few weeks stop elongating and thus avoid energy consumption that will be needed to restart growth when the water recedes. On the contrary, during deep-water flooding, with water depth up to several meters for several months, the deep-water-flood tolerant rice plants promote elongation of internodes to keep the foliage above the water surface and thus allow respiration and photosynthesis (Hattori et al. 2011). Stagnant flooding is flooding stress during which water does not recede and remains in the field at depths of 50 to 60 cm for up to several months (Mallik et al. 1995). Stagnant flooding may occur after a flash flooding event, or alone.
2.2 Genetic of Stagnant Flooding Tolerance
The genetic basis for submergence-promoted internodal elongation of deep-water rice has received less attention relatively. It appears that this trait is controlled by a number of minor and perhaps as few as two major genes (Catling 1992). Suge (1987) proposed that elongation during submergence is based on the capacity of an internode to elongate, as well as the degree of elongation, and identified one gene with incomplete dominance that determined elongation ability.
6
times, with the development of QTL analysis, the deep-water response has been suggested to be a quantitative trait regulated by QTLs (Nandi et al. 1997; Sripongpangkul et al. 2000; Toohinja et al. 2003; Nemoto et al. 2004; Hattori et al. 2007, 2008; Kawano et al. 2008).
In deep-water areas, the water depth increases gradually throughout the year and maintains up to more than 50 cm of deep of water for long period. In these situations, rapid elongation ability is necessary to allow the plants to keep up with
rising floodwater. Deepwater or “floating” rice varieties initiate internode
elongation early in their growth period and their internodes undergo rapid elongation. The early initiation of elongation is controlled by QTLs on chromosomes 3 and 12 (Nemoto et al. 2004, Hattori et al. 2007, Kawano et al. 2008), and the rate of internode elongation is controlled by QTLs on chromosomes 1 and 12 (Hattori et al. 2007; Hattori et al. 2008; Kawano et al. 2008).
The chromosome 12 QTL is the major determinant of the rapid elongation response of deep-water varieties. Adaptation to long-term deep flooding is primarily achieved by stem (i.e. internode) elongation, as mediated by two SNORKEL genes. SNORKEL1 (SK1) and SNORKEL2 (SK2) both are ethylene-responsive factor (ERF) transcriptional regulators that control internode elongation. The genes are very similar in sequence to the SUB1 genes. However, SUB1 has the opposite effect of the SNORKEL genes and inhibits elongation of leaves and internodes when induced during submergence (Hattori et al. 2009).
2.3 Physiological Mechanism of Stagnant Flooding Tolerance
Under stagnant flooding condition, most of plants produce low yield because of reduction of the sink capacity such as number of panicle, spikelet fertility, and grain size (Mallik et al. 2004). Effect of stagnant flooding (25-50 cm) were vegetative vigour mostly poor, increasing on plant height, delaying of day to heading, and severing from lodging (Amante 1986). However, there are little information about some other characters, especially for physiological characters such as soluble carbohydrate and starch content on stem and chlorophyll contents that related to mechanisms of adaptation of rice plants to stagnant water. Tolerance mechanisms are controlled by various characters, therefore it is necessary to identify the secondary characters that have strong correlation with grain yield. Many secondary characters are easier to measure than yield across representative stress environments, particularly if the character is expressed constitutively, or if it can be measured on seedlings, or if it can be identified using genetic markers (Nugraha et al. 2013).
2.4 Characteristic of IRRI 119 and IR 42
One variety developed previously at IRRI, IRRI 119 (released in the Philippines as PSB Rc68). IRRI 119 is derived of IR 43581-57-3-3-6/IR 26940-20-3-3-3-1// KHAO DAWK MALI 105. IRRI 119 was developed for the rainfed lowlands. It carries the SUB1 gene but is moderately tall.
plants cannot easily elongate out of the water due to the elongation-suppressive effect of SUB1 (Fukao et al. 2006, Xu et al. 2006, Fukao and Bailey-Serres 2008b). However, in cultivars that are taller (> 100 cm) a sufficient part of the canopy remains above the water level to allow the plants to grow well. Partial elongation ability is an important attribute of stagnant flooding tolerance so that rice plants can grow ahead of rising water. However, if elongation is too much, plants will be lodge after the water recedes, therefore this trait needs to be combined with lodging resistance.
IRRI119 was considered to be stagnant flooding tolerant in rice breeding program at IRRI (Collard et al. 2013, Kato et al. 2014, and Vergara et al. 2014). The plant height under stagnant flooding stress is 135-140 cm and with days to flowering is ± 94 days. IRRI119 is semidwarf types under well-drained conditions (Collard et al. 2013).
IRRI119 was developed using conventional breeding and was not specifically bred for stagnant flooding trait. Elucidating the genetic basis, that are heritability, genetic control, mapping QTL of stagnant flooding tolerance is major objective of the IRRI breeding and research programs. Classical QTL mapping efforts are currently underway (Collard et al. 2013).
A bulk-pedigree method was used to develop IRRI119. Submergence screening is done at F2 and F3 generations using bulk selection at F2 generation. At F3 generation, screening of submergence is repeated to ensure there are few escapes. At F4 to F6 generations, selection are done based on plant type, yield, grain quality, and insect and disease resistance. Screening of stagnant flooding stress was done at F7-F8 generations. IRRI119 was considered to be stagnant flooding tolerant in the rice breeding program at IRRI (Collard et al. 2013).
IR 42 is IRRI line which is derived from crossing of IR1561-228-1-2/IR1737//CR94-13. IR42 is susceptible for submergence stress (Das et al. 2009; Serres et al. 2010; Sarkar et al. 2011). IR42 is determined as stagnant flooding susceptible by Vergara et al. (2014) and Yullianida et al. (2015). Under stagnant flooding stress, the yield reduction of IR42 is 57 % , stem elongation is 36.7 cm, stem elongation rate is 1 cm day-1 and the number of tillering are 3 (Yullianida et al. 2015). Meanwhile the yield reduction higher 85 % based on Vergara et al. (2014).
2.5 Selection Criterion
Under stagnant flooding stress, yield is primary selection criterion based on visual selection. There are sufficient genetic variation for yield in IRRI material, although heritability of the trait is low to medium. For improving of phenotyping method, that is easy to measure physiological traits, it is need to look for traits which are highly correlated with yield or relatively yield under stagnant flooding stress. The traits are preferably non-destructive and pre-flowering phase. Collard et al. (2013) suggest that number of tillers, elongation ability at vegetative stage, leaf area development, and lodging resistance can be used to estimate tolerance. All traits, except lodging resistance can be measured at one month after transplanting.
8
3
AGRO-MORPHOLOGICAL TRAITS ASSOCIATED
WITH STAGNANT FLOODING TOLERANCE IN RICE
Abstract
Tolerance mechanisms of stagnant flooding stress are controlled by various traits. Determination of secondary traits as selection criteria will be useful for crop improvement for waterlogging stress. The aims of the research were to study variation of several agronomical and morphological traits and to determinate secondary traits related to stagnant flooding tolerance. The experiment was conducted at the Indonesian Center for Rice Research in dry season of 2015. Genetic materials used were 10 rice genotypes, arranged in a randomized complete block design with three replicates in each environment (normal condition and gradual flooding). The agronomic traits observed were plant height, intensity of leaf green color, productive tillers, number of filled grains per panicle, weight of 1000 grains, grain yield, stem length, stem diameter, length of leaf blade, width of leaf blade, and panicle exertion. Data were analyzed using combined analysis of variance across environments, correlations among traits, multiple linear regressions, and cluster analysis. The results showed that effects of water regime were significant on plant height, stem length, stem diameter, length of leaf blade, grain yield, and productive tillers. Additionally, genotypic effects were significant on all traits observed, and interaction of water regime and genotype were significant on plant height, width of leaf blade, and panicle exertion. A linear model involving weight of 1000 grain, panicle length, stem diameter, intensity of leaf green colour, and stem length could explain 92.3 % of the variance of stress tolerance index (STI). Stem length, intensity of leaf green color, and panicle length had broad genetic variability and highly heritability therefore that it would be relative easily to select the traits under flooding stress. Number of productive tillers was correlated with grain yield under SF and highly heritable, so it may also suggest as one of determining characters for stagnant flooding tolerance. Based on STIStd, Ciherang, and INPARI 30 had good performance under 50 – 60 cm of water depth while IR 42 did not. The levels of tolerance of the genotypes are still needed to be confirmed by further experiments across several seasons.
Key words: secondary traits, partial submerged, genetic variability
3.1 Introduction
Stagnant flooding (SF) is flooding stress which during this time water does not recede and remains in the field at the depths of 50 to 60 cm for several months (Mallik et al. 1995). Stagnant flooding may also occur after a flash flooding event. Medium or semi-deep stagnant flooding occurs for a longer duration, more than 2 weeks and often several months, at depths up to 50 cm.
10
IRRI. Some of IRRI lines that have submergence and stagnant flooding tolerance have been tested in Asia and Africa over 2011 to 2012 (Mackill et al. 2010).
Under stagnant flooding condition, most of plants produce low yield because of reduction of the sink capacity such as number of panicle, spikelet fertility, and grain size (Singh et al. 2011; Kato et al. 2014). Effects of stagnant flooding (25-50 cm of depth) were vegetative vigour are mostly poor, increasing on plant height, delaying of day to heading, and severe logging. Yield lost ranges from 10 to 100% under flooding stress, depending on flood duration, depth, and floodwater conditions (Ismail et al. 2012).
Under stagnant flooding stress, yield is primary criterion based on visual selection. Tolerance mechanisms are involve various traits, therefore it is necessary to identify the secondary traits that have strong correlation with yield. The traits are preferably non-destructive and of the pre-flowering stage. Singh et al. (2011) and Kato et al. (2014) suggested that reduction in tiller number directly affected rice yield under stagnant flooding. Faster shoot elongation contributed to establishing a larger aerial leaf area and higher light interception, biomass production, and plant survival under stagnant flooding. Collard et al. (2013) suggested that number of tillers, elongation ability at vegetative stage, leaf area development, and logging resistance can be used to estimate tolerance.
Many secondary traits are easier to measure across representative stress environments. The selection of secondary traits will be effective if it is expressed constitutively, or if it can be measured on seedlings or vegetative stage. Determination of secondary traits as selection criteria will be useful for crop improvement for waterlogging stress. The study was aimed to determine secondary traits correlated with stagnant flooding tolerance in rice.
3.2 Materials and Methods
3.2.1 Plant materials
Materials used are 10 rice genotypes that were identified as tolerant, susceptible, and unknown. The genotypes are INPARA 3, INPARA 7, IRRI 119, INPARA 4, INPARA 5, INPARI 30, IR 64, IR 42, Ciherang, and INPARI 29. IRRI 119 was considered to be stagnant flooding tolerant in rice breeding program at International Rice Research Institute (Miro et al. 2013; Collard et al. 2013; Nugraha et al. 2013; Kato et al. 2014; and Vergara et al. 2014). IR 42 is determined as stagnant flooding susceptible by Vergara et al. (2014) and Yullianida et al. (2015). Under stagnant flooding stress, the yield reduction of IR 42 is 57 to 85 % (Vergara et al. 2014; Yullianida, et al. 2015). INPARA 3, 4, 5, 7 are swampy rice, INPARI 29 and 30 are varieties with SUB1 gene, Ciherang and IR 64 are popular irrigated varieties.
3.2.2 Design of field trial
to 50-60 cm. When 50-60 cm had been reached, it was maintained throughout the maturity (Vergara et al. 2014). Seedlings (21-day-old) were transplanted using one plant per hole with 25 cm × 25 cm spacing. The experiment in each site was designed as randomized complete block design with three replications. Seedlings were transplanted in 3 m × 4 m plots.
The agronomical/morphological traits observed were plant height, intensity of leaf green colour, number of productive tiller, number of filled grain per panicle, weight of 1000 grain, grain yield, stem length, stem diameter, length of leaf blade, width of leaf blade, and panicle exertion.
3.2.3 Statistical analysis
The ability of genotypes to perform reasonably well in stagnant flooding stress is paramount for stability of grain yield. The relative yield performance of genotypes in stagnant flooding stressed and non-stressed environment can be used as an indicator to identify stagnant flooding tolerant genotypes. Several index have been suggested on the basis of mathematical relationship between yield under stagnant flooding stressed and non-stress environments.
Rosielle and Hamblin (1981) proposed stress tolerance (TOL) as the differences of yield under stress (S) and non-stress (NS) environment. TOL = (Yi)NS
– (Yi)S . Higher value of TOL indicate susceptibility of genotype. Hossain et al.
�� . Fernandez (1992) defined a stress tolerance index as STI = � �� � �
�� ; which can be used to identified genotypes that produce high yield under both stress and non-stress environment. High value of STI indicate higher tolerance of stress. Fischer and Maurer (1978) proposed a stress susceptibility index (SSI) that assesses the reduction of yield under unfavourable compared with favourable environment. SSI =
− (��)�
(��)��
� SI = − ��� . Lower SSI indicate more tolerant to stress. Singh et al. (2011) suggested a modified formula
for Schneider’s stress severity index (SSSI). SSSI = − � �
� �� − − � �� . SSSI estimate the relative tolerance of a genotype relative to the population mean in grain yield reduction response due to stress. The six methods was analysed using correlation analysis to identify the relationship between methods.
To draw conclusions based on the six indices, each method was standardize by standard deviation. In mathematics, the standardization formula is as follows (IndexStd)i = ((Index)i - (Overall mean)i/Std. Standardized STI is corrected (subtract) by susceptible index (standardized SSI, SSSI, and TOL), we called STI. The conclusion is based on the consistency of the corrected STI index in explaining the tolerant and susceptible genotypes.
12
determined by the ratio variance with their standard deviation. If �
�� > �
�� >
then genetic and phenotypic variability considered as broad. The estimation of heritability was the ratio of genetic variance with phenotypic variance (Fehr 1987).
Data were analysed using combined analysis of variance across environment, correlation analysis, multiple linear regressions, genetic variability, and heritability. Analysis of variance (ANOVA) for combined environment followed method described by Fehr (1987). All statistical procedure were analysed using Ms excel, and STAR software.
3.3 Result and Discussion
3.3.1 Genotype and Water Regime Interaction on Grain Yield and Yield Components
According to the combined analysis of variance, effect of water regime on grain yield and productive tillers were significantly difference. Meanwhile, the effect of genotype was also significantly different on grain yield, productive tillers, filled grains, and weight of 1000 grains. However, effect of water regime and genotype interaction was not significantly different on grain yield and yield components (Table 3.1). It means that all the tested genotype have similar response of reduction of grain yield and yield components.
Table 3.1 Mean square of combined analysis of variance of plant height, yield and its components of rice
Source of variance DF PH PT FG W1000 GY
Water regime (W) 1 2806.067** 336.067** 303.750 ns 0.053 ns 45.501** Replication/W 4 17.428 ns 5.333 ns 210.383 ns 0.847 ns 0.065 ns Genotype (G) 9 462.818** 33.622** 537.076* 28.156** 2.047** G x W 9 38.572** 11.104 ns 278.972 ns 5.510 ns 0.375 ns
Error 35 12.203 5.519 235.124 3.095 0.434
CV (%) 3.01 14.07 16.83 6.72 11.79
Abbreviation: PH, plant height; PT, number of tiller; FG, number of filled grain; W1000, weight of 1000 grain; GY, grain yield; DF, degree of freedom; *, ** represent significance at P < 0.05 and P < 0.01, respectively; ns, non-significant.
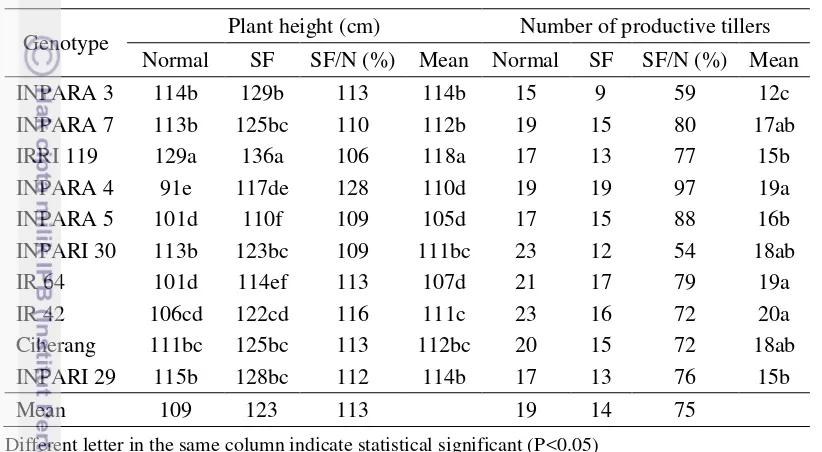
Stagnant flooding stress increased plant height, at the average of 13 %, and the genotype range of 6–28 %. INPARA 4 has highest percentage of increased plant height, although the height was not higher than of IRRI 119. In the normal and stagnant flooding stress, plant height of IRRI 119 was highest among others (Table 3.2). It can be information for breeders that IRRI 119 can be used as donor for developing new swampy varieties with low elongation rate.
(INPARA 4) did not perform well under stagnant flooding after submergence treatment (Singh et al. 2009; Singh et al. 2011).
In addition to the increasing of plant height, reduction in the number of tillers is a response to stagnant flooding stress (Collard et al. 2013). Stagnant flooding reduced number of productive tillers, with average of 25 % and genotype range of 3-46 % (Table 3.2).
Table 3.2 Plant height and number of productive tillers of rice under normal and stagnant flooding (SF) condition
Genotype Plant height (cm) Number of productive tillers Normal SF SF/N (%) Mean Normal SF SF/N (%) Mean
INPARA 3 114b 129b 113 114b 15 9 59 12c
INPARA 7 113b 125bc 110 112b 19 15 80 17ab
IRRI 119 129a 136a 106 118a 17 13 77 15b
INPARA 4 91e 117de 128 110d 19 19 97 19a
INPARA 5 101d 110f 109 105d 17 15 88 16b
INPARI 30 113b 123bc 109 111bc 23 12 54 18ab
IR 64 101d 114ef 113 107d 21 17 79 19a
IR 42 106cd 122cd 116 111c 23 16 72 20a
Ciherang 111bc 125bc 113 112bc 20 15 72 18ab INPARI 29 115b 128bc 112 114b 17 13 76 15b
Mean 109 123 113 19 14 75
Different letter in the same column indicate statistical significant (P<0.05)
14
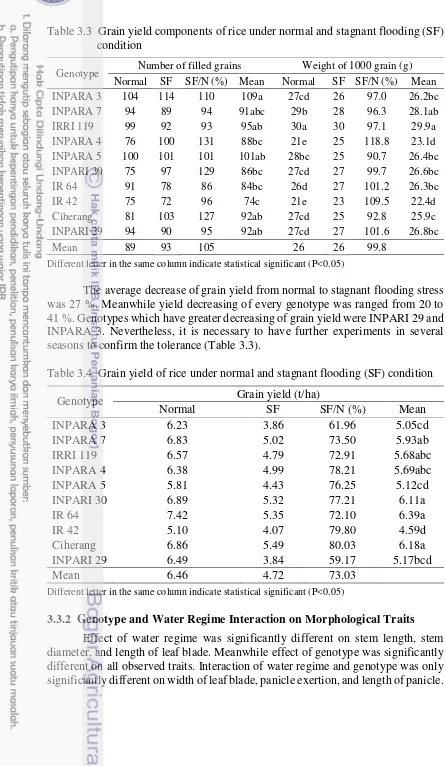
Table 3.3 Grain yield components of rice under normal and stagnant flooding (SF) condition
Genotype Number of filled grains Weight of 1000 grain (g) Normal SF SF/N (%) Mean Normal SF SF/N (%) Mean INPARA 3 104 114 110 109a 27cd 26 97.0 26.2bc INPARA 7 94 89 94 91abc 29b 28 96.3 28.1ab
IRRI 119 99 92 93 95ab 30a 30 97.1 29.9a
INPARA 4 76 100 131 88bc 21e 25 118.8 23.1d INPARA 5 100 101 101 101ab 28bc 25 90.7 26.4bc INPARI 30 75 97 129 86bc 27cd 27 99.7 26.6bc
IR 64 91 78 86 84bc 26d 27 101.2 26.3bc
IR 42 75 72 96 74c 21e 23 109.5 22.4d
Ciherang 81 103 127 92ab 27cd 25 92.8 25.9c INPARI 29 94 90 95 92ab 27cd 27 101.6 26.8bc
Mean 89 93 105 26 26 99.8
Different letter in the same column indicate statistical significant (P<0.05)
The average decrease of grain yield from normal to stagnant flooding stress was 27 %. Meanwhile yield decreasing of every genotype was ranged from 20 to 41 %. Genotypes which have greater decreasing of grain yield were INPARI 29 and INPARA 3. Nevertheless, it is necessary to have further experiments in several seasons to confirm the tolerance (Table 3.3).
Table 3.4 Grain yield of rice under normal and stagnant flooding (SF) condition
Genotype Grain yield (t/ha)
Normal SF SF/N (%) Mean
INPARA 3 6.23 3.86 61.96 5.05cd
INPARA 7 6.83 5.02 73.50 5.93ab
IRRI 119 6.57 4.79 72.91 5.68abc
INPARA 4 6.38 4.99 78.21 5.69abc
INPARA 5 5.81 4.43 76.25 5.12cd
INPARI 30 6.89 5.32 77.21 6.11a
IR 64 7.42 5.35 72.10 6.39a
IR 42 5.10 4.07 79.80 4.59d
Ciherang 6.86 5.49 80.03 6.18a
INPARI 29 6.49 3.84 59.17 5.17bcd
Mean 6.46 4.72 73.03
Different letter in the same column indicate statistical significant (P<0.05)
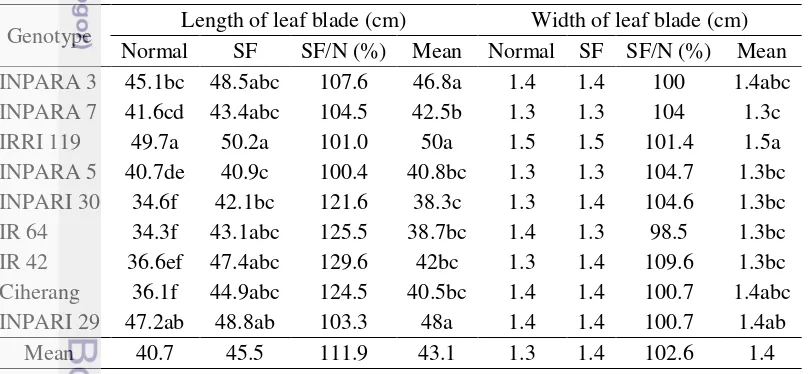
3.3.2 Genotype and Water Regime Interaction on Morphological Traits
It means that there is difference on ranking of genotype on width of leaf blade, panicle exertion, and length of panicle in SF and normal site (Table 3.5).
Table 3.5 Mean square of combined analysis of variance of morphological traits of rice
Source of variance DF SL SD LB WB PE PL
Water regime (W) 1 3039.466** 12.198** 313.344* 0.016 ns 12.595 ns 0.959 Replication/W 4 17.884 ns 0.261 ns 23.373 ns 0.018 ns 2.469* 1.716** Genotype (G) 8 170.372** 0.627** 105.714** 0.021* 13.762** 12.279** G x W 8 4.362 ns 0.175 ns 25.548 ns 0.003** 8.570** 1.226** Error 31 9.668 0.119 12.925 0.010 0.873 0.364**
CV (%) 3.48 5.97 8.35 7.55 27.94 2.37
Abbreviation: SL, stem length; SD, stem diameter; LB, length of leaf blade; WB, width of leaf blade; PE, panicle exertion; DF, degree of freedom. *, ** represent significance at P < 0.05 and P < 0.01, respectively
Stem elongation ability is one of plant adaptation mechanism to escape anaerobic respiration when submergence occurs. Genotype with stem elongation ability will be able to perform photosynthesis because the leaves are still positioned above the water. In the normal and stagnant flooding condition, stem length of IRRI 119 was the greatest, but increasing percentage of stem length was quite low (7 %). This suggested that tolerance is not only influenced by stem elongation, but also depend on plant stature at normal conditions. Varieties with stagnant flooding tolerance should have a relatively higher stature than lowland varieties. Mallik et al. (1995) observed that genotypes with moderate elongation had good survival and higher yield. Stagnation of water needs the enhancement of shoot elongation, which allows plants to extend their leaves out of the water for restoring contact with the atmosphere (Voesenek et al. 2004). This makes possible reason of plant which have submergence tolerance as well as moderate stem elongation become adapted under stagnant flooding (Nugraha et al. 2013).
16
Table 3.6 Stem length and stem diameter of rice under normal and stagnant flooding (SF) condition
Genotype Stem length (cm) Stem diameter (dm)
Normal SF SF/N (%) Mean Normal SF SF/N (%) Mean INPARA 3 85b 101b 119 93b 5.2bc 6.8a 129.9 6abc INPARA 7 81bc 95c 117 88c 5.1c 5.8b 114.3 5.5de IRRI 119 92a 107a 117 100a 5.9a 6.6a 111.7 6.3a INPARA 5 77cd 89d 116 83d 5.2bc 5.7b 110 5.5de INPARI 30 82bc 98bc 120 90bc 5.0c 6.3ab 125.5 5.7cde IR 64 74d 88d 119 81d 4.8c 5.8b 121.2 5.3e IR 42 82bc 96c 117 89c 5.8ab 6.5a 112.1 6.1ab Ciherang 81bc 99bc 122 90bc 5.4abc 6.3ab 117 5.8bcd INPARI 29 82bc 98bc 119 90bc 5.4abc 6.6a 122.6 6abc
Mean 82 97 118 5.3 6.3 118.1
Different letter in same column indicate statistical significant (P<0.05)
The average length of the leaf blade was increased by 11.9 %. Under normal conditions, IRRI 119 has the longest leaves and no significant increase under stress condition. The genotypes that have the shortest leaves under normal conditions were growing longer by 20 to 29 % under stress condition. Width of leaf blade has got narrower in all varieties under stagnant flooding stress (Table 3.7). The same result also reported by Anandan et al. (2015). This suggests that, rapid elongation clearly uses photosynthesis mechanism to increase blade length by restoring contact between the leaves and air (Mazaredo et al. 1982; Sakagami et al. 2009).
Table 3.7 Length and width of leaf blade of rice under normal and stagnant flooding (SF) condition
Genotype Length of leaf blade (cm) Width of leaf blade (cm) Normal SF SF/N (%) Mean Normal SF SF/N (%) Mean INPARA 3 45.1bc 48.5abc 107.6 46.8a 1.4 1.4 100 1.4abc INPARA 7 41.6cd 43.4abc 104.5 42.5b 1.3 1.3 104 1.3c IRRI 119 49.7a 50.2a 101.0 50a 1.5 1.5 101.4 1.5a INPARA 5 40.7de 40.9c 100.4 40.8bc 1.3 1.3 104.7 1.3bc INPARI 30 34.6f 42.1bc 121.6 38.3c 1.3 1.4 104.6 1.3bc IR 64 34.3f 43.1abc 125.5 38.7bc 1.4 1.3 98.5 1.3bc IR 42 36.6ef 47.4abc 129.6 42bc 1.3 1.4 109.6 1.3bc Ciherang 36.1f 44.9abc 124.5 40.5bc 1.4 1.4 100.7 1.4abc INPARI 29 47.2ab 48.8ab 103.3 48a 1.4 1.4 100.7 1.4ab
Mean 40.7 45.5 111.9 43.1 1.3 1.4 102.6 1.4
Different letter in same column indicate statistical significant (P<0.05)
many grain were unfilled, as showed by the number of filled grain per panicle of IR 42 was low (Table 3.3).
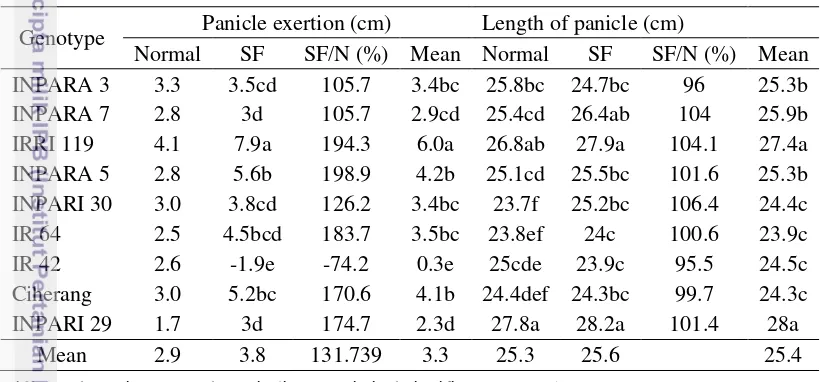
Panicle length in normal and stress conditions were varied. The variance of the character which observed in the two conditions provide an opportunity to obtain information panicle length characteristic of tolerant and susceptible genotypes. Panicle of IRRI 119 was higher than Ciherang and INPARI 30. However, based on the grain yield in drought stress (Table 3.4), the grain yield of three genotypes were not significantly different. Despite INPARI 29 has panicle length was not significantly different with IRRI 119, but grain yield was lowest. This suggests that in addition to panicle length, other characters such as panicle density and the number of secondary branches, must be consider for selection.
Table 3.8 Panicle exertion and length of panicle of rice under normal and stagnant flooding (SF) condition
Genotype Panicle exertion (cm) Length of panicle (cm) Normal SF SF/N (%) Mean Normal SF SF/N (%) Mean INPARA 3 3.3 3.5cd 105.7 3.4bc 25.8bc 24.7bc 96 25.3b INPARA 7 2.8 3d 105.7 2.9cd 25.4cd 26.4ab 104 25.9b IRRI 119 4.1 7.9a 194.3 6.0a 26.8ab 27.9a 104.1 27.4a INPARA 5 2.8 5.6b 198.9 4.2b 25.1cd 25.5bc 101.6 25.3b INPARI 30 3.0 3.8cd 126.2 3.4bc 23.7f 25.2bc 106.4 24.4c IR 64 2.5 4.5bcd 183.7 3.5bc 23.8ef 24c 100.6 23.9c IR 42 2.6 -1.9e -74.2 0.3e 25cde 23.9c 95.5 24.5c Ciherang 3.0 5.2bc 170.6 4.1b 24.4def 24.3bc 99.7 24.3c INPARI 29 1.7 3d 174.7 2.3d 27.8a 28.2a 101.4 28a
Mean 2.9 3.8 131.739 3.3 25.3 25.6 25.4
Different letter in same column indicate statistical significant (P<0.05)
3.3.3 Tolerance Index of stagnant flooding stress
18
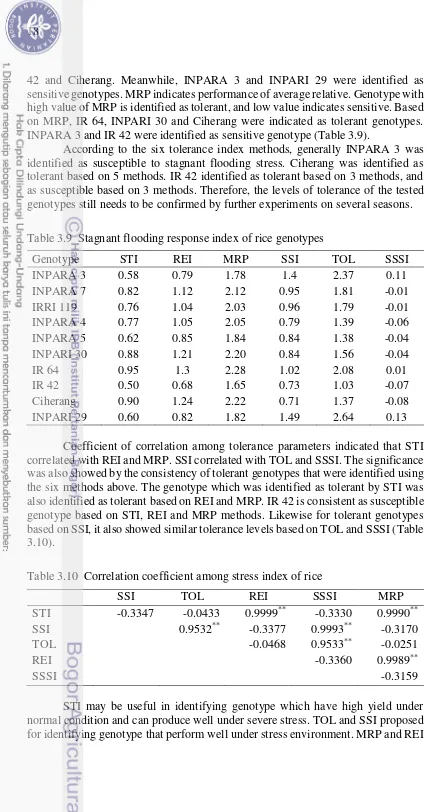
42 and Ciherang. Meanwhile, INPARA 3 and INPARI 29 were identified as sensitive genotypes. MRP indicates performance of average relative. Genotype with high value of MRP is identified as tolerant, and low value indicates sensitive. Based on MRP, IR 64, INPARI 30 and Ciherang were indicated as tolerant genotypes. INPARA 3 and IR 42 were identified as sensitive genotype (Table 3.9).
According to the six tolerance index methods, generally INPARA 3 was identified as susceptible to stagnant flooding stress. Ciherang was identified as tolerant based on 5 methods. IR 42 identified as tolerant based on 3 methods, and as susceptible based on 3 methods. Therefore, the levels of tolerance of the tested genotypes still needs to be confirmed by further experiments on several seasons.
Table 3.9 Stagnant flooding response index of rice genotypes
Genotype STI REI MRP SSI TOL SSSI
INPARA 3 0.58 0.79 1.78 1.4 2.37 0.11
INPARA 7 0.82 1.12 2.12 0.95 1.81 -0.01
IRRI 119 0.76 1.04 2.03 0.96 1.79 -0.01
INPARA 4 0.77 1.05 2.05 0.79 1.39 -0.06
INPARA 5 0.62 0.85 1.84 0.84 1.38 -0.04
INPARI 30 0.88 1.21 2.20 0.84 1.56 -0.04
IR 64 0.95 1.3 2.28 1.02 2.08 0.01
IR 42 0.50 0.68 1.65 0.73 1.03 -0.07
Ciherang 0.90 1.24 2.22 0.71 1.37 -0.08
INPARI 29 0.60 0.82 1.82 1.49 2.64 0.13
Coefficient of correlation among tolerance parameters indicated that STI correlated with REI and MRP. SSI correlated with TOL and SSSI. The significance was also showed by the consistency of tolerant genotypes that were identified using the six methods above. The genotype which was identified as tolerant by STI was also identified as tolerant based on REI and MRP. IR 42 is consistent as susceptible genotype based on STI, REI and MRP methods. Likewise for tolerant genotypes based on SSI, it also showed similar tolerance levels based on TOL and SSSI (Table 3.10).
Table 3.10 Correlation coefficient among stress index of rice
SSI TOL REI SSSI MRP
STI -0.3347 -0.0433 0.9999** -0.3330 0.9990**
SSI 0.9532** -0.3377 0.9993** -0.3170
TOL -0.0468 0.9533** -0.0251
REI -0.3360 0.9989**
SSSI -0.3159
are respectively the sum and product of two ration, (a) genotype control mean/overall control mean and (b) genotype stress mean/overall stress mean. The index values are increase if (a) or (b) is higher. If (b) high, the genotype enters the set of top performers though the performance under normal condition is not the top-most and vice versa. So, MRP and REI are not very effective in distinctively discriminating genotypes that perform well under both normal and stress condition (Raman et al. 2012).
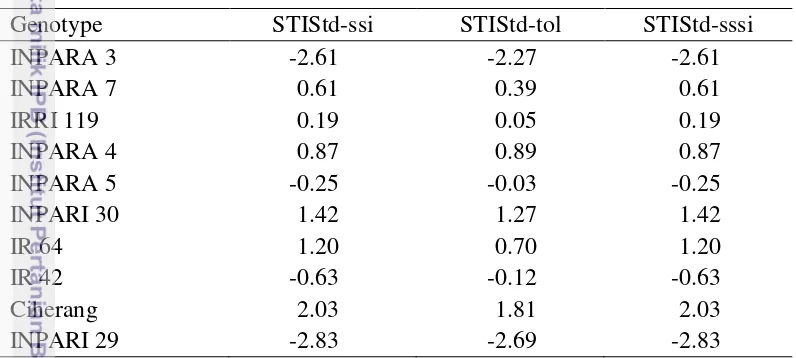
Based on correlation analysis, stress tolerant index could be grouped into two groups. First is tolerance index group involving STI, REI, and MRP. The second is sensitive index group involving SSI, TOL, and SSSI. Level of tolerance based on the six indices was determined using standardizes of index. For first group, STI was selected to be standardized with three sensitive index. Standardized STI was corrected with standardized index of sensitive group so that resulting new standardized index, namely STI (Table 3.11).
Table 3.11 Standardized stress tolerance index of rice
Genotype STIStd-ssi STIStd-tol STIStd-sssi
INPARA 3 -2.61 -2.27 -2.61
INPARA 7 0.61 0.39 0.61
IRRI 119 0.19 0.05 0.19
INPARA 4 0.87 0.89 0.87
INPARA 5 -0.25 -0.03 -0.25
INPARI 30 1.42 1.27 1.42
IR 64 1.20 0.70 1.20
IR 42 -0.63 -0.12 -0.63
Ciherang 2.03 1.81 2.03
INPARI 29 -2.83 -2.69 -2.83
Abbreviation: STIStd-ssi, STIStd-tol, STIStd-sssi = standardized STI corrected by standardized SSI, TOL, dan SSSI, respectively
The STI showed STIStd-ssi was no different with STIStd-sssi. This may be both of index had same derivate of formula. Three STIStd were consistent to identified tolerant and sensitive genotypes. High index values indicating tolerant genotype, vice versa lowest index value indicating sensitive genotype. Based on three index, Ciherang and INPARI 30 were tolerant genotypes, while INPARA 3 and IR 42 were sensitive genotypes. IR 64 was consistent in high value based on STIStd-ssi and STIStd-sssi, but was moderate based on STIStd-tol. IRRI 119 which identified tolerant based on previous study, however in our study it showed moderate sensitive.
3.3.4 Modelling Stress Tolerance Index
20
the factors of character that influence grain yield become independent variables (Gomez 1976).
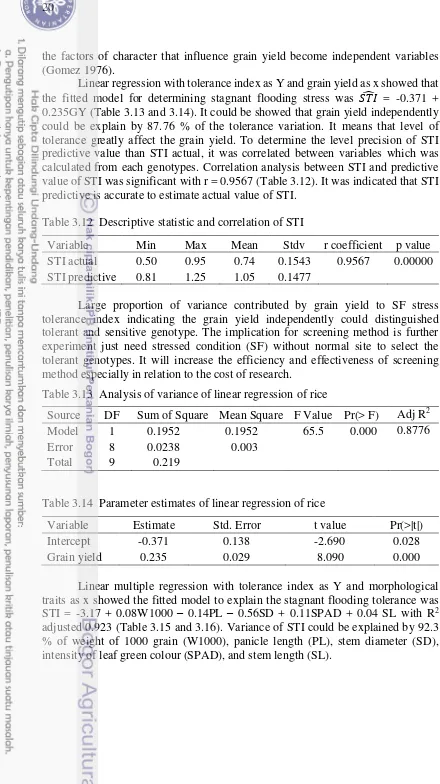
Linear regression with tolerance index as Y and grain yield as x showed that the fitted model for determining stagnant flooding stress was ̂ = -0.371 + 0.235GY (Table 3.13 and 3.14). It could be showed that grain yield independently could be explain by 87.76 % of the tolerance variation. It means that level of tolerance greatly affect the grain yield. To determine the level precision of STI predictive value than STI actual, it was correlated between variables which was calculated from each genotypes. Correlation analysis between STI and predictive value of STI was significant with r = 0.9567 (Table 3.12). It was indicated that STI predictive is accurate to estimate actual value of STI.
Table 3.12 Descriptive statistic and correlation of STI
Variable Min Max Mean Stdv r coefficient p value STI actual 0.50 0.95 0.74 0.1543 0.9567 0.00000
STI predictive 0.81 1.25 1.05 0.1477
Large proportion of variance contributed by grain yield to SF stress tolerance index indicating the grain yield independently could distinguished tolerant and sensitive genotype. The implication for screening method is further experiment just need stressed condition (SF) without normal site to select the tolerant genotypes. It will increase the efficiency and effectiveness of screening method especially in relation to the cost of research.
Table 3.13 Analysis of variance of linear regression of rice
Source DF Sum of Square Mean Square F Value Pr(> F) Adj R2
Model 1 0.1952 0.1952 65.5 0.000 0.8776
Error 8 0.0238 0.003
Total 9 0.219
Table 3.14 Parameter estimates of linear regression of rice
Variable Estimate Std. Error t value Pr(>|t|)
Intercept -0.371 0.138 -2.690 0.028
Grain yield 0.235 0.029 8.090 0.000
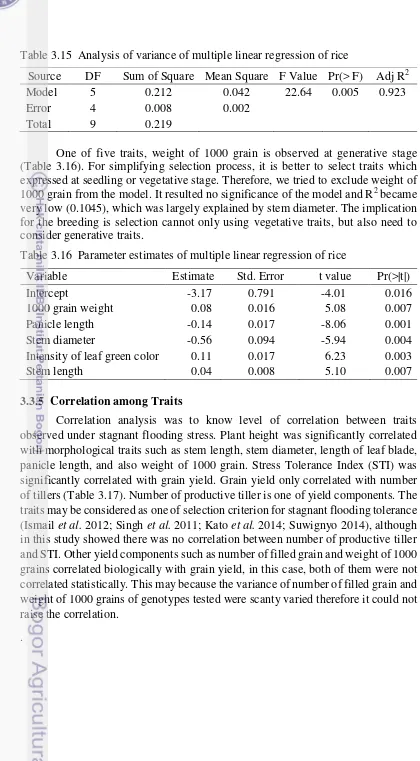
Table 3.15 Analysis of variance of multiple linear regression of rice
Source DF Sum of Square Mean Square F Value Pr(> F) Adj R2
Model 5 0.212 0.042 22.64 0.005 0.923
Error 4 0.008 0.002
Total 9 0.219
One of five traits, weight of 1000 grain is observed at generative stage (Table 3.16). For simplifying selection process, it is better to select traits which expressed at seedling or vegetative stage. Therefore, we tried to exclude weight of 1000 grain from the model. It resulted no significance of the model and R2 became very low (0.1045), which was largely explained by stem diameter. The implication for the breeding is selection cannot only using vegetative traits, but also need to consider generative traits.
Table 3.16 Parameter estimates of multiple linear regression of rice
Variable Estimate Std. Error t value Pr(>|t|)
Intercept -3.17 0.791 -4.01 0.016
1000 grain weight 0.08 0.016 5.08 0.007
Panicle length -0.14 0.017 -8.06 0.001
Stem diameter -0.56 0.094 -5.94 0.004
Intensity of leaf green color 0.11 0.017 6.23 0.003
Stem length 0.04 0.008 5.10 0.007
3.3.5 Correlation among Traits
Correlation analysis was to know level of correlation between traits observed under stagnant flooding stress. Plant height was significantly correlated with morphological traits such as stem length, stem diameter, length of leaf blade, panicle length, and also weight of 1000 grain. Stress Tolerance Index (STI) was significantly correlated with grain yield. Grain yield only correlated with number of tillers (Table 3.17). Number of productive tiller is one of yield components. The traits may be considered as one of selection criterion for stagnant flooding tolerance (Ismail et al. 2012; Singh et al. 2011; Kato et al. 2014; Suwignyo 2014), although in this study showed there was no correlation between number of productive tiller and STI. Other yield components such as number of filled grain and weight of 1000 grains correlated biologically with grain yield, in this case, both of them were not correlated statistically. This may because the variance of number of filled grain and weight of 1000 grains of genotypes tested were scanty varied therefore it could not raise the correlation.
22
Table 3.17 Correlation among traits of rice genotypes under stagnant flooding stress (plot-basis)
Traits PT FG W1000 GY SPAD SL SD LB WB PE PL STI
PH -0.347 0.023 0.356* -0.193 -0.070 0.850** 0.584** 0.569** 0.107 0.196 0.516** -0.130
PT -0.330 -0.314 0.368* 0.108 -0.469** -0.305 -0.304 -0.011 -0.262 -0.294 0.178
FG -0.014 0.077 -0.197 0.082 0.064 -0.044 0.052 0.346 -0.033 -0.032
W1000 -0.026 -0.211 0.416* 0.263 0.112 0.315 0.399* 0.569** 0.151
GY -0.102 -0.204 -0.394* -0.326 0.035 0.225 -0.277 0.866**
SPAD -0.117 -0.293 -0.243 -0.207 -0.264 0.014 -0.043
SL 0.578** 0.662** 0.348 0.322 0.535** -0.129
SD 0.467** 0.214 -0.030 0.183 -0.332
LB 0.422* 0.125 0.436* -0.250
WB 0.048 0.313 0.080
PE 0.351 0.291
PL -0.099
3.3.6 Genetic Variability and Heritability
Under stagnant flooding stress, all observed traits except panicle length showed broad of phenotypic variability, and their genetic variability were varied among the traits (Table 3.18). It mean that the variation greatly influenced by environment not only by genetic per se.
Most of the report identified that grain yield was quantitative trait which is controlled by minor gene and had low heritability. In this study, the heritability of grain yield under stagnant flooding was high. Nugraha et al. (2013) suggested that the flooding stress was obvious discriminator between tolerance and sensitive genotypes resulting a consistent grain yield in a given environment hence the heritability also was high.
Our study showed variability of grain yield was narrow although effect of genotype variance was significantly different (data not shown). Narrowness of grain yield variability may be caused by the narrowness of genetic background of genotypes used. It could be explained through some varieties come from same parent. INPARA 5 (IR 64 SUB1), INPARI 30 (Ciherang SUB1), IR 64, Ciherang have a close genetic relationship. However, the selection based on grain yield under stagnant flooding stress could be done at early generations using bulk segregation.
24
Table 3.18 Genetic and phenotypic variability of rice traits under stagnant flooding stress in dry season of 2015
Traits
Stagnant Flooding Stress
� ± �� Criteria � ± �� Criteria H Criteri a
Plant height 55.16 ±
25.43 B 59.54 ± 1.39 B 0.93 H
Intensity of leaf green
color 2.28 ± 0.99 B 2.32 ± 0.01 B 0.98 H
Number of Productive
tillers 4.99 ± 3.31 N 7.27 ± 0.80 B 0.66 H
Number of filled grain 64.14 ±
69.30 N
171.60 ±
0.80 B 0.43 M
Weight of 1000 grain 0.97 ± 1.36 N 3.53 ± 0.60 B 0.34 M
Grain yield 0.30 ± 0.17 N 0.36 ± 0.60 B 0.77 H
Stem length 33.93 ±
15.92 B 32.08 ± 1.05 B 0.91 H
Stem diameter 0.09 ± 0.06 N 0.12 ± 1.05 B 0.68 H
Length of leaf blade 7.26 ± 6.05 N 14.14 ± 1.95 B 0.54 M
Width of leaf blade 0.00 ± 0.00 N 0.01 ± 1.95 B
-0.86 N
Panicle exertion 7.31 ± 3.28 B 6.59 ± 0.12 B 0.95 H
Panicle length 2.27 ± 1.05 B 2.46 ± 0.06 B 0.93 H
Abbreviation: � ± �� is genotypic variance and its standard deviation; � ± �� is phenotypic variance and its standard deviation; h2 is heritability; B = broad; N = narrow; H = high; M = medium;
L=low
3.4 Conclusion and Suggestion
4 INHERITANCE STUDY OF AGRONOMICAL TRAITS OF
RICE UNDER STAGNANT FLOODING AND NORMAL
CONDITION
Abstract
Information of genetic model related to stagnant flooding tolerance is essential in the utilization of rice germplasm for improving the effectiveness of breeding program. This study aimed to elucidate genetic control and heritability of agronomic traits under stagnant flooding stress and normal conditions. The rice genotype IRRI 119 was used as a tolerant parent and IR 42 as a sensitive parent. The materials used were six population which were obtained from crossing of the genotypes. The materials were grown at the stagnant flooding stress and normal spot. The experiment was conducted at the Experimental Station of Indonesian Center for Rice Research in the wet season of December 2015 to April 2016. The grain yield and yield components did not fit to additive-dominant model, which indicating the presence of non-allelic interaction. Joint scaling test with six parameter revealed duplicate and complementary epistasis fitted to explain gene action model. The heritability estimates under stress condition were lower compared to the ones in the controlled condition. The strategy for breeding program to improving grain yield under stagnant flooding stress is delaying the selection after several generations until high level of gene fixation was attained. Additionally, it could be useful to conduct shuttle breeding between stress and controlled environment.
Key words: generation mean analysis, joint scaling test, stagnant flooding, rice
4.1 Introduction
Rice is often the only cereal that can be grown in flood-prone ecosystem. Rice fields in these flood-prone areas are subject to either transient flash floods leading to total submergence or to long-term partial floods (stagnant flooding, SF), and both often occur in the same field within one cropping season (Mackill et al. 1996). Stagnant flooding (prolonged partial flooding; medium deep) occurs in areas when floodwater of 25–50 cm stagnates in the field from a few weeks to several months.
Rice varieties respond to the slowly rising water of stagnant flooding by elongating their stems or leaves (escape). Internode elongation keeps the top leaves above the water surface, thereby facilitating respiration. Moderate shoot elongation rate strongly and positively correlated with grain yield under stagnant flooding. However, elongation at rates of >2.0 cm day-1 was associated with reduced harvest index due to a smaller panicle size and the increased lodging. Tolerant varieties should be inherently tall or elongate moderately along with the rising of the water. Improvement of stagnant flooding tolerant should involve combination of both of these traits to develop an appropriate phenotype (Kato et al. 2014).