REGIONAL FREIGHT TRANSPORTATION
PLANNING: AN OVERVIEW OF DEVELOPING
METHODOLOGY
Article
CITATIONS
3
READS
95
5 authors, including:
Some of the authors of this publication are also working on these related projects:
The development teaching materials on railways planning and engineering
View project
Pedestrian crossing behaviour on freeways in Cape Town: A stated Choice experiment
View
project
Noor Mahmudah
Universitas Muhammadiyah Yogyakarta 7PUBLICATIONS 6CITATIONS
SEE PROFILE
Mark Zuidgeest
University of Cape Town 79PUBLICATIONS 297CITATIONS
SEE PROFILE
All in-text references underlined in blue are linked to publications on ResearchGate, letting you access and read them immediately.
99
REGIONAL FREIGHT TRANSPORTATION PLANNING:AN OVERVIEW OF DEVELOPING METHODOLOGY
Noor Mahmudah1*, Danang Parikesit2 Siti Malkhamah
,
3
, Sigit Priyanto4, and Mark Zuidgeest5
ABSTRACT:
There is a parallel evolution of a political economy and the transportation system either in developed or developing countries. The growth of economic will increase the number of ton-km of freight transportation. As flows of freight and their impacts increase, transportation planners, managers, and operators have a more concern to develop a better methods for tracking and monitoring the flows of commodities and analyzing the impacts of these flows to the transportation infrastructures. Current estimation of freight flows and analysis methods have several problems, which are related to the data and the method itself.
This paper attempts to elaborate the relationship of the economics activities of commodities toward export - specifically the production of goods and services that generate freight transportation, the spatial data of commodities related to the economics’ activities (resources, factories, and outlets), the transportation data (infrastructures, modes, and services), and government regulations, in formulating the method for freight transportation planning to produce an efficient freight movement to enhance sustainable mobility and economic development in the regional scale.
Keywords:methodology; planning; regional freight transportation
1 Ph.D Candidate, Dept. of Civil and Environmental Engineering, UGM, Jl. Grafika No. 2, Yogyakarta, 55281, INDONESIA 2 Prof. Dr., Dept. of Civil and Environmental Engineering, UGM, Jl. Grafika No. 2, Yogyakarta, 55281, INDONESIA 3 Prof. Dr., Dept. of Civil and Environmental Engineering, UGM, Jl. Grafika No. 2, Yogyakarta, 55281, INDONESIA 4 Prof. Dr., Dept. of Civil and Environmental Engineering, UGM, Jl. Grafika No. 2, Yogyakarta, 55281, INDONESIA 5 Assistant Professor, Dr., ITC, University of Twente, Hengelosestraat 99, 7514 AE, Enschede, THE NETHERLANDS
*Correspondence Author: Noor Mahmudah, Jl. Grafika No. 2, Yogyakarta, 55281, INDONESIA. Tel: +62 274 6497249,
100
1. INTRODUCTION
There is a parallel evolution of a political economy and the transportation system either in developed or developing countries.
Th
e growth of economic will also increase the number of ton-km of freight transportation. The case of European Union and Indonesia showed that across all freight transport modes, road freight transportation remains dominant (Stead and Banister, 2006; Lubis et al, 2005). On the other hand, empirical studies also showed that the domination of road freight transportation caused economic loss, safety and environmental problems. Road deterioration and traffic accident due to overloaded truck, and adverse impact to the environment due to gas emissions and noise of truck, are the main problems raised from road freight transportation (Kreutzberger et al, 2003).As flows of freight and their impacts increase, transportation planners, managers, and operators have a more concern to develop a better methods for tracking and monitoring the flows of commodities and analyzing the impacts of these flows to the transportation infrastructures. Current estimation of freight flows and analysis methods have several problems, which are related to the data and the method itself. The existing freight transportation planning methods, for instance, are generally adopted from the conventional four-stage model (Houlguin-Veras et al, 2001; Southworth, 2002; De Jong et al, 2004).
To formulate an effective strategy for regional transportation planning, the planners or policy makers need to know the location of resources, processing or factory locations, and the final outlet (ports) to send their goods to the outside world. To do this, various characteristics of the different commodities and the available networks that can be used, need to be known. An understanding of how the relationships between commodities’ activities and transportation are linked by spatial structure is essential. Therefore, this study attempts to elaborate the relationship of the economics activities of commodities toward export - specifically the production of goods and services that generate freight transportation, the spatial data of commodities related to the economics’ activities (resources, factories, and outlets), the transportation data (infrastructures, modes, and services), and government regulations, in formulating the method for freight transportation planning by considering intermodality concept, to produce an efficient freight movement to enhance sustainable mobility and economic development in the regional scale.
In general, this paper aims to formulate the methodology for a regional freight transportation planning by employing the concept of inter-modality and spatial models in order to achieve the efficient transportation system. In more specific, the objectives of this paper are: a) to summarize the conceptual framework of the current models of freight transportation planning; and b) to elaborate the developing method of regional freight transportation planning.
2. LITERATURE REVIEW
101
To enhance efficiency and quality in transportation development, it is necessary to improve the overall cost effectiveness and functioning of transportation operations and infrastructures. Nowadays, inter-modality is more and more realized to provide a better performing of transportation system (Kreutzbergeret al, 2006b) because of environmental concerns, reasons of efficiency and the benefits of co-ordination of modes to cope with growing transportation flows (OECD, 1997 in Bontekoning, 2000; Bontekoning et al, 2004). In addition, inter-modality is now widely used to enhance the freight transportation that is seamless, efficient, and sustainable to achieve specific goals (Rodrigue, et al, 2004).
The existing models of freight transportation planning, in general, are adopting from the ones used for passenger transportation like the four-stage-model (Houlguin-Veras et al, 2001; Southworth, 2002; De Jong et al, 2004). Southworth (2002) introduced a model of freight transportation, which is known as a multi-step freight planning model. The conceptual framework of this model is originally consisted of: (a) freight generation/attraction; (b) flow modelling/trip distribution; (c) modal split; and (d) traffic route assignment respectively. When the planning process is intended to translate the commodity flows into vehicle movements so the fifth step is required, this is called modelling of vehicle load factors. This vehicle/fleet loading may occur as step four in the modelling process, which is conducted after mode split model or alternatively, it may occur at trip generation stage, producing truck trip forecasts that are suitable for direct application to the subsequent traffic route assignment stage. Where truck traffic is concerned, it is usual to carry out mixed freight-passenger travel assignments to capture the effects of traffic congestion on shipment times and hence freight delivery costs. In theory, these congestion inclusive costs can then be fed back through the freight flow modelling, modal split, and vehicle loading steps, and iterated until the system of model equations stabilizes on a set of transportation costs and flows. Variations on such process have been used to analyze corridor-specific, metropolitan area wide and state-wide freight movement systems (Holguin-Veras and Thorson, 2000; 2003a; 2003b).
Holguin-Veras and Thorson (2000) and Holguin-Veras et al (2001) have promoted the models of freight transportation planning which are known as commodity-based and trip-based models. Both models have been identified as the appropriate models for the New York Metropolitan Region that has specific location and transportation demands. In general, these two freight transportation models have been built on either of two platforms: vehicle (trip)-based or commodity-based modelling. These platforms model vehicle trips and commodity type typically by size and weight respectively. The common approaches of both models are trip generation, trip distribution and traffic assignment.
102
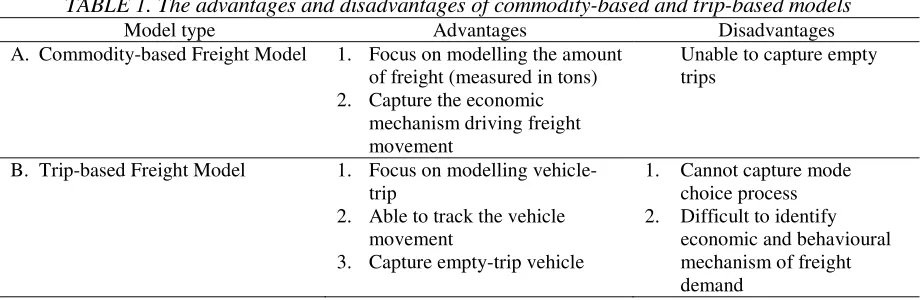
TABLE 1. The advantages and disadvantages of commodity-based and trip-based models
Model type Advantages Disadvantages
A. Commodity-based Freight Model 1. Focus on modelling the amount
of freight (measured in tons) 2. Capture the economic
mechanism driving freight movement
Unable to capture empty trips
B. Trip-based Freight Model 1. Focus on modelling
vehicle-trip
2. Able to track the vehicle movement
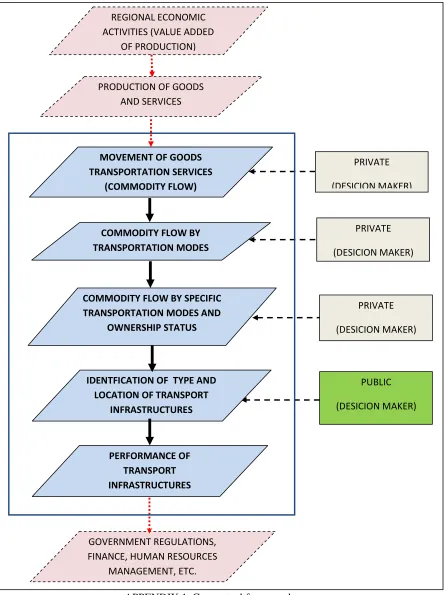
The conceptual framework used in developing methodology for regional freight transportation planning is as illustrated in Appendix 1. The regional economic activities, especially related to the production of goods and services, is considered as the freight driven. The goods movement and transportation services will be analyzed further through spatial location and transportation modelling. The spatial location model will be simulating and then mapping of the optimum access/location of factories and outlets of selected commodities in term of distance. Furthermore, transportation model analyze the freight’ flows originated from the resources to the factories and from the factories to the desired outlets (ports) by considering the optimum generalized cost as the indicator of transportation performance. The flows of these commodities are supposed to be transported by specific transportation modes through particular route of available transportation networks. Moreover, the vehicle ownership status will also be considered as the attributes/factors influencing the generalized cost of these flows. The type and location of transportation infrastructures (networks and ports) are applied as strategy (scenario) in the model to achieve the efficient transportation system (insfrastructure and service). Hence, the expected valuable output of these models are the optimum generalized costs resulted from the optimum location of resources, factories, and transportation infrastructures to enhance freight mobility either for production or distribution activities in the regional scale.
The proposed methodology for regional freight transportation planning is as depicted in Appendix 2. In general, this method consists of two parts. The first part is desk study on socio-economic development of particular region and selection of important commodities in the region using Regional Income (RI) model. In this part, all data used in analysis is already available (given) in form of secondary data. The second part is the process of freight transportation planning, in which spatial location and transportation models are part of it. The data that will be used in model building should be obtained from the research. This part consist of qualitative survey on goods production and movement (flow) of selected commodities, mapping of (optimum) spatial location of selected commodities using ArcGIS, and modelling of freight transportation using FlowMap and ArcGIS to determine the generalized cost (GC), which is used as an indicator of efficient transportation system. Identification of type and location of infrastructures are then considered as strategies or scenarios that are applied in transportation modelling in order to achieve an optimum model, which is reflected into optimum generalized cost. The transportation planning processes can be illustrated as follows:
103
aims to prepare the good quality of questioner to be used as a tool in qualitative survey on goods production and goods movement.b) The second stage is conducting qualitative survey on goods production and transportation of selected commodities in study area. It is primarily directed to the shippers. However, it may also need to survey on carriers to obtain more precise models representation of the actual conditions. The data obtained from the survey are then refined and selected as the attributes considered in transportation model either using ArcGIS or FlowMap. In general, the expected data from this survey are: (1) economic activities of selected commodities, especially the activities related to goods production and services (annual production, economic value, logistics chain, technology); (2) spatial data related to commodity and infrastructures (e.g. location of resources, factory, outlet of produced commodity, and transportation networks); (3) transportation data such as transport infrastructures characteristics (road and river networks, river and sea ports), vehicle characteristics (type, capacity, speed, ownership), and transportation services (transport cost/fare, travel time, and reliability); and (4) policy such as government regulations and regional master plan.
c) The third stage is mapping of spatial location of selected commodities using ArcGIS. The data required as the input are spatial data of resources (raw materials), outlet for sending the produced goods, transportation networks (road and river), and available policy/regulations. The location of factories is then simulated by considering the accessibility of such factories to the available transportation networks. Regional master plan will be considered as the constraints to the model. Shortest route (in term of distance) between particular factory to certain networks (road, river, or both road and river) is considered as the optimum spatial location of selected commodities.
d) The fourth, fifth, sixth, and seventh stages are actually attached with transportation modelling as well as spatial location of selected commodities. Modelling of freight transportation using ArcGIS and FlowMap is considered as the fourth stage. The data required in this stage are spatial data of selected commodities (location of resources, factories, and outlets), transportation availability (networks, ports, and vehicle characteristics), and policy/government regulations. In addition, to capture the shippers or carriers preference and intention to specific attributes of transportation such as modes, destinations, or service quality, so the quantitative survey (the fifth stage) is required to conduct. The outputs of freight transportation model are utility and generalized cost models. Generalized cost is also used as indicator of transportation system performance. To improve transportation performance, identification of type and location of transport infrastructures (sixth stage) are then applied as strategy or scenario in the model. The transportation system performance is checked again by comparing the value of generalized cost before and after applying such strategy. This procedure is conducted iteratively until the satisfied model - with optimum generalized cost, is achieved. Model calibration and validation (seventh stage) will be done by using statistical analysis (significance test or t-test, goodness of fit statistics or R2, and root mean square error or RMSE) and by testing the models to other areas or commodities. The valid model obtained is accepted as the optimum model.
104
the transportation modelling but also involving the spatial location modelling/mapping, especially in determination of factories/industries’ location, and considers the government regulations as the constraint, in formulating the freight transportation planning for regional scale. Thus, it is expected that this method can produce the more realistic/practical transportation model because of the location of economics activities that generate freight transportation is considered in the model and can be changed dynamically over time. This new method also offers a more efficient stage of transportation modelling where the distribution, modal split, and route assignment models are conducted in the same time. All simulation models will be built on the basis of up-to-date GIS software that is now widely used in the spatial location modelling (and mapping) and transportation modelling. However, this method faces with the great challenges in data collection (by using disaggregate data) and database construction because it requires large data to be formatted and converted into GIS database.
4. FREIGHT TRANSPORTATION MODEL
The field of freight transportation modelling has developed very fast into different directions all over the world. As noted by Tavasszy (2006), since the commencing of transportation modelling, freight demand modelling has gone through a number of major development stages. In general, freight transport demand modelling can be distinguished by considering the decision problem (e.g. production and consumption, trade, logistics services, network and routing), typical modelling challenges (e.g. trip generation and facility location, mode choice, intermodal transportation, and the relationship of freight economy), and typical techniques employed (e.g. discrete choice models, network assignment, and simulation).
This research is intended to utilize the freight network simulation, especially using ArcGIS and FlowMap softwares by considering spatial and transportation factors as the input, and government regulation as the constrains, to modelling intermodal freight transportation in regional scale by considering the generalized costs as efficiency indicator of optimum transportation system. It is important to be noted that spatial location and transportation models that are then constructed in this modelling are part of proposed methodology for regional freight transportation planning as the general objectives of this research. The considered factors in building the models among others: the type of commodities; transportation services (travel cost, travel time, and climate); the type of transportation modes (truck, barge/ship, truck-barge combination); and status of vehicle ownership (own-vehicle and hired vehicle). The expected output of the research is the optimum generalized cost resulted from the optimum location of resources, factories, and outlets, and the type and location of transportation infrastructures to support the freight flow either for production or distribution activities of specified commodities in the regional scale. The framework considered to model freight transportation for the regional scale is as depicted in Figure 1.
105
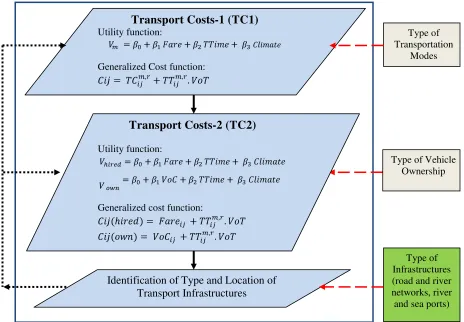
as the indicator of an efficient transportation system in the shippers’ point of view. The optimum generalized cost is the optimum of total cost spent from origin to the final destinations.FIGURE 1. Framework of regional freight transportation model
The specification of freight transportation model can be distinguished as: 1) Mode split model at the first layer and so called transportation costs 1 (TC-1); and 2) Mode split model at the second layer and so called transportation costs 2 (TC-2).
1) At the first layer, transportation model is constructed by considering the mode split of truck, barge, and combination of truck-barge. The attributes, which are represented utility, are total travel time, vehicle operation cost, and climate. The probability in choosing specific transportation mode is calculated using Multinomial Logit Model. The framework of mode split as illustrated in Figure 2.
FIGURE 2. Framework of modal split model at first layer
Barge (B) Mode Split
Truck (T) Truck- Barge(TB)
Type of Infrastructures (road and river networks, river and sea ports) Identification of Type and Location of
Transport Infrastructures
Transport Costs-1 (TC1)
Utility function:
Generalized Cost function:
Type of Transportation
Modes
Transport Costs-2 (TC2)
Utility function:
Generalized cost function:
106
Utility functions is using linear form that is expressed as follows:
(1)
Generalized Cost is expressed as follows:
(2)
Where
Vm
Cij : generalized cost (Rp)
: utility function for mode type m
: fare from i to j on link r for mode type m (Rp), measured in economic cost : value of time (Rp/hr)
: total travel time spent from i to j on link r for mode type m (hr)
β0, β1, β2
, β3
Climate : Number of hours per year the road/river to each destination are restricted the : Constants to be obtained from the model
circulation of particular mode
Multinomial logit model utilized in the model are:
(3)
(4)
(5)
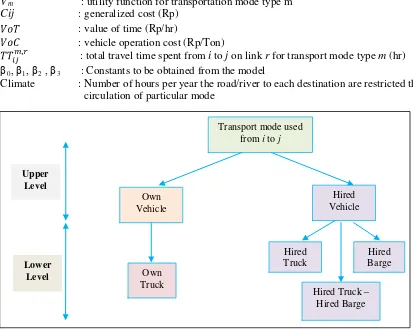
2) In the second layer, transportation model is constructed by considering the differentiation in transportation modes (truck, barge, and combination of truck-barge) and vehicle ownership (own/hired vehicle). Firstly, the mode split of truck, barge, and truck-barge, will be established in the lower level. Moreover, in the upper level, these transportation modes are then grouped on the basis of their ownership (own or hired vehicle). Nested Multinomial Logit model will be used in analysis of mode split. The attributes considered are total travel time, travel cost, climate and vehicle ownership. The group of transport mode is as illustrated in Figure 3.
Calculation of utility function, generalized cost, and probability at lower level is as same as the calculation at first layer analysis. While at upper level analysis, utility function is using linear form and is expressed as follows:
(6)
(7)
Generalized Cost is calculated as the followings:
107
Where:Vm
Cij : generalized cost (Rp)
: utility function for transportation mode type m
: value of time (Rp/hr)
: vehicle operation cost (Rp/Ton)
: total travel time spent from i to j on link r for transport mode type m (hr)
β0, β1, β2 , β3
Climate : Number of hours per year the road/river to each destination are restricted the : Constants to be obtained from the model
circulation of particular mode
FIGURE 3. Framework of modal split model at second layer
To calculate the probability of particular transportation mode in upper level, so the Nested Multinomial Logit model adopted from Jiang et al (1999) is utilized:
x
(10)
Travel cost for hired vehicle is fare or tariff in term of economic cost, which is obtained from the qualitative survey. This assumption is taken because the transport cost of freight transport of hired vehicle is generally negotiable thus difficult to define precisely (Ortuzar and Willumsen, 1994; Friedrich et al, 2003). Further, the cost of freight transport of own-vehicle defined as vehicle operation cost that is calculated using economic cost. Freight transportation modellings are conducted using software of ArcGIS version 9.3 and FlowMap Educational Edition 7.3.1.
Upper Level
Lower Level
Hired Truck Own
Vehicle
Hired Barge
Hired Truck – Hired Barge Transport mode used
from i to j
Hired Vehicle
108
5. INITIAL RESULTS OF ANALYSIS
5.1. CASE STUDY OVERVIEW
Recently the government of Indonesia stated that palm oil industry plays more important roles, at least, in three areas of the economic development. Firstly, it contributes significantly to the creation of millions employment opportunities and the alleviation of poverty, especially in rural areas. Secondly, palm oil industry is also one of the engines of regional development. Many areas developed mainly due to the existence and expansion of this industry. Thirdly, palm oil industry has become major non-oil export earnings. In 2008, for example, the export earnings from palm oil valued at around US $ 12.4 billion dollars, which is the largest contributor of export earnings non-oil exports (The Coordinating Ministry for Economic Affairs, 2009).
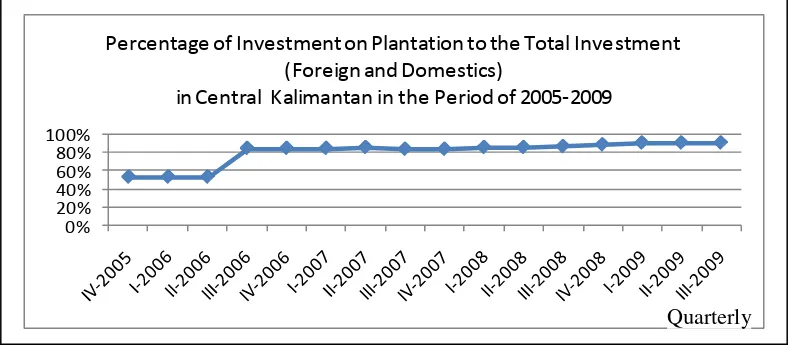
The Province of Central Kalimantan is the fourth-largest-palm plantation in Indonesia, after the Province of Riau, North Sumatra and South Sumatra respectively. In 2009, the total area of palm plantations in Central Kalimantan is 4,011,032.364 Ha but only 1,687,969.104 Ha that has been operated and licensed. Crude Palm Oil (CPO), which is the primary products of palm plantation, grew 13.5% by the period of 2000-2004 and it rose up to 15% in 2007. The current productivity of palm plantation to produce CPO in Central Kalimantan is around 0.205 ton CPO/ha/year (Provincial Government of Central Kalimantan, 2009). Investment and consumption are the main activities of activator economy in Central Kalimantan. By considering the foreign and domestic investment in the last five years (2005 to 2009) - as reported by Central Bank of Indonesia, the growth of investment in plantation, which is mostly to support CPO industries, is as illustrated in Figure 4.
FIGURE 4. Investment on plantation in Central Kalimantan Source: Central Bank of Indonesia, 2009
Nowadays, most of national and provincial roads in Central Kalimantan, which are used as the main access for CPO production and distribution, are in poor condition. According to the Public Works Office of Central Kalimantan Province (2006), it is estimated more than 50% of the existing roads, which consist of 1,707.57 km-long national road and 1,050.26 km-long of provincial road, are in bad condition due to truck-overloaded. Most of the trucks transporting CPO are loaded up to 12 tons although maximum of the prevailed axle load is only 8 ton. This circumstance is not only affecting the transport infrastructures (like road deterioration) but also the transportation services as well (like longer travel time and higher transportation cost due to low speed of vehicle). Therefore, an appropriate method of freight transportation planning (including modelling), in relation to the spatial location of commodities’ activities
0% 20% 40% 60% 80% 100%
Percentage of Investment on Plantation to the Total Investment (Foreign and Domestics)
in Central Kalimantan in the Period of 2005-2009
109
is required to achieve efficient freight flow in the region. The data used in the model analysis and vehicle characteristics are presented in Table 5 and 6.TABLE 5. Data used for modelling CPO transportation
No Data Format Year
1. Administrative map Geo-database 2006
2. Road network Geo-database 2006
3. River network Geo-database 2006
4. Port map Geo-database 2006
5. Land use map Geo-database 2006
6. Regional spatial plan (RTRW Province) Geo-database 2006
7. Palm plantation map Geo-database 2006
8. Regional economic growth Pdf file 2005-2009
9. Documentation of CPO processing and economics activities Pdf file 2006
10 Documentation of port facilities and performance Pdf file 2005–2008
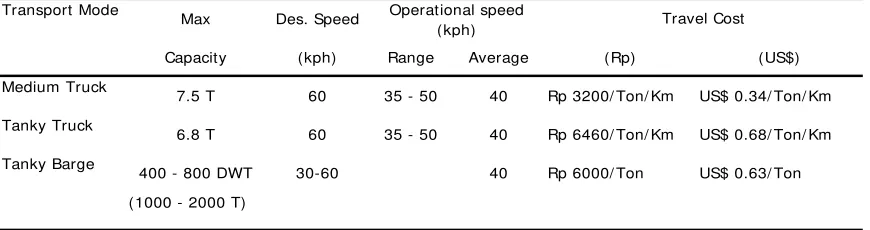
TABLE 6. Vehicle characteristics of CPO transportation in Central Kalimantan Province
Source: Preliminary survey to CPO firms, 2009
5.2. MODELLING LOCATION CHOICE AND SPATIAL PATTERN OF CPO PRODUCTION
There are 2 steps considered in modelling location choice of CPO factory: identification of optimum location of CPO factory; and identification of the shortest route of CPO transportation from factory to the networks. Identification of the most likely location of CPO factories in this study is started from calculation of production capacity of palm plantation for every year. Production capacity of plantation was classified in three classes according to area service. Assumption used in this study is that every plantation should have minimum area 5400 ha to have a factory. Proximity analysis using nearest distance to closest factory is used to identify the un-served plantations.
Identification of the shortest route of CPO transport from factory to the road and river network that consist of: a) identification of intermediate points on the closest road and river networks from the factories; and b) identification of accessibility level of factories to the networks. Intermediate points are points in the road or river to transport CPO from factories to the final ports. Intermediate points are calculated from the shortest distance of factories to the road and river networks. The function of intermediate points in this process is to know the level of accessibility of factories to networks and to identify the starting points of transport route to the ports.
Accessibility levels show the ease to transport CPO from factories to the closest intermediate points in the road and river networks. To identify the level of accessibility, the assumption is based on average velocity of road transport mode (40 km/hour). The accessibility is classified as good if the distance is less than 10 km (15 minutes trip), 10–20 km for moderate and more than 20 – 30 km for bad accessibility. The results of this process are the map accessibility of factories to the road and river networks.
Max Des. Speed
Capacity (kph) Range Average (Rp) (US$)
Medium Truck
7.5 T 60 35 - 50 40 Rp 3200/ Ton/ Km US$ 0.34/ Ton/ Km
Tanky Truck
6.8 T 60 35 - 50 40 Rp 6460/ Ton/ Km US$ 0.68/ Ton/ Km
Tanky Barge
400 - 800 DWT 30-60 40 Rp 6000/ Ton US$ 0.63/ Ton
(1000 - 2000 T)
Transport Mode Operational speed
110
5.3. MODELLING REGIONAL FREIGHT TRANSPORTATION OF CPO COMMODITY
There are several processes required in modelling regional freight transportation for CPO commodity in Central Kalimantan Province by using network analysis of ArcGIS software. These processes consist of modelling distance, time, and cost of specific transportation mode, determining the nearest port, determining the shortest route of using road and river networks, and modelling of probability of choosing certain modes of transportation.
Identification of efficient CPO transportation from road and river networks by using various modes considers some criteria, which are distance, travel time, and travel cost. For these criteria, the calculation conducted by considering the average speed and travel cost of each modes. The average speed used, based on assumption that there is no different classes among networks either in road or river network, so that all segments in networks can be passed in the same speed without impedance. In terms of road network, the distance was calculated by considering the distance from the factories to road networks (intermediate points in road), based on a detour distance factor of 1,2 (1.2*Eucledian distance). For river network, the calculation of these criteria is conducted by combination of both road and river networks. The combination is used because the factories are not directly attach to the river networks, so that for reaching the river network, CPO are transporting first to the river by using road networks.
The closest facilities analysis is conducted to identify the destination port where the CPO will be sent. The closest facility option in ArcGIS is used, based on the assumption that people tend to go to relatively closest facilities around them rather than to farther away facilities, because of distance, time and cost reasoning. Utility function measures the satisfaction level perceived by the decision-maker upon which he or she makes the choice decision. In term of transport, people consider time, cost, and other factors for satisfying them. This study only considers time and cost for determining utility that is indicated in linear function and is expressed as follows:
(11)
Generalized cost function is regarded as disutility or deterrence functions (Ortuzar and Willumsen, 1994) and it is considering the following formula:
(12)
Estimation parameter is minus because it represents the disutility function of time and cost.
Probability of choosing certain modes is calculated by using the logit model from utility function of transportation by road and river. The logit model used for determining the probability of choosing certain mode is:
Where: Vroad= utility of road network, and Vriver= utility of river network
5.4. RESULTS AND DISCUSSIONS
111
(18%) having moderate accessibility (10-20 km and 10-30 minutes time), and 7 factories (6%) have bad accessibility level to road (>20km and >30 minutes time). On the other hands, the accessibility level of factories and plantation served to the river network is mostly bad. It is about 43 factories (38%) are in bad accessibility. They need more than 30 minutes to reach the closest river. The rest is 34 factories (30%) have good accessibility, and 36 factories (32%) have moderate accessibility to river. Considering the accessibility on both road and river networks, the plantation accessibility to network can be determined. There are 91 factories (81%) are identified accessible to the networks, 19 factories (17%) are moderate, and only 3 factories (2%) are not accessible in both road and river networks.The CPO is transported from factory to the 2 main ports, which are Kumai and Sampit. The CPO will be delivered to the closest ports as the destination. The closest port is identifying through both road and river networks. Using road network, 84 factories send their product to port 1 (Sampit), and the rest (29) send their product to port 2 (Kumai). However, by using river network, 91 factories send their product to port 1 (Sampit), and 22 factories to port 2 (Kumai). It is interesting in some cases, because the same factory has different closest port by using different networks (river and road). For example in the case of factory 1, the closest port by using road network is Kumai, on the other hands, by using river networks the closest port is Sampit. This condition is closely related to the factory location from road and river networks (accessibility level to network), and the travel distance by using road and river from factory to port. These conditions also considered on the latter step for determining the efficient routes from factories to ports, especially to which port and network the CPO will be delivered efficiently.
The utility of each mode (river, and road) is defined by the equation considering travel time and cost, and
the weighting factor of cost considered 4 times more important than time. The estimated parameters β1 and β2 are derived from trial and error process, considering former assumption in which people regard
cost factor is 4 times important than time, because CPO is categorized into un-perishable goods. Hence the equation for utility either for road and river obtained are as follows:
(15)
The decimal 6 used because of the different fraction in term of time and cost. Time uses units and cost uses hundred thousands, and even millions. In fact, there are other factors should be considered for utility calculation, such as reliability of river network that is influenced by climate and also error estimation, but this study only limits the analysis on travel time and cost.
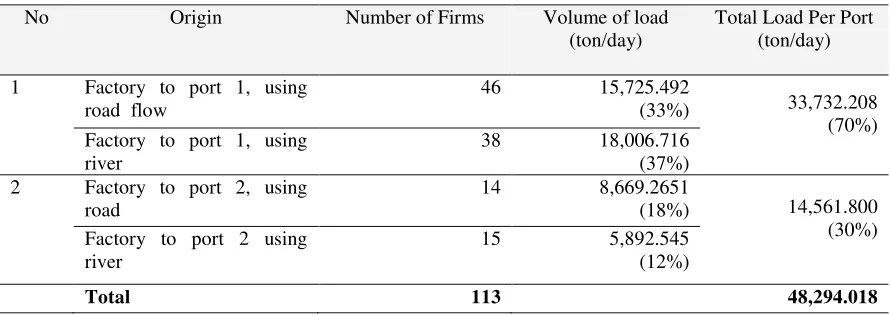
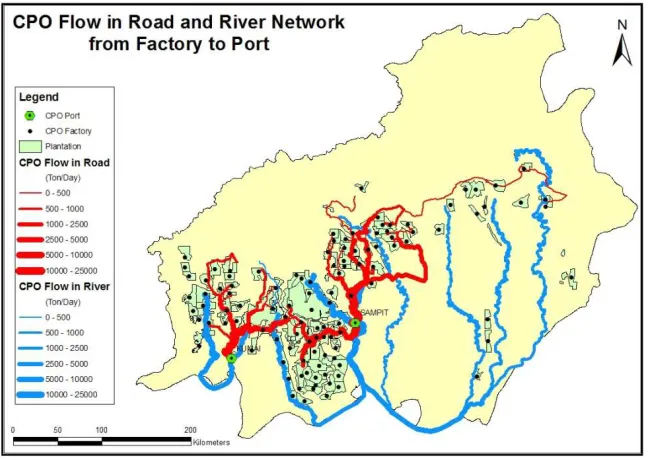
The CPO flow is calculated by considering the probability of choosing modes, meaning that a factory probably will send CPO only by using river or road network to the nearest port based on this probability. It then yields the volume of commodity flow to certain port. Table 7 and Figure 5 illustrate the flow of CPO from factories using road and river networks to the Sampit Port and Kumai Port in Central Kalimantan Province.
TABLE 7. CPO flows on the road and river networks
No Origin Number of Firms Volume of load Factory to port 1, using
river Factory to port 2 using
river
15 5,892.545
(12%)
112
FIGURE 5. CPO flows on the road and river networks
The accessibility level depends primarily on the distance from factory to reach the closest networks. In term of road networks, the plantations with bad accessibility to road are located on the southern part of the study area, because of the lack of road infrastructures in this area. By considering the travel time and travel cost, the road network is more efficient for transporting CPO in the study area. It is also proved by the higher probability in choosing this transportation mode. However, the river network also has opportunity to compete with road network in term of travel cost. According to the result, there is little different between probability to choose road or river networks.
This study only considers travel time and cost for determining utility. In fact, there are other attributes should be considered for utility calculation such as reliability of river network that is influenced by climate and also error estimation. Moreover, the port (outlet) choice is only dependent on the shortest route in terms of distance, travel time and cost, and ignored other attributes such as the shipper or carrier preference, and other transportation service attributes (e.g. network reliability). Therefore, conducting quantitative survey is highly recommended to get more realistic and the better model in the future.
6. CONCLUSION
To formulate an effective strategy for regional transportation planning, the planners or policy makers need to know the location of resources, processing or factory locations, and the final outlet (ports) to send their goods to the outside world. To do this, various characteristics of the different commodities and the available networks that can be used, need to be known. An understanding of how the relationships between commodities’ activities and transportation are linked by spatial structure is essential.
113
because the location of economics activities that generate freight transportation is considered in the model and can be changed dynamically over time.This new method also offers a more efficient stage of transportation modelling where the distribution, modal split, and route assignment models are conducted in the same time. All simulation models will be built on the basis of up-to-date GIS software that is now widely used in the spatial location modelling (and mapping) and transportation modelling. However, this method faces with the great challenges in data collection and database construction because it requires large data to be formatted and converted into GIS database.
ACKNOWLEDGEMENT
The authors would like to thank the World Class Research University (WCRU) of Civil and Environmental Engineering, Faculty of Engineering, Universitas Gadjah Mada for providing partial funding to this research, and Prof. Dr. Ir. Martin van Marseveen and Dr. Ir. Mark Zuidgeest for conducting research at ITC, University of Twente, The Netherlands.
REFERENCES
Ando, A., Meng, B. (2006). Transport sector and regional price differentials: A SCGE model for Chinese Provinces. Discussion Paper No. 81, Institute of Developing Economies (IDE), JETRO, Chiba, Japan.
Bontekoning, Y.M., Macharis, C., Trip, J.J. (2004). Is a new applied transportation research field emerging?A review of intermodal rail-truck freight transport literature. Transportation Research Part A 38 (2004), 1–34.
Bontekoning, Y.M. (2000). A jump forward in intermodal freight transport: are hub-terminals an alternative for shunting? TRAIL Research School, Delft.
Central Bank of Indonesia. (2009). Kajian Ekonomi Regional Provinsi Kalimantan Tengah. Retrieved from
De Jong, G., Gun, H. F., Walker, W. (2004). National and international freight transport models: an overview and ideas for further development.Transport Reviews 24 (1),103 – 124. Retrieved from
Friedrich, F. M., Haupt, T., Noekel, K. (2003). Freight modelling: data issues, survey methods, demand and network models, CD-ROM in Proceedings of 10th International Conference on Travel Behaviour Research, Lucerne.
Holguín-Veras, J., Thorson, E. (2003a). Modeling commercial vehicle empty trips with a first order trip chain model. Transportation Research Part B 37 (2003), Vol. 37 (2), 129-148.
Holguín-Veras, J., Thorson, E. (2003b). Practical implications of modelling commercial vehicle empty trip.,Transportation Research Record 1833, 87-94.
Holguin-Veras, J, et al. (2001). An assessment of methodological alternatives for a regional freight model, Appendix I: literature review on freight transportation demand modelling. New York Metropolitan Transportation Council Report, New York, NY. Retrieved from
Holguín-Veras J., Thorson E. (2000). Trip length distributions in commodity-based and trip-based freight demand modelling: investigation of relationships. Transportation Research Record No.1707, 37– 48.
114
Kreutzberger, E., Macharis, C., Woxenius, J. (2006a). Intermodal versus unimodal road freight transport. In Jourquin, B., Rietveld, P., Westin, K. (2006). Towards Better Performing Transport Networks (17– 42), Routledge, Oxon.
Kreutzberger, E., Konings, R., Aronson, L. D. (2006b). Evaluation of the cost performance of pre- and post-haulage in intermodal freight networks: analysis of the interaction of production models and demand characteristics. In Jourquin, B., Rietveld, P., Westin, K. (2006). Towards Better Performing Transport Networks (256 – 284), Routledge, Oxon.
Kreutzberger, E., Macharis, C,, Vereecken, L., Woxenius, J. (2003). Is intermodal freight transport more environmentally friendly than all-road freight transport? A Review, NECTAR Conference No 7,
Umeå, Sweden, June 13-15, 2003.
Lem, L.L. (2002). Promoting Economic Development by Improving Transportation Infrastructure for Goods Movement, U.S. Economic Dev. Administration, USA.
Lubis, H.A., Isnaeni, M., Sjafruddin, A., Dharmowijoyo, D. (2005). Multimodal transport in Indonesia: recent profile and strategy development. Proceedings of the Eastern Asia Society for Transportation Studies, Vol. 5, 46 – 64.
Ortuzar, J. D., Willumsen, L.G. (1994). Modelling Transport, John Willey and Sons, U.K.
Office of Public Works of Central Kalimantan Province. (2006). Sinergi antara transportasi jalan dan sungai di Kalimantan Tengah menuju sistem berkelanjutan, Palangka Raya.
Provincial Development Planning Agency of Central Kalimantan. (2009). Rencana Umum Tata Ruang Kawasan dan Kota Provinsi Kalimantan Tengah, Palangka Raya.
Rodrigue, J.P., Slack, B., Comtois, C. (2004), Intermodal Transportation. Retrieved from
Simon, D. (1996). Transport and Development in the Third World. Routledge, New York.
Southworth, F. (2002). Freight Transportation Planning: Models and Methods, Book Chapter, K.G. Goulias (Ed) CRC Press, USA.
Stead, D., Banister, D. (2006). In Jourquin, B., Rietveld, P., Westin, K. (2006).Towards Better Performing Transport Networks (136 – 156), Routledge, Oxon.
Tavasszy. (2006). Freight modelling: an overview of international experiences. TRB Conference on Freight Demand Modelling: Tools for Public Sector Decision Making, Washington DC. Retrieved from March 2010).
The Coordinating Ministry for Economic Affairs the Republic of Indonesia. (2009). The 5th Indonesia
Palm Oil Conference and Price Outlook 2010. Retrieved from
115
FIGURE 1. General research frameworkAPPENDIX 1. Conceptual framework
GOVERNMENT REGULATIONS, FINANCE, HUMAN RESOURCES
MANAGEMENT, ETC. REGIONAL ECONOMIC ACTIVITIES (VALUE ADDED
OF PRODUCTION)
PRIVATE
(DESICION MAKER)
PUBLIC
(DESICION MAKER) PRIVATE
(DESICION MAKER)
COMMODITY FLOW BY SPECIFIC TRANSPORTATION MODES AND
OWNERSHIP STATUS
PRIVATE
(DESICION MAKER) PRODUCTION OF GOODS
AND SERVICES
MOVEMENT OF GOODS TRANSPORTATION SERVICES
(COMMODITY FLOW)
COMMODITY FLOW BY TRANSPORTATION MODES
IDENTFICATION OF TYPE AND LOCATION OF TRANSPORT
INFRASTRUCTURES
116
APPENDIX 2. Methodology for regional transportation planning
Socio- Economic Data in the Study Area
Regional Income (RI) Model
(Income= Consumption +Investment + Export- Import)
II. Qualitative Survey on Production and Goods Transportation of Selected Commodities
Production Activities and Flow Movement of Selected Commodities
Spatial Data of Selected Commodities: Resources,
Factories, Outlets
III. Mapping of Spatial Location of Selected Commodities using ArcGIS by Considering the
Shortest Route
Map of Spatial Location of Resource, Factory, and Outlet of Selected Commodities
IV. Transport Modelling of Selected Commodities using FlowMap and ArcGIS
�� =�0+�1 ����+�2 �����+ �3�������
�ℎ���� =�0+�1 ����+�2 �����+ �3�������
����=�0+�1 ���+�2 �����+ �3�������
Utility function of Transportation Cost -1 (TC1)
Utility functions of Transportation Cost -2 (TC2)
����= �����,�+�����,�.��� Selected Commodities in the Region
VI. Identification of Type and Location of Transport Infrastructures
VII. Model calibration &