Indramayu Using Pacific Sea Surface Temperature. Supervised byRIZALDI BOERandRINI HIDAYATI
Agriculture is a very important sector in Indramayu’s economy. Approximately 53.52%
of Indramayu residents are involved in agriculture. Indramayu has 119.752 Ha (58% of the total
area) cultivated as rice fields which generates the majority of the district’s income. Most of the farmers use a traditional cropping method called Pranata Mangsa, which is based on periodic natural events and Primbon, but not climate variability. Climate variability has become a major obstacle to achieving a successful harvest, because it can affect the timing of planting and length of the growing season, which leads to drought and flood vulnerability. The planting date and growing season can be predicted using monthly sea surface temperature (SST) anomalies in Nino 3.4. The August SST anomalies can describe the planting date better than the growing season, which are demonstrated best in Lohbener with R-Sq = 45% with forecast skill reach = 84% and 92% for advanced and delayed planting date. Knowing the planting date and growing season length produces a more efficient cropping calendar, which includes details such as when to prepare the land, plant seeds, and harvest. This cropping calendar is expected to reduce the impacts of climate variability by providing a more efficient cropping pattern and avoiding potential harvest failures.
DANIEL NAEK CHRISENDO
Research report
As one of the requirements to obtain a degree
Bachelor of Science at
Major of Applied Meteorology
DEPARTMENT OF GEOPHYSICS AND METEOROLOGY
FACULTY OF MATHEMATICS AND NATURAL SCIENCES
Pacific Sea Surface Temperature
Name : Daniel Naek Chrisendo
Student ID : G24062058
Approved by,
First Advisor Second Advisor
Prof. Dr. Ir. Rizaldi Boer, M.Sc. Dr. Ir. Rini Hidayati, MS. NIP. 19600927 198903 1 002 NIP. 19600305 198703 2 002
Head of Department of Geophysics and Meteorology Faculty of Mathematics and Natural Sciences
Bogor Agricultural University
Dr. Ir. Rini Hidayati, MS. NIP. 19600305 198703 2 002
Marlin Sitorus. He is the second child of four siblings.
On 2006, he graduated from SMAN 2 Bekasi and later was accepted as a student in Bogor Agricultural University (BAU) through SPMB (Seleksi Penerimaan Mahasiswa Baru). The following year, Daniel was accepted by the Department of Geophysics and Meteorology.
would like to show my high gratitude to my God Father, Jesus Christ, and Holy Spirit. This report is specially dedicated to my family, Papa and Mama, also my greatest sisters and brother, Melissa, Monica, and Davin. I love you.
In this opportunity, many thanks are given for those who that have helped me in this research. To Rizaldi Boer and Rini Hidayati as advisers, and Bregas Budianto. Also to Kusnomo Tamkani as the former Head of Agricultural office in Indramayu and the agricultural extensions that have contributed a huge amount of help in the field and made much of my work easier. Thanks for the wonderful teamwork in the field from Tamara Sitorus, Jessica Rosen, Daniel Huber, Andrea Basche, Suciantini, and everybody else in IMHERE project and CCROM. Also, thanks to Willy Wulansari, Rika Alfiyanti, Sandro Lubis, Rahmi Ariani, Dinda Tri Handayani and friends in the Laboratory of Climatology who gave frequent input to this research. My gratitude is also delivered for all lecturers, staffs, classmates, friends, big families, and organizations that can not be mentioned one by one. The most special thanks is given to the farmers in Indramayu, who already provide one of the basic needs in our lives.
Bogor, March 2011
LIST OF TABLES ... i
LIST OF FIGURES... ii
LIST OF APPENDICES ... iii
I. INTRODUCTION 1.1 Background ... 1
1.2 Objective ... 1
II. LITERATURE REVIEW 2.1 Indramayu ... 1
2.2 Crop in Indramayu ... 2
2.3 Semi Dynamic Cropping Calendar ... 3
2.4 Growing Sesason and Cropping Pattern ... 3
2.5 Field Capacity and Permanent Wilting Point ... 4
2.6 ENSO ... 5
III. RESEARCH METHODS 3.1 Location and Time ... 6
3.2 Tools and Materials... 6
3.3 Methods ... 6
3.3.1 Climate Data Collection and Farmer Interviews... 6
3.3.2 Determining the Observation Area ... 6
3.3.3 Determining the Daily PET ... 7
3.3.4 Calculating the Water Balance... 7
3.3.5 Determining the Planting Date and Growing Season ... 8
3.3.6 Determining the Planting Date and Growing Season Equation Based on August SST Anomalies ... 8
3.3.7 Testing the Forecast Skill Using Relative Operating Characteristics (ROC) 8 3.3.8 Forming the Cropping Calendar Based on August SST Anomalies... 9
IV. RESULT AND DISCUSSION 4.1 Social Data for Indramayu ... 9
4.2 Average Condition of Surplus and Deficit ... 10
4.3 Average Water Balance ... 10
4.4 Planting Date and Growing Season... 11
4.5 Correlation between Planting Date and SST Anomalies... 12
4.6 Correlation between Growing Season and SST Anomalies ... 13
4.7 Forecast Skill ... 14
4.8 Semi Dynamic Cropping Calendar ... 16
V. CONCLUSIONS AND SUGGESTIONS 5.1 Conclusions... 17
5.2 Suggestions ... 17
REFERENCES... 18
LIST OF TABLES
Page
1 Rice Crop Calendar: Planting and Harvesting Seasons in Top Five Producers ... 4
2 Correlation Factor by Latitude... 7
3 Planting date for five clusters in Indramayu 2000-2009 in dekads... 11
4 Growing season for five clusters in Indramayu 2000-2009 in dekads ... 12
LIST OF FIGURES
Page
1 Weather Calendar for Rice ... 2
2 Monthly Rainfall Anomaly Relations during the Dry Season in Kawapante, NTT with SST Anomalies in the Pacific Region (Nino 3.4) ... 5
3 The Polygon of Rainfall Area Distribution... 7
4 ROC Curve ... 9
5 Farmer’s Cropping Pattern... 9
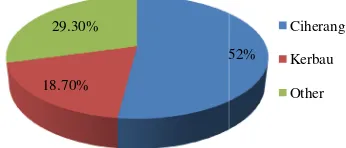
6 Rice Variety that Used by the Farmers ... 9
7 Average Surplus and Deficit Value for 5 Clusters in Indramayu per Dekad ... 10
8 Average soil moisture content for 5 clusters in Indramayu 2000-2009 per dekad... 11
9 Scatterplot of planting date vs SST anomalies for August in Bondan ... 12
10 Scatterplot of planting date vs SST anomalies for August in Bangkir... 12
11 Scatterplot of planting date vs SST anomalies for August in Lohbener.... 12
12 Scatterplot of planting date vs SST anomalies for August in Bulak ... 13
13 Scatterplot of planting date vs SST anomalies for August in Cikedung. ... 13
14 Scatterplot of growing season vs SST anomalies for August in Bondan... 13
15 Scatterplot of growing season vs SST anomalies for August in Bangkir. ... 13
16 Scatterplot of growing season vs SST anomalies for August in Lohbener ... 13
17 Scatterplot of growing season vs SST anomalies for August in Bulak. ... 14
18 Scatterplot of growing season vs SST anomalies for August in Cikedung... 14
19 ROC curve for advanced planting date in Bondan ... 14
20 ROC curve for advanced planting date in Bangkir ... 14
21 ROC curve for advanced planting date in Lohbener... 15
22 ROC curve for advanced planting date in Bulak ... 15
23 ROC curve for advanced planting date in Cikedung ... 15
24 ROC curve for delayed planting date in Bondan ... 15
25 ROC curve for delayed planting date in Bangkir... 15
26 ROC curve for delayed planting date in Lohbener ... 16
27 ROC curve for delayed planting date in Bulak ... 16
28 ROC curve for delayed planting date in Cikedung ... 16
29 Cropping calendar for Lohbener (SST anomaly August = 2) ... 16
30 Cropping calendar for Lohbener (SST anomaly August = 1) ... 16
31 Cropping calendar for Lohbener (SST anomaly August = 0) ... 16
32 Cropping calendar for Lohbener (SST anomaly August = -1)... 17
APPENDICES
Page
1 Research flow chart. ... 21
2 Dekads rainfall pattern in every cluster in Indramayu District. ... 21
3 List of rainfall station in every cluster. ... 22
4 Example of water balance calculation table (Lohbener 2001). ... 23
5 Average surplus and deficit value for Bulak (1979-2009). ... 24
6 Average surplus and deficit value for Bangkir (1979-2009)... 24
7 Average surplus and deficit value for Bondan (1979-2009). ... 25
8 Average surplus and deficit value for Lohbener (1979-2009). ... 25
9 Average surplus and deficit value for Cikedung (1979-2009) ... 26
10 Example of water availability calculation table (Lohbener 2001) ... 27
11 Average water availability for Bulak (1979-2009) ... 28
12 Average water availability for Bondan (1979-2009) ... 28
13 Average water availability for Bangkir (1979-2009)... 29
14 Average water availability for Lohbener (1979-2009) ... 29
15 Average water availability for Cikedung (1979-2009) ... 30
I.INTRODUCTION 1.1 Background
Indramayu is an administrative district in West Java province. According to Bureau of Population and Statistics (BPS) (2009), Indramayu has 31 sub districts which are divided to 313 villages. Most of the citizens get their main income from agriculture. The total number of citizens is 1.732.674 where 927.308 or around 53.52% are involved in agricultural sector. Indramayu has a total land area of 204.011 Ha, with 119.752 Ha (around 58%) being rice fields.
Climate variability is a climate phenomenon which is being concerned at this time because of its big impact to the agricultural sector, also agricultural in Indramayu. According to Koesmaryono et al. (2008), climate variability is the variation of climate element occurring in the certain time, includes climate extreme event.
Climate and weather in Indonesia is often influenced by global phenomenon which happened in tropical Pacific Ocean, most known as Walker Circulation. The disturbance that happened in Walker Circulation is known as ENSO (El Nino Southern Oscillation) phenomenon. Indicator which often used to show the happening of El-Nino phenomenon is the increasing of sea surface temperature anomaly in Pacific or the pressure difference between Tahiti and Darwin excessing its normal condition.
ENSO is a global climate phenomenon which is centered in Pacific Ocean and consist of three fluctuation; normal, El Nino, and La Nina. ENSO directly gives impact to the climate condition especially the rainfall. The rainfall anomaly in Indramayu will cause drought and flood which will give impact to the failure of agricultural activity. The drought which is caused by ENSO will increase the drought plantation area until 8-10 times wider than the normal condition. In the contrary, La Nina increases the flooding plantation area until 4-5 times wider than the normal condition.
Nowadays, farmers in Indonesia use cropping calendar for their agricultural activity. ASA (1976) and FAO (1996) in Koesmaryono et al. (2008) said that
cropping calendar is “a sequential summary
of the dates/periods of essential operations, including land preparation, planting, and harvesting, for a specific land use; it may apply to a specific plot, but is frequently
generalized to characterize a specified area”.
Koesmaryono et al. (2008) said that cropping calendar is one of the agricultural aspects which is often plotted to understand the planting schedule, the plants type in certain area for one year, starting from the period of land preparation, planting, and harvesting.
Traditionally, cropping calendar is also developed by Indonesian farmer long time ago. The Sundanese call Pranata Mangsa, which is needed as the determination or standard for farming. Knowledge about Pranata Mangsa is gotten hereditary which is based on regular natural events. Nowadays, those local wisdoms can not be fully made as reference in determining the planting date because of the changing of some systems and season sign indicator also climate change. Starts from these analysis and thought, it is needed to make an adjustment in growing season and plant rotation, to be more adaptive with the climate change and variability.
The sustainable agriculture needs the changing of cropping calendar, cropping pattern, also plant rotation in every agroecology zone because of the climate change and variability (Viet et al. 2001 in Koesmaryono et al. 2008). Because of this reason, it necessary to review how the existing cropping calendar is based on the happening ENSO. For the agricultural success because of ENSO, it necessary to form the new cropping calendar which figure on ENSO phenomenon.
1.2 Objective
Form a cropping calendar for Indramayu by using the pacific sea surface temperature.
II. LITERATURE REVIEW 2.1. Indramayu
Indramayu is an administrative district in West Java. Geographically, Indramayu is located on 107°52° 108°36°E and 6°15° -6°40°S and topographically, most of the areas are sloping around 0-2%. This condition influences the drainage, if the rainfall quite high, in some certain areas will be excess water. Indramayu is located on the
-10 0 10 20 30 40 50 60 70 80 90 100
semai tanam
anakan aktif
anakan maksimum
pembugaan Panen
Vegetativ Reproduktiv Pemasakan
Kebutuhan air Kritis Penting Cukup penting
Tidak penting
After planting or first fertilizing, the rice field is not irrigated for three days but left saturated. 4 until 14 days after planting, the water is irrigated and gradually inundated until reach 7cm-10cm. 15-30 days after planting, the rice field is flooded until it reaches a height of 3-5 cm. the lack of water in this phase will reduce the number of tillers and the too high pool will inhibit the growth of tillers. 30 days after planting, the water is removed from the field and left saturated. 35-50 days after planting, the field is flooded with the height of 5-10 cm. 50 days after planting, the field is dried up and left saturated. 55 days after planting, the field is flooded with a height of 10 cm, until the flowering period. The lack of water in this phase will weaken the formation of panicle and fertilization and cause the empty grains. After that, water is removed from the field and for 5 days the field is left saturated. The inundation is continued in the height of 10 cm until the grain filled. 15 days before harvesting, the field is dried up (Prasetyo 2002)
2.3 Semi-Dynamic Cropping Calendar
FAO in Koesmaryono (2008) divides the planting pattern of three major parts; the cropping calendar, planting intensity, and planting rotation. Cropping calendar is
defined as “A sequential summary of the
dates/periods of essential operations, including land preparation, planting, and harvesting, for a specific land use; it may apply to a specific plot, but is frequently
generalized to characterize a specified area”.
Cropping calendar is one aspect of agriculture that are often mapped to determine the schedule for planting crops in certain areas during the year, starting from the time of land preparation, crop planting, and harvesting. According to Boer (2002), cropping calendar is a calendar system which shows the urgency level of relation between environment conditions with the plant growth phase. Cropping calendar will shows the needed environment condition in certain phase where the plant become sensitive to that environment condition.
Traditionally, cropping calendar has also been developed by Indonesian farmers. Sundanese called Pranata Mangsa which is required as a determination to grow crops. This knowledge is gained hereditary by the farmers. For thousands of years they memorize the season pattern, climate, and other natural phenomena, and their ancestors
finally make the annual calendar not based on the common calendar or Islam calendar but based on natural occurrences such as, rain season, dry season, flowering season, and the location of stars in the universe, also the influence of the moon against the tides of sea water (Koesmaryono 2008)
This culture is not wrong as long as there is no changing either climate or the landuse. But the global change is happened. Because of that reason, it is important to analyze how the existing cropping calendar can fit to the climate condition after the changing. To maintain the sustainable agriculture because of the climate change, it is needed to make a new cropping calendar, cropping pattern, also planting rotation in every agroecology zone (Vie et al 2001 in Koesmaryono 2008).
2.4 Growing Season and Cropping Pattern
Adjustment of cropping pattern and planting date is a strategic approach to reduce or avoid the impact of climate change due to a shift in growing season and changes in rainfall patterns. According to FAO (1978) in Saleh (2007), growing season is a lapse of time in a year with rainfall more than 0.5 PET added by time at the end of rainy season (rainfall close to 0.5 PET) to evaporate 100mm of stored ground water. The water level between field capacity and permanent wilting point is often referred to as effective moisture for crop planting or optimum water content (Sosrodarsono dan Takeda 1978). For that reason, the water level on that range is used as the determination of crop growing season.
According to Heryani (2001), planting date and growing season is determined based on the availability of soil moisture. Soil moisture is the water that is bound by forces, such as matrix-belt force, osmosis, and capillary. Growing season period is periods where soil moisture content is are not less than 50% of available water. This is according to Richard (1969) in Perdana (1995) that said to get good plant growth, water should be added if 50-80% of water available has been used up. Oldeman stated that rainfall equal or more than 200mm per month can be used as determination of rice growing season, while for secondary crop, is based on rainfall equal or more than 100 mm per month.
-50 0 50 100
-2 -1 0 1 2 3
ASMLBK
A
CHB
K
anomaly for warm (El Niño) events and at or below the -0.5 anomaly for cold (La Niña) events. The threshold is further broken down into Weak (with a 0.5 to 0.9 SST anomaly), Moderate (1.0 to 1.4) and Strong (≥ 1.5) events. For the purpose of this report for an event to be weak, moderate or strong it much have equaled or exceeded the threshold for at least three months. (http://www.cpc.noaa.gov)
The size of the impact caused by the El-Nino phenomenon in the area of rice plantation is closely associated with farmers' cropping patterns and behaviors in Java (Boer dan Meinke, 2002). General cropping pattern followed by farmers in Java are rice-rice-rice or rice-rice-rice-fallow. The first rice is planted in rainy season, around November or December, the second rice planted in the beginning of dry season, around March or April, and the third rice planted around June or July. Drought-affected rice is usually that grown in dry season. In 1991/1992, most farmers finished the planting when the drought came and make the harvest failure. In the contrary, in 1997/1998 because of the formation of El-Nino was very fast and happened in the beginning of dry season, made rain in the dry season is not available so many farmers do not dare to do the planting. As the result, drought-affected area becomes less. Commonly, on the dry season plantation, farmer usually plants the rice if
impending the long drought (no rain) hasn’t
been detected, in the contrary of El-Nino 1997/1998.
III.RESEARCH METHODS 3.1 Location and Time
This research was conducted in the Climatology Laboratory, Department of Geophysics and Meteorology, Bogor Agricultural University, Center of Climate Risk and Opportunity Management in South East Asia and Pacific (CCROM-SEAP), and in Indramayu District, from February until October 2010.
3.2 Tools and Materials
Tools used in this research were: 1. Microsoft Office Word XP 2007 for
documentation, reporting, and
information publication.
2. Microsoft Office Excel XP 2007 for statistical analysis.
3. Minitab 14 and Crystal Ball 7.31 for statistical analysis.
Materials used in this research were: 1. Dekad rainfall data for Bangkir, Bulak,
Bondan, Lohbener, and Cikedung sub-districts from 1979-2009.
2. Dekad temperature data for Pusakanegara, Subang from 1979-2009. 3. SST anomalies data in Nino 3.4 for
August from 1979-2009
4. Permanent wilting point and field capacity for Indramayu
5. Social Data for Indramayu 6. Map of Indramayu
3.3 Methods
3.3.1 Climate Data Collection and Farmer Interviews
Preparation for this research began with gathering the rainfall data for Indramayu from 1979-2009, temperature data for Subang from 1979-2009, monthly sea surface temperature (SST) anomalies for August from 1979-2009.
The rainfall data was obtained from the Water Management Agency for Indramayu. There are no weather stations in Indramayu that measures the temperature, so temperature data for Subang District from the Indonesian Agroclimate and Hydrology Research Institute, Bogor, was used with the assumption that Subang and Indramayu have the same elevation and are close geographically which makes the temperature data for Subang valid for Indramayu. The August SST anomalies in Nino 3.4 were obtained from the International Research
Institute website
(http://iridl.ldeo.columbia.edu). The August SST anomalies were used because August is the best and the possible closest time to predict the planting date which is often conducted on October, November, and December. The permanent wilting point and the field capacity are 210 mm and 350 mm respectively (Pawitan et al. 1997)
Interviews with farmers were conducted in three sub districts in Indramyu; Lelea, Cikedung and Trisi, with a total of 150 farmers interviewed.
3.3.2 Determining the Observation Area
6 7
Jan 1.06 1.07 Feb 0.95 0.96 M ar 1.04 1.04
A pr 1 1
M ay 1.02 1.02 Jun 0.99 0.98 Jul 1.02 1.02 A ug 1.03 1.03
Sep 1 1
O ct 1.05 1.05 N ov 1.03 1.04 D ec 1.06 1.07
miss: forecast said the event w happen and it does happen
Interval values ranged fro as the perfect score.
4. Calculating the FAR (PO of false detection)
where,
false alarm: forecasts said th happen and it does not happen correct negative: forecasts would not happen, and it r happen
Interval values ranged fro with zero as the perfect score. 5. Plotting the FAR vs HR ta
curve
Figure 4 ROC curve (Ka
From figure 4 can be explaine 1. If the line coincide with line, it means that there is 2. If the line is above the n means positive skill (reliab 3. If the line is below the n
means negative skill (non-4. Reliability score is the a curve line. Number of squ curve line is divided squares, known as the sco
3.3.8 Forming the Croppin Based on August SST
The cropping calendar based on the SST anomalies cropping calendar shows the time to prepare the land and
table into ROC
(Kadarsah 2009) lies. The resulting the recommended nd seeds, planting and harvesting. est plant type to
IV. RESULT AND DISC 4.1 Social Data for Indramayu
The cropping patterns th conducted by the farmers are e figure 5.
Figure 5 Farmer’s cropping
Based on the interviews conducted in Indramayu, 82.6 farmers plant rice during th growing season and they leave fallow during the third season can be attributed to supe availability from rainfall during second seasons. As a resu diminishing water availability, respondents plant rice only dur growing season and leave the fallow for the remainder of th However, approximately 6% respondents take the risk secondary crop during the third greenbean, chili, cucumber, cabbage, and soybean. Accord Indramayu farmer respondents, seed preparation usually condu the three dekads prior to the plan The rice varieties that usua the farmers can be seen by figure
Figure 6 Rice variety that use farmers ng the first and esult of this
Rice - Rice -Fallow
Rice - Fallow - Fallow
Rice Secondary Crop -Fallow
52%
Ciherang
Kerbau
-40 -20 0 20 40 60 80
1 4 7 10 13 16 19 22 25 28 31 34
S
u
rp
lu
s
-D
e
fi
ci
t
(m
m
)
Dekad
Surplus
0
Bondan Bangkir Lohbener Bulak Cikedung Average
y = -1.4473x + 20.302 R² = 0.0444
0 5 10 15 20 25 30
-2 -1 0 1 2 3
y = -0.7415x + 21.438 R² = 0.0137 0
5 10 15 20 25 30 35 40
-2 -1 0 1 2 3
Cluster Planting Date Growing Season
Bondan y = 1,9298x + 30,608 y = -1,3412x + 21,682
Bangkir y = 2,0628x + 30,772 y = -1,224x + 22,227
Lohbener y = 2,5485x + 31,125 y = -2,1094x + 21,392
Bulak y = 1,9081x + 30,288 y = -1,4473x + 20,302
Cikedung y = 1,9563x + 30,117 y = -0,7415x + 21,438
0.000 0.200 0.400 0.600 0.800 1.000
0.000 0.200 0.400 0.600 0.800 1.000
0.000 0.200 0.400 0.600 0.800 1.000
0.000 0.200 0.400 0.600 0.800 1.000
0.000 0.200 0.400 0.600 0.800 1.000
0.000 0.200 0.400 0.600 0.800 1.000
0.000 0.200 0.400 0.600 0.800 1.000
0.000 0.200 0.400 0.600 0.800 1.000
0.000 0.200 0.400 0.600 0.800 1.000
0.000 0.200 0.400 0.600 0.800 1.000
0.000 0.200 0.400 0.600 0.800 1.000
0.000 0.200 0.400 0.600 0.800 1.000
0.000 0.200 0.400 0.600 0.800 1.000
0.000 0.200 0.400 0.600 0.800 1.000
0.000 0.200 0.400 0.600 0.800 1.000
0.000 0.200 0.400 0.600 0.800 1.000
0.000 0.200 0.400 0.600 0.800 1.000
0.000 0.200 0.400 0.600 0.800 1.000
22 23 24 25 26 27 28 29 30 31 32 33 34 35 36 1 2 3 4 5 6 7 8 9 10 11 12 13 14 15 16 17 18 19 20 21 Dekad
22 23 24 25 26 27 28 29 30 31 32 33 34 35 36 1 2 3 4 5 6 7 8 9 10 11 12 13 14 15 16 17 18 19 20 21 Dekad
22 23 24 25 26 27 28 29 30 31 32 33 34 35 36 1 2 3 4 5 6 7 8 9 10 11 12 13 14 15 16 17 18 19 20 21 Dekad
22 23 24 25 26 27 28 29 30 31 32 33 34 35 36 1 2 3 4 5 6 7 8 9 10 11 12 13 14 15 16 17 18 19 20 21 Dekad
5.2 Suggestions
Further research is expected to gain a more complete cropping calendar with more complete inputs in the model. Those can be reached if all aspects of the society take the role in make it success. The government and agencies are expected to provide more complete information such rainfall, temperature, and others. Also they should have the desire to spread the information and teach the farmers about the cropping calendar. The farmers are expected to give data about the agricultural more accurate and realistic. Other predictors beside SST anomaly in pacific also needed to make the cropping calendar fitter to the real condition, i.e. IOD which also influence the cropping time in Indramayu and has the opposite effect with the pacific SST anomaly. The future researcher are expected to enter more inputs and considering other aspects such productivity, field are, harvest, and others. All of these are needed to make this cropping calendar better in order to help the farmers for successful farming.
REFERENCES
[NOAA]. National Oceanic and Atmospheric Administration. 2010. Sea Surface Temperature.
http://www.cpc.noaa.gov/data/indices/sst oi.indices. [11 April 2010]
[IRI]. International Research Institute. 2010. NOAA NCDC ERSST version3b sst 0.0 meters Data Files. +datafiles [9 November 2010]
BPS. 2009. Indramayu dalam Angka Tahun 2008. Indramayu: BPS.
Boer R, Arianto MA, Las I and Notodiputro KA. 1999. Keragaman Produksi Kedelai pada Kondisi Iklim Ekstrim di Flores-NTT. Seminar Proceedings Climate Variability. BPPT (In Press).
Boer R. 2002. Analisis Risiko Iklim untuk Produksi Pertanian. Paper presented in Sumatra and Kalimantan University Lecturer Workshop in Agricultural and
Environmental Modeling and
Simulation. Bogor, July 1-13 2002.
Boer R and Meinke. 2002. Pertumbuhan Tanaman dan IOS. In Kapan akan hujan?: Pengaruh ENSO di Indonesia. Queensland: Department of Primary Industry.
Boer R. 2003. Fenomena Enso dan Hubungannya dengan Keragaman Hujan di Indonesia. Paper. Laboratory of Climatology, Department of Geophysics and Meteorology, Faculty of Mathematics and Natural Sciences, Bogor Agricultural University.
Boer R. 2003. Penyimpangan Iklim di Indonesia. Paper presented in Soil Science National Seminar with theme Alternative Strategy in Solving the Climate Variability and the Implication to the Land Use and National Food Security, University of Gadjah Mada, May 24 2003.
Boer R. 2006. Metode untuk Mengevaluasi Keandalan Model Prakiraan Musim. Paper presented in Downscaling Model
Training, Meteorological,
Climatological, and Geophysics Agency, Jakarta, September 16-18, 2006.
Haryoko U. 2008. Pewilayahan Hujan untuk Menentukan Pola Hujan (Contoh Kasus Kabupaten Indramayu). Jakarta: BMKG.
Heryani N, Pramudia A, Susanti E. 2001. Pendugaan Potensi Masa Tanam di Sulawesi Selatan Berdasarkan Analisis Neraca Air Tanah. In Reorientasi Pendayagunaan Sumberdaya Tanah, Iklim, dan Pupuk. National Seminar Proceedings. Bogor: The Indonesian Soil and Hydrology Research Institute
Kadarsah. 2009. Uji Kehandalan Model Predeiksi dengan Menggunakan ROC (Relative Operating Characteristics). http://kadarsah.wordpress.com/2009/04/0 2/uji-kehandalan-model-prediksi-dengan -menggunakan-rocrelative-operating-cha racteristics/ [23 February 2011]
Narapusetty B, Delsole T, and Tippett K. 2010. Optimal Estimation of the Climatological Mean. Calverton: Center for Ocean Land Atmospheric Studies.
Pawitan H, Las I, Suharsono H, Boer R, Handoko, Baharsjah J. 1997. Implementasi Pendekatan Strategis dan Taktis Gerakan Hemat Air. In Sumber Daya Air dan Iklim dalam Mewujudkan Pertanian Efisien. Jakarta: Departemen Pertanian.
Perdana S. 1995. Analisis Neraca Air Lahan untuk Menetukan Pola Tanam dan Periode Tanam Tanaman Padi dan Palawija di Pulau Sumbawa. Bogor: Faculty of Mathematics and Natural Sciences, Bogor Agricultural University.
Prasetyo Y. 2002. Budi Daya Padi Sawah TOT (Tanpa Olah Tanah). Yogyakarta: Kanisius.
Rathi A. 2008. Rice Widely Cultivated Staple Grain. New Delhi: Commodity Watch.
Saleh E. 2007. Pola Panen Padi – Palawija di Daerah Irigasi Komering, Oku Timur Sumatera Selatan. Palembang: Faculty of Agriculture, Sriwijaya University.
Siregar H. 1989. Budidaya Tanaman Padi di Indonesia. Jakarta: Sastra Hudaya.
Sosrodarsono S and Takeda. 1978. Hidrologi Untuk Pengairan. Yogyakarta: Pradnya Paramita.
Tawang A, Ahmad TA, and Abdullah MY. 2002. Stabilization of Upland Agriculture under El Nino Induced Climate Risk: Impact Assessment and Mitigation Measures in Malaysia. Bogor: CGPRT Centre.
Appendices 1 Research flow
Appendices 2 Dekads rainfall w chart
-40 -20 0 20 40 60 80 100
1 3 5 7 9 11 13 15 17 19 21 23 25 27 29 31 33 35
S
ur
pl
u
s
-De
fi
c
it
(
m
m
)
Dekad
Surplus
Deficit
-40 -20 0 20 40 60 80 100
1 3 5 7 9 11 13 15 17 19 21 23 25 27 29 31 33 35
S
u
rp
lu
s
-D
e
fi
ci
t
(m
m
)
Dekad
Surplus
-60 -40 -20 0 20 40 60 80
1 3 5 7 9 11 13 15 17 19 21 23 25 27 29 31 33 35
S
u
rp
lu
s
-D
e
fi
ci
t
(m
m
)
Dekad
Surplus
Month Dekad FC PWP WHC SMC SMC-WHC
1 350 210 280 315 35
2 350 210 280 280 0
3 350 210 280 350 70
4 350 210 280 308 28
5 350 210 280 350 70
6 350 210 280 319 39
7 350 210 280 279 -1
8 350 210 280 350 70
9 350 210 280 333 53
10 350 210 280 350 70
11 350 210 280 317 37
12 350 210 280 277 -3
13 350 210 280 242 -38
14 350 210 280 221 -59
15 350 210 280 207 -73
16 350 210 280 190 -90
17 350 210 280 187 -93
18 350 210 280 172 -108
19 350 210 280 150 -130
20 350 210 280 131 -149
21 350 210 280 113 -167
22 350 210 280 98 -182
23 350 210 280 86 -194
24 350 210 280 74 -206
25 350 210 280 72 -208
26 350 210 280 63 -217
27 350 210 280 55 -225
28 350 210 280 48 -232
29 350 210 280 42 -238
30 350 210 280 36 -244
31 350 210 280 33 -247
32 350 210 280 350 70
33 350 210 280 350 70
34 350 210 280 350 70
35 350 210 280 350 70
36 350 210 280 313 33
May Jan
Feb
Mar
Apr
Dec Jun
Jul
Aug
Sep
Oct
0 50 100 150 200 250 300 350 400
1 3 5 7 9 11 13 15 17 19 21 23 25 27 29 31 33 35
K
o
lo
m
a
ir
(
m
m
)
Dekad
KAT
KL
TLP
WHC
0 50 100 150 200 250 300 350 400
1 3 5 7 9 11 13 15 17 19 21 23 25 27 29 31 33 35
K
o
lo
m
a
ir
(
m
m
)
Dekad
KAT
KL
TLP
0 50 100 150 200 250 300 350 400
1 3 5 7 9 11 13 15 17 19 21 23 25 27 29 31 33 35
K
o
lo
m
a
ir
(
m
m
)
Dekad
KAT
KL
TLP
WHC
0 50 100 150 200 250 300 350 400
1 3 5 7 9 11 13 15 17 19 21 23 25 27 29 31 33 35
K
o
lo
m
a
ir
(
m
m
)
Dekad
KAT
KL
TLP
0 50 100 150 200 250 300 350 400
1 3 5 7 9 11 13 15 17 19 21 23 25 27 29 31 33 35
K
o
lo
m
a
ir
(
m
m
)
Dekad
KAT
KL
TLP
20 10
Event A Event B Not Event TA Not Event TB
12 0 10 9 11 0 17 3
AA A-TA TA-A TA-TA BB B-TB TB-B TB-TB
HR 1.00 FAR 0.53 HR 1.00 FAR 0.85
Delayed Normal Advanced CAR 0.55 MR 0 CAR 0.39 MR 0
Tahun Obs Sim B N A Obs Sim AA A-TA TA-A TA-TA Obs Sim BB B-TB TB-B TB-TB 1979 A N 28 26 41 A A 1 0 0 0 TB B 0 0 1 0 1980 N A 20 25 50 TA A 0 0 1 0 TB B 0 0 1 0 1981 A A 11 19 66 A A 1 0 0 0 TB B 0 0 1 0 1982 B B 65 18 11 TA TA 0 0 0 1 B B 1 0 0 0 1983 A A 18 23 53 A A 1 0 0 0 TB B 0 0 1 0 1984 A A 22 23 50 A A 1 0 0 0 TB B 0 0 1 0 1985 A A 11 18 65 A A 1 0 0 0 TB B 0 0 1 0 1986 N N 46 27 21 TA A 0 0 1 0 TB B 0 0 1 0 1987 B B 91 5 1 TA TA 0 0 0 1 B B 1 0 0 0 1988 A A 3 8 87 A A 1 0 0 0 TB TB 0 0 0 1 1989 N A 15 25 55 TA A 0 0 1 0 TB B 0 0 1 0 1990 B N 45 25 25 TA A 0 0 1 0 B B 1 0 0 0 1991 N B 69 17 10 TA TA 0 0 0 1 TB B 0 0 1 0 1992 A N 35 26 34 A A 1 0 0 0 TB B 0 0 1 0 1993 N N 37 27 31 TA A 0 0 1 0 TB B 0 0 1 0 1994 B B 54 23 17 TA TA 0 0 0 1 B B 1 0 0 0 1995 A A 14 24 57 A A 1 0 0 0 TB B 0 0 1 0 1996 A N 25 26 43 A A 1 0 0 0 TB B 0 0 1 0 1997 B B 94 4 1 TA TA 0 0 0 1 B B 1 0 0 0 1998 A A 5 11 79 A A 1 0 0 0 TB TB 0 0 0 1 1999 A A 3 10 83 A A 1 0 0 0 TB TB 0 0 0 1 2000 A A 15 23 56 A A 1 0 0 0 TB B 0 0 1 0 2001 N N 33 27 34 TA A 0 0 1 0 TB B 0 0 1 0 2002 B B 69 17 9 TA TA 0 0 0 1 B B 1 0 0 0 2003 N B 49 25 20 TA TA 0 0 0 1 TB B 0 0 1 0 2004 B B 367 15 11 TA TA 0 0 0 1 B B 1 0 0 0 2005 B N 40 26 27 TA A 0 0 1 0 B B 1 0 0 0 2006 B B 48 26 23 TA A 0 0 1 0 B B 1 0 0 0 2007 N A 14 23 58 TA A 0 0 1 0 TB B 0 0 1 0 2008 B A 29 25 41 TA A 0 0 1 0 B B 1 0 0 0 2009 B B 59 22 14 TA TA 0 0 0 1 B B 1 0 0 0
DATA INPUT
ATAS NORMAL (AN) BAWAH NORMAL (BN) Threshold Value Threshold Value
OUTPUT OUTPUT