Research Article
Analysis of Flavonoid in Medicinal Plant Extract Using Infrared
Spectroscopy and Chemometrics
Lestyo Wulandari, Yuni Retnaningtyas, Nuri, and Hilmia Lukman
Faculty of Pharmacy, University of Jember, Jember, East Java 68121, Indonesia
Correspondence should be addressed to Lestyo Wulandari; wulan.farmasi@unej.ac.id
Received 2 March 2016; Revised 7 June 2016; Accepted 20 June 2016
Academic Editor: Karoly Heberger
Copyright © 2016 Lestyo Wulandari et al. his is an open access article distributed under the Creative Commons Attribution License, which permits unrestricted use, distribution, and reproduction in any medium, provided the original work is properly cited.
Infrared (IR) spectroscopy combined with chemometrics has been developed for simple analysis of lavonoid in the medicinal plant extract. Flavonoid was extracted from medicinal plant leaves by ultrasonication and maceration. IR spectra of selected medicinal plant extract were correlated with lavonoid content using chemometrics. he chemometric method used for calibration analysis was Partial Last Square (PLS) and the methods used for classiication analysis were Linear Discriminant Analysis (LDA), Sot Independent Modelling of Class Analogies (SIMCA), and Support Vector Machines (SVM). In this study, the calibration of NIR model that showed best calibration with�2 and RMSEC value was 0.9916499 and 2.1521897, respectively, while the accuracy of all classiication models (LDA, SIMCA, and SVM) was 100%.�2and RMSEC of calibration of FTIR model were 0.8653689 and 8.8958149, respectively, while the accuracy of LDA, SIMCA, and SVM was 86.0%, 91.2%, and 77.3%, respectively. PLS and LDA of NIR models were further used to predict unknown lavonoid content in commercial samples. Using these models, the signiicance of lavonoid content that has been measured by NIR and UV-Vis spectrophotometry was evaluated with paired samples�-test. he lavonoid content that has been measured with both methods gave no signiicant diference.
1. Introduction
Indonesia shows an amazing diversity of plants species that have been associated with the human health from time immemorial. Many of them were reported to have various desirable activities; however, only 20–22% were cultivated [1]. Research of Indonesian medicinal plants using modern laboratory facilities has been started since 1970, but only about 200 plants were studied. his igure shows a very small portion of the overall number of medicinal plant species that were reported [2]. herefore, the analysis of chemical constituents would help in determining various biological activities of plants.
Studies have shown that many plants have chemical components and biological activities. he most important of these bioactive constituents of plant are alkaloids, lavonoids, terpenoids, steroids, tannins, and saponins [3]. Flavonoids are the most common and widely distributed group of plant phenolic compounds, occurring virtually in all plant parts, particularly the photosynthesising plant cells [4]. Flavonoids
have been reported to exert multiple biological efects, including antioxidant, free radical scavenging abilities, anti-inlammatory, and anticarcinogen [5].
Several analytical techniques have been developed for determining total lavonoids concentration such as gas chro-matographic (GC) [6], mass spectrometry [7], thin layer chromatography [8], UV spectrometry [9], and high perfor-mance liquid chromatography (HPLC) [10]. hese methods are precise but all time-consuming, requiring many reagents, and costly [11]. herefore, a simple, selective, and ecofriendly method is required.
Infrared spectroscopy is a technique based on the vibra-tions of the atoms of a molecule. he advantage of the infrared technique is that it can be nondestructive, requires a relatively small amount of sample, is fast, and is accurate [11, 12]. Infrared technique does not require a reagent, so this method is more ecofriendly. It has been proved to be a powerful analytical tool used in many ields [12]. In recent years, NIR combined with chemometrics has attracted considerable attention in chemical content analysis [13]. NIR
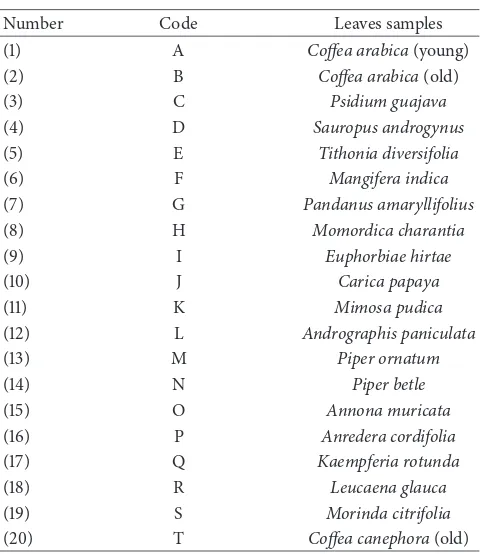
Table 1: Identity code of samples.
Number Code Leaves samples
(1) A Cofea arabica(young)
(2) B Cofea arabica(old)
(3) C Psidium guajava
(4) D Sauropus androgynus
(5) E Tithonia diversifolia
(6) F Mangifera indica
(7) G Pandanus amaryllifolius
(8) H Momordica charantia
(9) I Euphorbiae hirtae
(10) J Carica papaya
(11) K Mimosa pudica
(12) L Andrographis paniculata
(13) M Piper ornatum
(14) N Piper betle
(15) O Annona muricata
(16) P Anredera cordifolia
(17) Q Kaempferia rotunda
(18) R Leucaena glauca
(19) S Morinda citrifolia
(20) T Cofea canephora(old)
spectroscopy also shows promising ability for discrimination of similar biological materials, such as pea [14], fruits [15], and wine [16]. Some papers have been published regarding NIR quantitative analysis of active compound concentration in herbal products [17].
Multivariate statistical methods are very useful for pro-cessing of IR spectra. he big advantage of multivariate statistical methods is their capability to extract the informa-tion of IR spectra and explore this spectral informainforma-tion for qualitative or quantitative applications. he most frequently used of multivariate statistical methods (oten called chemo-metric methods) are Linear Discriminant Analysis (LDA) and Partial Least Squares (PLS) regression [18].
he objective of this research is to develop a simple, rapid, and validated model of IR spectra for the determina-tion of the lavonoid content. Furthermore, IR spectroscopy and chemometric methods were applied for determining lavonoid content in commercial samples.
2. Materials and Methods
2.1. Material and Reagents. In this study, samples used were leaves samples collected from Materia Medica Botanical Gar-den, Malang, Indonesia (Table 1). Methanol, ethanol, Folin-Ciocalteu, potassium acetate (E. Merck, Darmstadt, Ger-many), and quercetin (Sigma-Aldrich) were of analytical grade reagent. Aquadest and Aerosil were of pharmaceutical grade. he solvents were used without further puriication. Commercial extract capsules, Stimuno® and Daun Salam®, were purchased from a local pharmacy in Jember, East Java, Indonesia (October 2015).
2.2. Extraction Methods. Dry leaves samples were mixed and inely powdered. 80.0 g of powdered sample was extracted with 800 mL of methanol in an ultrasonicator for an hour and continued being extracted by maceration for 24 hours. he extract was iltered through Whatman ilter paper and then the solvent was evaporated using a rotavapour at 60∘C. Extract was dried using Aerosil to yield dry extract.
2.3. NIR Spectra Acquisition. Samples were scanned with a Brimrose, Luminar 3070 (Brimrose Corp, Baltimore, MD), with an integrating sphere. Before samples were measured, the instrument was warmed up for 30 minutes. he mono-chromator entrance slit was set on 500 pm, the ampliier was set on 200. the response time is smooth (1 ms), and light intensity was set on 14 volts. he wavelength range of spectra is from 8500–2000 nm and the data were measured in 5 nm intervals, which resulted in 120 points relection.
2.4. FTIR Spectra Acquisition. FTIR spectrometer (Alpha FTIR Spectrometer from Bruker optic), equipped with a deuterated triglycine sulphate (DTGS) as a detector and a ger-manium as beam splitter, interfaced to computer operating under Windows-based system, and connected to sotware of OPUS operating system (Version 7.0 Bruker optic), was used during FTIR spectra acquisition. A few drops of each sample were positioned in contact with attenuated total relectance (ATR) plate.
FTIR spectra were collected at frequency regions of 4000– 650 cm−1by coadding 32 scans and at resolution of 4 cm−1. All spectra were substracted against a background of air spectra. Ater every scan, a new reference of air background spectra was taken. he ATR plate was carefully cleaned by scrubbing with isopropyl 70% twice followed by drying with sot tissue before being illed in with the next sample, making it possible to dry the ATR plate. hese spectra were recorded as absorbance values at each data point in replicate two times.
2.5. Determination of Total Flavonoids Content. he lavon-oids content was determined by aluminum chloride method using quercetin as a reference compound [19]. Sample was prepared by mixing 0.5 mL of 4 mg/mL sample extract in ethanol with 3 mL of ethanol, 0.2 mL of 10% aluminum chloride, and 0.2 mL of 1 M potassium acetate and then diluted to 25 mL with distilled water. Ater incubation at room temperature for 30 min, the absorbance of the mixture solution was measured at 432 nm using spectrophotometer (UV-Vis Hitachi U 1800). Various standard solutions of quer-cetin (2.0 up to 15.0�g/mL) were prepared from two stock solutions by dilution with ethanol.
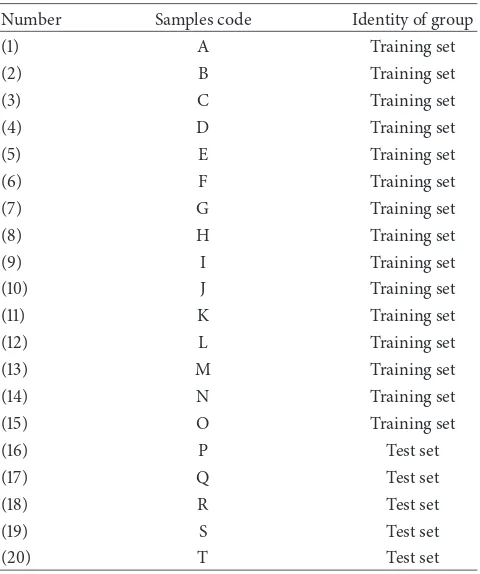
Table 2: Training set and test set samples.
Number Samples code Identity of group
(1) A Training set
(2) B Training set
(3) C Training set
(4) D Training set
(5) E Training set
(6) F Training set
(7) G Training set
(8) H Training set
(9) I Training set
(10) J Training set
(11) K Training set
(12) L Training set
(13) M Training set
(14) N Training set
(15) O Training set
(16) P Test set
(17) Q Test set
(18) R Test set
(19) S Test set
(20) T Test set
expected to represent variations of lavonoid content of all plants. he Linear Discriminant Analysis (LDA), Sot Inde-pendent Modelling of Class Analogies (SIMCA), and Support Vector Machines (SVM) were used to develop classiication model. hese models were using two kinds of category, matrix and lavonoid. Matrix category was sample without lavonoids content (Aquadest and Aerosil) and lavonoid cat-egory was sample with lavonoid content (leaves extracts and quercetin). Partial Least Square (PLS) was used to develop calibration model for total lavonoids content. he PLS model was then validated with leave-one-out cross-validation (LOOCV) and 2-fold cross-validation (ive test set samples). he training set and test set samples were shown in Table 2.
3. Result and Discussion
3.1. Total Flavonoids Content. he results for total lavonoids content in samples are presented in Table 3. he total la-vonoids measurements were distributed around 4.03 up to 51.49 mg quercetin equivalence (QE)/g extract.
3.2. Calibration and Classiication Models
3.2.1. Calibration and Classiication of NIR Models. Figure 1 showed NIR spectra of quercetin, dry extract, Aquadest, and Aerosil. hose spectra have a diferent intensity and typical characteristic of absorption bands. In the PLS calibration models, the evaluation of the linearity method was carried out in order to show a proportional relationship between the absorbance of NIR spectra versus the concentrations
Table 3: Total lavonoids content in samples.
Number Samples code mg QE/g extract±SD
(1) A 9.87±0.25
850 1080 1350 1620 1890
(nm)
Figure 1: NIR spectra of quercetin (a), dry extract (b), Aquadest (c), and Aerosil (d).
of lavonoid. he absorbance data of all training set were obtained at 850–2000 nm. he correlation data of PLS model in Figure 2 showed good performance of PLS model, indi-cated by coeicient of determination (�2) higher than 0.99 and the low value of RMSEC [20].�2 and the root mean square error of calibration (RMSEC) were 0.9916499 and 2.1521897, respectively. herefore the calibration model can be used as a tool to predict the concentration of lavonoid content in medicinal plant.
Predicted versus reference
ReferenceY(C1, factor-7)
R2
Figure 2: he correlation data of PLS (NIR model).
Elements:
Figure 3: he leave-one-out cross-validation (LOOCV) of PLS (NIR model).
Figure 4: 2-fold cross-validation of PLS (NIR model).
used. LOOCV was performed as follows: one sample was let out from the calibration set, a model was built with the remaining samples in the calibration set, then the let-out sample was predicted by this model, and the procedure was repeated by leaving out each sample in the calibration set.
�2 and the root mean square error of prediction (RMSEP) of LOOCV were 0.9986664 and 0.9136531, respectively (Fig-ure 3).
Twofold cross-validation was used to validate the devel-oped model using independent samples (test set). Five medic-inal plant extracts were used as test set.�2and RMSEP were 0.9823225 and 2.6224468, respectively (Figure 4).
Table 4: he accuracy of classiication of NIR model (LDA, SIMCA, and SVM).
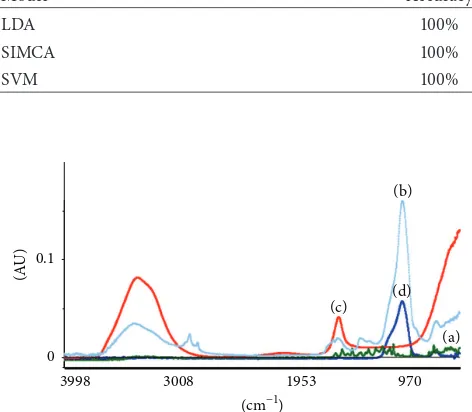
3998 3008 1953 970
(d)
Figure 5: FTIR spectra of quercetin (a), dry extract (b), Aquadest (c), and Aerosil (d).
he ability of NIR model (LDA, SIMCA, and SVM) to classify samples in lavonoid and matrix category can be seen through the accuracy of classiication models. Table 4 shows 100% of accuracy, which means that the model could classify iteen training set samples in a correct category.
3.2.2. Calibration and Classiication of FTIR Models. Figure 5 showed FTIR spectra of quercetin, dry extract, Aquadest, and Aerosil. hose spectra have similar intensity and character-istic of absorption bands in some segment of wavenumber. he results obtained from the PLS in terms of�2, RMSEC for normal spectra, and segmentation were presented in Table 5. PLS calibrations in segment C (1650–1400 cm−1) revealed the highest of�2and the lowest of RMSEC compared with other segments (Table 5).�2and RMSEC were 0.8653689 and 8.8958149, respectively. However, this result was not good due to the fact that�2was less than 0.99 and RMSEC was high.
he ability of FTIR model (LDA, SIMCA, and SVM) was less than 100%, which means that the model could not classify iteen training set samples in a correct category (Table 6).
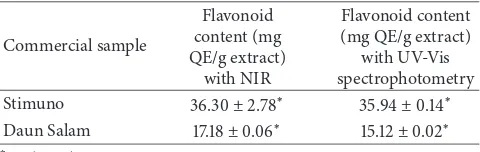
3.3. Application of Commercial Samples. PLS and LDA devel-oped models of NIR spectra were further used to predict lavonoid in commercial samples. he results of lavonoids content in samples measured by NIR and UV-Vis spectropho-tometry method are presented in Table 7. he paired samples
Table 5: he calibration of FTIR model.
Wavelength number R2calibration R2validation RMSEC RMSECV
4000–500 cm−1 0.8558883 0.5403671 9.2037029 16.860432
3500–3000 cm−1 0.8527114 0.5758341 11.093782 18.985434
1300–1000 cm−1 0.8234164 0.7321395 10.187981 12.915498
1650–1400 cm−1 0.8653689 0.8201284 8.8958149 10.315225
Table 6: he accuracy of classiication of FTIR model (LDA, SIMCA, and SVM).
Model Accuracy
LDA 86.0%
SIMCA 91.2%
SVM 77.3%
Table 7: Analysis of lavonoid content with NIR and UV-Vis spec-trophotometry.
he NIR spectroscopy combined with multivariate calibra-tions methods can be used to determine lavonoid in medic-inal plant extract. he suggested method is simple, selective, validated, and ecofriendly.
Competing Interests
he authors declare that they have no competing interests.
Acknowledgments
he authors are grateful to the inancial support of Kemenris-tek Dikti, Indonesia, for funding this fundamental research project.
References
[1] R. I. Kementrian Kehutanan, “Lokakarya Nasional Tanaman Obat Indonesia,” 2010, http://www.dephut.go.id/index.php?q= id/node/6603.
[2] A. S. Nugraha and P. A. Keller, “Revealing indigenous Indone-sian traditional medicine: anti-infective agents,”Natural Prod-uct Communications, vol. 6, no. 12, pp. 1953–1966, 2011. [3] V. Cody, Flavonoid in Biology and Medicine II, Biochemical
Celluler and Medicinal Properties, Liss Inc, New York, NY, USA, 1985.
[4] R. Koes, W. Verweij, and F. Quattrocchio, “Flavonoids: a col-orful model for the regulation and evolution of biochemical pathways,”Trends in Plant Science, vol. 10, no. 5, pp. 236–242, 2005.
[5] A. L. Miller, “Antioxidant lavonoids: structure, function and clinical usage,”Alternative Medicine Review, vol. 1, no. 2, pp. 103–111, 1996.
[6] V. Bankova, R. Christoy, G. Stoev, and S. Popov, “Determination of phenolics from propolis by capillary gas chromatography,” Journal of Chromatography A, vol. 607, no. 1, pp. 150–153, 1992. [7] K. R. Markham, K. A. Mitchell, A. L. Wilkins, J. A. Daldy, and
Y. Lu, “HPLC and GC-MS identiication of the major organic constituents in New Zealand propolis,”Phytochemistry, vol. 42, no. 1, pp. 205–211, 1996.
[8] Y. Park, M. Koo, M. Ikegaki, and J. Contado, “Comparison of the lavonoid aglycone contents ofApis melliferapropolis from various regions of Brazil,”Arquivos de Biologia e Tecnologia, vol. 40, pp. 97–106, 1997.
[9] Direktorat Pengawasan Obat Tradisional, Parameter Stan-dar Umum Ekstrak Tumbuhan Obat, Departemen Kesehatan Republik Indonesia, Jakarta, Indonesia, 2000.
[10] H. M. Merken and G. R. Beecher, “Liquid chromatographic method for the separation and quantiication of prominent lavonoid aglycones,”Journal of Chromatography A, vol. 897, no. 1-2, pp. 177–184, 2000.
[11] B. Stuart,Infrared Spectroscopy: Fundamental and Applications, Saunders College Publishing, Philadelphia, Pa, USA, 2004. [12] H. Lin, J. W. Zhao, L. Sun, Q. S. Chen, and F. Zhou, “Freshness
measurement of eggs using near infrared (NIR) spectroscopy and multivariate data analysis,” Innovative Food Science & Emerging Technologies, vol. 12, no. 2, pp. 182–186, 2011. [13] J. A. Xue, C. J. Wu, L. L. Wang et al., “Dynamic prediction
models for alkaloid content using NIR technology for the study and online analysis of parching inAreca Seed,”Food Chemistry, vol. 126, no. 2, pp. 725–730, 2011.
[14] R. Chalucova, G. Krivoshiev, M. Mukarev, V. Kalinov, and C. Scotter, “Determination of green pea maturity by measurement of whole pea transmittance in the NIR region,” LWT—Food Science and Technology, vol. 33, no. 7, pp. 489–498, 2000. [15] E. D. Louw and K. I. heron, “Robust prediction models for
quality parameters in Japanese plums (Prunus salicinaL.) using NIR spectroscopy,”Postharvest Biology and Technology, vol. 58, no. 3, pp. 176–184, 2010.
[16] J. F. Novales, M.-I. L´opez, M.-T. S´anchez, J.-A. Garc´ıa, and J. Morales, “A feasibility study on the use of a miniature iber optic NIR spectrometer for the prediction of volumic mass and reducing sugars in white wine fermentations,”Journal of Food Engineering, vol. 89, no. 3, pp. 325–329, 2008.
partial least−squares (IPLS) model,”Analytical Letters, vol. 40, no. 18, pp. 3383–3391, 2007.
[18] M. Ritz, L. Vacul´ıkov´a, and E. Plevov´a, “Application of infrared spectroscopy and chemometric methods to identiication of selected minerals,”Acta Geodynamica et Geomaterialia, vol. 8, no. 1, pp. 47–58, 2011.
[19] C. Chang, M. Yang, H. Wen, and J. Chern, “Estimation of total lavonoid content in Propolis by two complementary colorimet-ric methods,”Journal of Food and Drug Analysis, vol. 10, no. 3, pp. 178–182, 2002.
Submit your manuscripts at
http://www.hindawi.com
Hindawi Publishing Corporation
http://www.hindawi.com Volume 2014 Inorganic Chemistry International Journal of
Hindawi Publishing Corporation
http://www.hindawi.com Volume 2014
Photoenergy
Hindawi Publishing Corporation
http://www.hindawi.com Volume 2014
Carbohydrate
Chemistry
International Journal ofHindawi Publishing Corporation
http://www.hindawi.com Volume 2014 Journal of
Chemistry
Hindawi Publishing Corporation
http://www.hindawi.com Volume 2014
Physical Chemistry
Hindawi Publishing Corporation http://www.hindawi.com
Analytical Methods in Chemistry Journal of
Volume 2014
Bioinorganic Chemistry and Applications Hindawi Publishing Corporation
http://www.hindawi.com Volume 2014
Spectroscopy
International Journal ofHindawi Publishing Corporation
http://www.hindawi.com Volume 2014
The Scientiic
World Journal
Hindawi Publishing Corporationhttp://www.hindawi.com Volume 2014 Medicinal Chemistry
Hindawi Publishing Corporation
http://www.hindawi.com Volume 2014
Chromatography Research International
Hindawi Publishing Corporation
http://www.hindawi.com Volume 2014
Applied ChemistryJournal of Hindawi Publishing Corporation
http://www.hindawi.com Volume 2014
Hindawi Publishing Corporation
http://www.hindawi.com Volume 2014
Theoretical Chemistry Journal of
Hindawi Publishing Corporation
http://www.hindawi.com Volume 2014 Journal of
Spectroscopy
Analytical Chemistry Hindawi Publishing Corporation
http://www.hindawi.com Volume 2014
Journal of
Hindawi Publishing Corporation
http://www.hindawi.com Volume 2014 Quantum Chemistry
Hindawi Publishing Corporation
http://www.hindawi.com Volume 2014
International
Electrochemistry
International Journal ofHindawi Publishing Corporation
http://www.hindawi.com Volume 2014
Hindawi Publishing Corporation
http://www.hindawi.com Volume 2014