DIGITAL VISIBILITY MAP DURING HAZE OCCURRENCE IN MALAYSIA
MASITAH BINTI ABDUL LATEH
This report is submitted in partial fulfillment of the requirements for the Bachelor of Computer Science (Artificial Intelligence)
FACULTY OF INFORMATION AND COMMUNICATION TECHNOLOGY UNIVERSITI TEKNIKAL MALAYSIA MELAKA
BORANG PENGESAHAN STATUS TESIS*
JUDUL: DIGITAL VISIBILITY MAP DURING HAZE OCCURRENCE IN MALAYSIA
SESI PENGAJIAN: 2013/2014
Saya MASITAH BINTI ABDUL LATEH
mengaku membenarkan tesis Projek Sarjana Muda ini disimpan di Perpustakaan FakultiTeknologi Maklumat dan Komunikasi dengan syarat-syarat kegunaan seperti berikut:
1. Tesis dan projek adalah hakmilik Universiti Teknikal Malaysia Melaka 2. Perpustakaan Fakulti Teknologi Maklumat dan Komunikasi dibenarkan membuat salinan untuk tujuan pengajian sahaja.
3. Perpustakaan Fakulti Teknologi Maklumat dan Komunikasi dibenarkan membuat salinan tesis ini sebagai bahan pertukaran antara institusi pengajian tinggi.
4. ** Sila tandakan (/)
___________ SULIT (Mengandungi maklumat yang berdarjah keselamatan atau kepentingan Malaysia
seperti yang termaktub di dalam AKTA RAHSIA RASMI 1972)
___________ TERHAD (Mengandungi makluamt TERHAD yang
telah ditentukan oleh organisasi/badan di mana penyelidikan dijalankan)
___________ TIDAK TERHAD
__________________________ _________________________ (TANDATANGAN PENULIS) (TANDANGAN PENYELIA)
Alamat tetap: NO 61 Batu 47 DR ASMALA BIN AHMAD_ Jalan Baru, 34850 Changkat Jering Nama Penyelia
Perak Darul Ridzuan
Tarikh: ________________________ Tarikh:_______________________
iii
DECLARATION
I hereby declare that this project report entitled
DIGITAL VISIBILITY MAP DURING HAZE OCCURRENCE IN MALAYSIA
is written by me and is my own effort and that no part has been plagiarized without citations.
STUDENT : MASITAH BINTI ABDUL LATEH Date: __________
iv
DEDICATION
I dedicate my final year project report to my beloved parent, Mr Abd Lateh Bin Man and Mrs Rohana Binti Hj Zakaria. As well as my siblings Mohd Nasir, Mohd Fairos, Mohd Fariz, Farawahidah and Siti Rohaida. I am really appreciate and thankful for your support towards completion of this project.
To my supervisor, Dr. Asmala Ahmad for the guidance and advice during the completion of my final year project.
v
ACKNOWLEDGEMENTS
This final year project report has been possible only because of the kind support contributed by many individuals.
I would like to express my sincere gratitude to my parents, my brother and sisters, and my dear friends.
I would like to give special thanks to Dr Asmala bin Ahmad for being such a great father and the most important things are his supportive, guidance, advice and constant supervision during the completion of my final year project. Without that guidance it would not have been possible to bring me to the completion of this project report.
vi
ABSTRACT
vii
ABSTRAK
Data MODIS satellite pada tahun 2005 digunakan untuk menentukan jarak penglihatan semasa Jerebu di Malaysia. Pada mulanya, pengukuran jerebu (dari segi jarak penglihatan) diambil daripada empat belas stesen pencemaran udara di Semenanjung Malaysia. Jalur 3 MODIS ditukar daripada nombor digital (DNs) kepada reflectance sebelum melalui pembetulan geometri. Hubungan antara reflectance dan jarak penglihatan yang sepadan untuk empat belas stesen pencemaran udara dijalankan menggunakan analisis regresi. Model regresi kuasa dipilih sebagai model yang terbaik untuk projek ini dan digunakan untuk memetakan jarak penglihatan pada data MODIS meggunakan teknik Density Slicing. Analisis Multitemporal juga dijalankan untuk memetakan jarak penglihatan pada data yang berlainan tarikh. Hasil keputusan daripada projek ini telah menunjukkan teknik remote sensing menggunakan jalur 3 MODIS berupaya untuk memetakan jarak penglihatan secara spatial semasa kejadian jerebu di kawasan kajian.
viii
TABLE OF CONTENTS
CHAPTER CONTENTS PAGE
DECLARATION
DEDICATION ACKNOWLEDGEMENTS ABSTRACT
ABSTRAK
TABLE OF CONTENTS LIST OF TABLES LIST OF FIGURES
LIST OF ABBREVIATIONS
iii iv v vi vii viii xi xiii xv
CHAPTER I INTRODUCTION 1.1 Project Background
1.2 Problem statement 1.3 Objectives
1.4 Scope
1.4.1 Software scope 1.4.2 Area of study scope 1.4.3 User Scope
1.5 Project significant 1.6 Expected output 1.7 Conclusion
1 2 4 4 4 5 6 6 6 6
CHAPTER II LITERATURE REVIEW AND ANALYSIS 2.0 Introduction
2.1 Air quality system in Malaysia
2.1.1 Malaysian Meteorology Department
ix
2.1.2 Department of Environment
2.1.3 Malaysian Air Quality Monitory and
Measurement System in Malaysia 2.1.4 Index Air Pollution
2.2 Analysis studies for determine haze using remote sensing approach 2.3 Remote sensing
2.3.1 MODIS satellite 2.3.2 NOAA satellite
2.3.2.1 AVHRR
2.4 Comparison of MODIS and AVHRR
2.5 Haze
2.6 Asthma and Pollution
8 9 11 13 15 16 18 18 19 20 21
CHAPTER III METHODOLOGY AND DESIGN 3.1 Project background
3.1.1 Input
3.1.2 Data pre-processing
3.1.2.1 Geometric correction 3.1.3 Data processing
3.1.3.1 Haze detection modelling 3.1.3.2 Haze detection derivation 3.1.4 Output
3.1.5 Accuracy analysis 3.2 Design
3.2.1 Regression analysis between remote Sensing data with visibility (KM)
3.2.2 Coefficient of determination, R2 and determinant of the best regression model.
x
CHAPTER IV RESULT
4.0 Introduction
4.1 Sampling and Power Regression Analysis 4.2 Band math
4.3 Production of Visibility Map 4.3.1 Density slicing technique
31 31 33 36 36
CHAPTER V ACCURACY ASSESSMENT
5.1 Accuracy analysis of haze intensity model 5.2 Relative mean square error (RMSE) 5.3 Multitemporal analysis for calculated and
measured visibility
43 43 46
CHAPTER VI COMPARISON OF DENSITY SLICING WITH KMEANS
6.0 Introduction of Classification 6.1 Clustering
6.2 K-Means Clustering Algorithm
6.3 Comparison of Density Slicing Technique and K-Means Clustering
6.4 Density Slicing and K-Means using Matlab
52 52 53 55
62
CHAPTER VII CONCLUSION 7.1 Introduction 7.2 Results 7.3 Strengths
7.4 Weakness
7.5 Proposition for improvement 7.6 Conclusion
xi
LIST OF TABLES
TABLE TITLE PAGES
1.1 2.1 2.2 2.3 2.4 2.5 2.6 2.7 2.8 4.1 4.2 5.1 5.2
List of software required
Malaysian Ambient Air Quality Guidelines Air Pollution Index: Health effect
MODIS instruments specification (MODIS 2007)
Primary use and spectral information
for MODIS Bands (MODIS 2007) Characteristics of NOAA-15 to
NOAA-19
Applications of AVHRR Band Comparison of MODIS and AVHRR API Status indicator
Reflectance Value of Band 3 and API data measured
The reflectance value of three date (12, 14, and 28) August 2005 after used the band math
Accuracy analysis of calculated visibility with measured visibility using remote sensing techniques on 12August 2005.
Accuracy analysis of calculated visibility with measured visibility using remote sensing techniques on 14 August
xii
5.3
5.4
6.1
6.2
6.3
6.4
6.5
6.6
2005.
Accuracy analysis of calculated visibility with measured visibility using remote sensing techniques on 28 August 2005.
Calculated and measured visibility on 12, 14 and 28 August 2005 for multitemporal graph
Density slicing percentage of each slice on 12 August 2005
K-Means clustering percentage of each class on 12 August 2005
Density slicing percentage of each slice on 14 August 2005
K-Means clustering of each class on 14 August 2005
Density slicing percentage of each slice on 28 August 2005
K-Means clustering of each class on 28August 2005
46
50
56
56
58
58
61
xiii
LIST OF FIGURES
DIAGRAM TITLES PAGES
1.1 1.2 2.1 2.2 2.3 3.1 3.2 4.1 4.2 4.3 4.4 4.5 4.6 4.7 4.8 4.9 4.10
The graph of Visibility against day for 1999-2008
Map of Peninsular Malaysia
The air quality stations in Malaysia Calculation of Air Pollution Index (API) Terra Satellite (MODIS 2007)
Map of Peninsular Malaysia
The flowchart of detecting haze using MODIS dataset
Graph of Power Regression Model using Band 3 MODIS and API data measured Georeferencing and band math images on 12 August 2005
Georeferencing and band math images on 14 August 2005
Georeferencing and band math images on 28 August 2005
Density slicing map on 12 August 2005. Band math and density slicing images on 12 August 2005
Density slicing map on 14 August 2005.
Band math and density slicing images on 14 August 2005
Density slicing map on 28 August 2005.
xiv 5.1 5.2 5.3 5.4 5.5 6.1 6.2 6.3 6.4 6.5 6.6 6.7
Visibility versus date in Subang, Selangor Visibility versus date in Malacca
Visibility versus date in Muadzam Shah, Pahang.
Visibility versus date in Sitiawan, Perak.
Visibility versus Days for four stations on 12, 14 and 28 August 2005.
Flowchart of K-means
Comparison Map of Density Slicing and K-Means on date 12 August 2005
Comparison Map of Density Slicing and K-Means on date 14August 2005
Comparison Map of Density Slicing and K-Means on date 28 August 2005
K-Means and density slicing images on 12 August 2005.
K-Means and density slicing images on 14 August 2005.
xv
LIST OF ABBREVIATIONS
ENVI Environment for Visualizing Images
DN Digital Number
MODIS Moderate Resolution Imaging Spectroradiometer
DOE Department of Environment
MMD Malaysia Meteorological Departments
API Air Pollution Index
NOAA National oceanic and atmospheric administration AVHRR Advanced Very High Resolution Radiometer CESAR Central European study of air pollution and
respiratory health
RMSE Root mean square error
GIS Geographical information system
IPU Indeks pencemaran udara
O3 Ozone
NO2 Nitrogen Dioxide
PM10 Particulate Matter
SO2 Suiphur Dioxide
CO Carbon Monoxide
IR Infrared
CHAPTER I
INTRODUCTION
1.1 Project Background
Environmental issues may cause a serious problem not only to environment but also to humans. As Malaysia grows to become a country that is comparable to other developed countries, it is undeniable that some negative effects also come along. One of the most serious effects is the increasing air pollution caused by particularly growing number of vehicles, expansion of industrialization areas and forest fire.
Basically, air pollution can be divided into two main categories that are natural air pollution, and anthropogenic air pollution (caused by human activities). Normally, anthropogenic air pollution occurs at small scale (affects small area) but natural air pollution occurs at large scale (affects large area).
2
PM10 (particulate of size 10 micron and below) is the main concern as it may lead to deteriorating human welfares and unhealthy conditions.
Haze can cause the field of view to blur. Asthma is a respiratory problem that is due to fine particles in the air and is commonly associated with haze. Studies have shown that the haze occurrence has caused the number of hospitalizations for asthma increases. Bronchial Asthma or chronic bronchitis is a disease which is caused by the inflammation bronchus where the airways get easily irritated and narrowed and can be triggered when inhaling air that is polluted with fine particles.
Such conditions are also visible from the images recorded by electronic devices including those recorded by remote sensing satellites. Remote sensing is a technology that can provide a unique perspective in which to observe large regions and global monitoring is possible from nearly any site on earth. In this project, remote sensing methods will be used to monitor and map haze. In order to do so, this project incorporates a number of digital image processing techniques. In general, image processing involves changing the nature of an image in order to either improve its pictorial information for human interpretation or to render it more suitable for autonomous machine perception. Digital image processing involves using a computer to change the nature of a digital image.
1.2 Problem Statement
This type of digital visibility map is not available in Malaysia as compared to other countries because Malaysia used conventional method to measured visibility However, there is the disadvantage of an air pollution station in which it is designed to measure at only the particular location where it is located, i.e. at big cities and high populated areas. Such approach gets more expensive if to be made available at more locations.
3
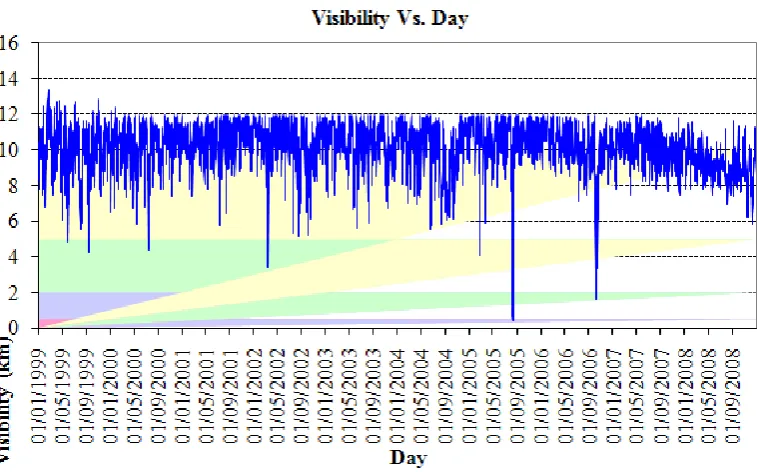
[image:18.595.138.517.194.430.2]The records of daily mean Horizontal Visibility for Petaling Jaya station in 1999-2008 by Malaysian Meteorological Department show the worst haze episod is in year 2005 which show the lowest visibility compare to years before and after year 2005.
4 1.3 Objectives
The aim of the study is to develop a technique of determining haze concentration and to detect haze on the desired region using remote sensing data based on artificial intelligent methods.
In order to achieve this aim, the objectives below are concerned:
1. To determine the relationship between visibility and spectral measurement from remote sensing satellite.
2. To develop a remote sensing technique to monitor and map haze in order to produce a digital visibility map.
3. To evaluate and test the accuracy of the visibility map.
1.4 Scopes
Scopes of the study are divided into three parts: software scope, area of study scope and user scope.
1.4.1 Software Scope
5
Table 1.1: List of software required
SOFTWARE REQUIREMENT
Operating System(OS) Microsoft Windows 7 Ultimate
Image Processing Software ENVI 4.5
Software Support Adobe Illustrator CS5
Matlab 2010a
Database Support Microsoft Excel 2007
1.4.2 Area of Study Scope
[image:20.595.158.482.423.594.2]The study area is Peninsular Malaysia, located within latitude 6°47’ N, longitude 88°25’ E (upper left), and latitude 1°21’ N, longitude 106°20’ E (lower right) as shown in figure 3.1.
6 1.4.3 User Scope
Researchers
The final output will be used as a part of research materials for future studies or as a research for next studies.
Student/Lecturer
The final output will be the next use for the purpose of teaching and learning.
Haze planners
The final output helps for planning purpose of determining the concentration of the haze that frequently occur.
1.5 Project Significant
The digital visibility map developed in this project will be very useful to people with asthmatic problem to help them to guide their way while travelling.
1.6 Expected output
The expected outcome from this project is a digital visibility map to assist people with asthma while travelling to different places.
1.7 Conclusion
As conclusion, this project will determine the concentration of haze components in Malaysia. Later, a digital visibility map for asthmatic people is to
CHAPTER II
LITERATURE REVIEW AND ANALYSIS
2.0 Introduction
This chapter reviews previous research and studies to gain ideas and information related to the project. This will assists the tasks in designing the methodology to solve the problem that should be done in a limited period of time allocated.
2.1 Air Quality system in Malaysia
8 2.1.1 Malaysian Meteorological Department (MMD)
The Malaysian Meteorological Department has established the Environmental Studies Division in 1976 to contribute to the conservation and enhancement of environmental quality and the advancement of knowledge and understanding of atmospheric processes. Services that provided by Malaysian Meteorological Department are meteorological and air quality data from a network of monitoring stations for public, private and commercial. There exist 52 automatic air quality stations and 14 manual air quality stations in Malaysia that is located at strategic places such as industrial area, urban, sub-urban and rural area.
At the same time, meteorological department also alert by giving early warning of environmental disasters by monitoring changes in atmospheric composition and environmental conditions. Other than providing meteorological data, meteorological department also provides air quality forecasts and coordinate the department's response to nuclear, chemical spills, emergency-haze events and other environmental emergencies. The most important thing regarding this department is it conducts research to advance knowledge and understanding of the atmosphere.
2.1.2 Department of Environment
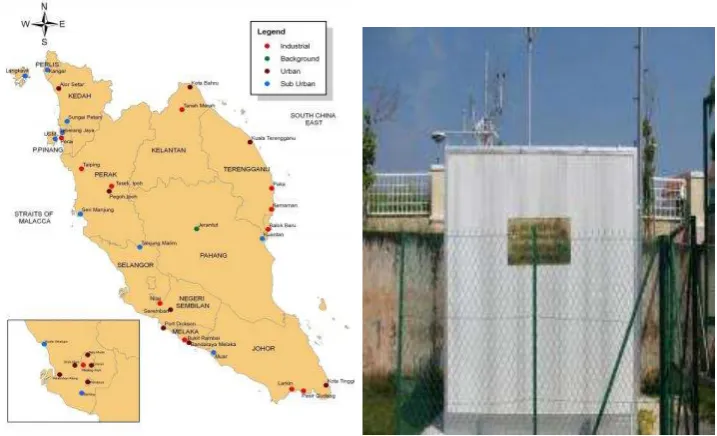
9 2.1.3 Malaysian Air Quality Monitory and Measurement System in Malaysia
[image:24.595.139.498.324.542.2]In Malaysia, air quality monitoring network is carried out by Malaysian Meteorological Department and Department of Environment Malaysia through a network of 52 automatic stations and 14 manual stations whereby it is located at strategic places that are industrial, urban, sub-urban and rural. This system provides immediate reading of the level of air pollution. The figure 2 shows the stations in Peninsular Malaysia. Different colour dots represent different place for entire figure.