http://dx.doi.org/10.12988/ams.2014.4289
Haze Reduction from Remotely Sensed Data
Asmala Ahmad, Mohd Khanapi Abdul Ghani and Sazalinsyah Razali
Faculty of Information and Communication Technology Universiti Teknikal Malaysia Melaka (UTeM), Malaysia
Hamzah Sakidin
Faculty of Sciences & Information Technology Universiti Teknologi Petronas (UTP), Malaysia
Noorazuan Md Hashim
Faculty of Social Sciences & Humanities Universiti Kebangsaan Malaysia (UKM), Malaysia
Copyright © 2014 Asmala Ahmad et al. This is an open access article distributed under the Creative Commons Attribution License, which permits unrestricted use, distribution, and reproduction in any medium, provided the original work is properly cited.
Abstract
Haze consists of atmospheric aerosols and molecules that scatter and absorb solar radiation, thus affecting the downward and upward solar radiance to be recorded by remote sensing sensors. Haze modifies the spectral signature of land classes and reduces classification accuracy, so causing problems to users of remote sensing data. Hence, there is a need to reduce the haze effects to improve the usefulness of the data. A way to do this is by integrating spectral and statistical approaches. The result shows that the haze reduction method is able to increase the accuracy of the data statistically and visually.
Keywords: Remote Sensing, Haze Reduction, Spectral
1 Introduction
[1], [2]. Haze affects the properties of remote sensing data and can cause serious inaccuracy in further processing stages (e.g. classification) [3], [4], [5]. Haze is caused by atmospheric scattering and absorption due to haze constituents in which depend substantially on the wavelength of the solar radiation. Scattering is usually much stronger for short wavelengths than for long wavelengths and significantly affects the classification of surface features from remote sensing data. In order for the hazy data to be usable again, this study attempts to develop a practical haze reduction technique. Haze reduction, in practice, should be usable at any time and independent from auxiliary information, such as haze path radiance and meteorological information [6], which is unavailable in most cases due to a lack of ground stations. Initially, researchers in this area attempted to determine and remove uniform haze path radiance, but later spatially-varying haze was taken into account.
In the early years, the most popular procedure was dark-object subtraction (DOS), which considers uniform haze [7]. In order to determine the haze path radiance, it is assumed that there are some pixels within the image that are totally black (dark objects); this is usually caused by topography or cloud shadows. A dark object is assumed to be unable to reflect any solar energy and thus should possess zero DN (digital number) or zero reflectance. If haze exists, these pixels do not appear completely dark because solar energy is scattered into the satellite’s field of view by the haze. From the histogram of a particular visible band, this effect can be seen as a sharp increase in occurrence frequency in the lower DN region. The DN value that corresponds to this increase is assumed to be the amount of haze in that particular band. This needs to be subtracted from the entire image for that band to correct for the haze, although smaller occurring DNs may also represent haze. Although this is easy and practical, it is quite ambiguous in most cases, since the shadow pixels caused by topography and clouds may not actually have zero DN due to secondary energy scattered from other objects into the shadowed area; thus the haze value selected from the histogram may not correspond to a real dark object. This can lead to over-reduction for haze and consequently cause truncation of the values for some surface pixels. Hence, this method is not considered further.
equation, which can be generated by regressing the DNs of PIF pixels from a hazy dataset against those of a reference dataset from the same band. The entire hazy dataset is then transformed using this linear equation. Unlike the DOS method that uses dark features that produce a weak radiance, the PIF method uses bright surfaces. Hence, the additive effects of secondary scattering on the PIFs can be neglected. However, the method is less effective when dealing with non-uniform haze.
Liang et al. [6] presented a haze reduction method that takes into account non-uniform haze within a Landsat dataset, by combining image-based and radiative transfer equation approaches. Initially, the near-infrared bands 4, 5 and 7, which are less affected by haze, are used to classify pixels into cover types. For this purpose, they used an unsupervised classification method, where 20 to 50 clusters are generated, depending on the complexity of the landscape. They then separated clear and the hazy regions by enhancing the boundaries between hazy and clear regions and then visually analysing and drawing the hazy regions using image processing software. Liang et al. [6] suggested that the boundaries can be enhanced using one of the following methods: (i) the fourth component of the Tasseled Cap transformation [9], (ii) the ratio of bands 1 and 4 or (iii) the visible bands 1, 2 and 3; the last one is often used because it is simple and effective. Next, they determined the mean reflectances of clear regions and matched with those of the hazy region from the same cluster. They then subtracted the mean reflectances of the cluster from the hazy reflectances in order to determine the haze reflectance. With the assumption that the distribution of haze reflectance is smoother than surface reflectance, Liang et al. [6] subsequently used a low-pass smoothing to determine the distribution of the haze reflectance in each band. Finally, they determined the corrected surface reflectance for each band by subtracting the corresponding haze reflectance from the hazy data. Liang et al. [6] claimed the method visually removed non-uniform haze from bands 1, 2 and 3.
2 Materials and Methods
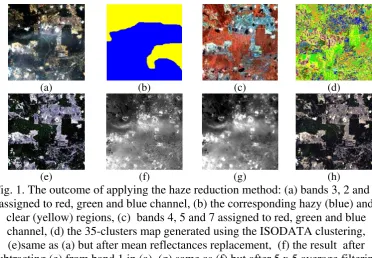
Subsequently, the hazy-clear regions developed are used as a template for the 35-clusters map. By doing so, each cluster is subdivided into two parts: the parts that fall within the hazy region and the clear region. For each cluster, pixel reflectances from the hazy region are replaced with the mean reflectance from the clear region; this process is carried out for all 35 clusters and for visible bands 1, 2 and 3. Infrared bands 4, 5 and 7 are assumed unaffected by the haze and therefore do not need any haze reduction. Bands 3, 2 and 1 assigned to red, green and blue channels after the mean reflectance replacement (Figure 1(e)). Next, the haze reflectance in each band is determined by subtracting the mean reflectances from the hazy data (Figure 1(f)) and then filtering it with a 5 x 5 average filter (Figure 1(g)). Finally, the haze reflectance is subtracted from rest of the hazy data (i.e. bands 2 and 3) in order to determine the corrected surface reflectances for those bands (Figure 1(h)). The performance of the haze reduction is initially done through visual analysis. Next, Maximum Likelihood (ML) classification is carried out on the dataset before and after haze reduction and the performance is further verified based on their classification accuracy. This is done by using a confusion matrix, with respect to the clear image.
(a) (b) (c) (d)
(e) (f) (g) (h)
Fig. 1. The outcome of applying the haze reduction method: (a) bands 3, 2 and 1 assigned to red, green and blue channel, (b) the corresponding hazy (blue) and
clear (yellow) regions, (c) bands 4, 5 and 7 assigned to red, green and blue channel, (d) the 35-clusters map generated using the ISODATA clustering, (e)same as (a) but after mean reflectances replacement, (f) the result after subtracting (e) from band 1 in (a), (g) same as (f) but after 5 x 5 average filtering
and (h) same as (a) but after subtracting the haze reflectance in each band.
3 Results and Discussion
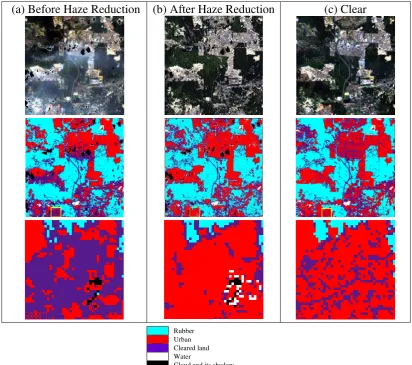
(a) Before Haze Reduction (b) After Haze Reduction (c) Clear
Rubber Urban
Cleared land Water
Cloud and its shadow
Fig. 2. Colour composite image of band 3, 2 and 1 assigned to red, green and blue (top row) respectively, ML classification (middle row) and the corresponding enlarged version (bottom row) before and after haze reduction (left and middle column) and the clear image (right column). The enlarged version represents the
area within the yellow box in the ML classification image.
Table 1: Confusion matrix (a) before and (b) after haze reduction with respect to the clear image.
Clear Image (Percent)
Class
Water Rubber Cleared Land
Urban Total
Water 72.51 0.04 0.42 1.38 1.19
Rubber 7.44 89.58 18.61 3.12 44.99
Cleared Land 8.02 9.8 59.05 28.92 27.78
Urban 12.03 0.57 21.92 66.59 26.04
Total 100 100 100 100 100
Overall Accuracy = 74.9
Kappa Coefficient = 0.616
Clear Image (Percent)
Class
Water Rubber Cleared Land
Urban Total
Water 75.45 0.22 0.68 1.46 1.39
Rubber 5.73 89.14 24.06 3.71 46.31
Cleared Land 8.02 8.69 50.04 19.92 22.33
Urban 10.81 1.94 25.21 74.91 29.97
Total 100 100 100 100 100
Overall Accuracy = 75.0%
Kappa Coefficient = 0.616
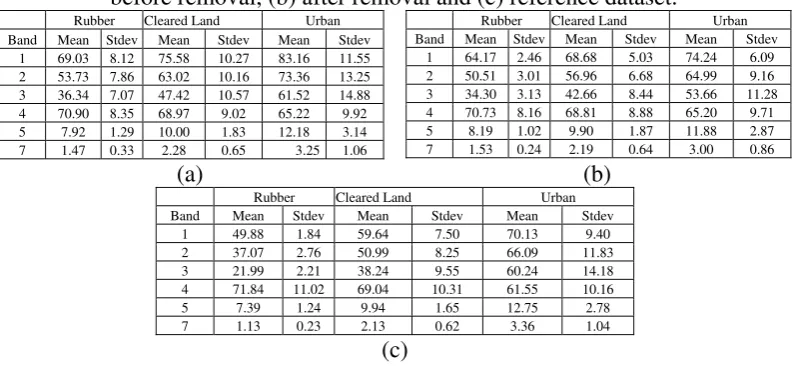
Table 2:Mean and standard deviation for cleared land, rubber and urban: (a) before removal, (b) after removal and (c) reference dataset.
Rubber Cleared Land Urban
In overall, the haze reduction method is able to remove haze and produce classification with slightly higher accuracy compared to that of before haze reduction. The performance is hampered by the need to use visual analysis in determining the hazy-clear boundary. An objective method to do so is needed in order to improve the results.
References
[1] M. Hashim, K. D. Kanniah, and A. Ahmad and A. W. Rasib, Remote sensing of tropospheric pollutants originating from 1997 forest fire in Southeast Asia. Asian Journal of Geoinformatics, 4 (4) (2004), 57 – 67.
[2] A. Ahmad and M. Hashim, Determination of haze using NOAA-14 satellite data, Proceedings on The 23rd Asian Conference on Remote Sensing 2002 (ACRS 2002), (2012), in cd.
[3] A. Ahmad and S. Quegan, Comparative analysis of supervised and unsupervised classification on multispectral data, Applied Mathematical Sciences, 7(74) (2013), 3681 – 3694.
[5] A. Ahmad, Analysis of Landsat 5 TM data of Malaysian land covers using ISODATA clustering technique, Proceedings of the 2012 IEEE Asia-Pacific Conference on Applied Electromagnetic (APACE 2012), (2012) , 92 – 97.
[6] S. Liang, H. Fang and M. Chen, Atmospheric correction of Landsat ETM+ land surface imagery: Part I: Methods, IEEE Transactions on Geoscience and Remote Sensing, 39(11) (2001), 2490 – 2498.
[7] P. S. Chavez Jr., An improved dark-object subtraction technique for atmospheric scattering correction of multispectral data, Remote Sensing of Environment, 24 (1988), 459 – 479.
[8] C. S. Schott, C. Salvaggio and W. Volchok, Radiometric scene normalization using pseudoinvariant features, Remote Sensing of Environment, 26 (1988), 1 – 16.
[9] P. C. Eric and C. C. Richard, A physically-based transformation of thematic mapper data--the tm tasseled cap, IEEE Transactions on Geoscience and Remote Sensing, 22(3) (2014), 256 – 263.
[10] A. Ahmad and S. Quegan, Multitemporal Cloud Detection and Masking Using MODIS Data, Applied Mathematical Sciences, 8(7) (2014), 345 – 353.