i
INTERNATIONAL CONFERENCE ON AGRIBUSINESS
DEVELOPMENT
FOR HUMAN WELFARE 2016
INTERNATIONAL
CONFERENCE
AGRIBUSINESS
DEVELOPMENT FOR
HUMAN WELFARE
“Small and Medium
-sized
Enterprises Competitiveness”
EDITOR TEAM
Siti Yusi Rusimah Achmad Fachruddin Rohandi Aziz Dara Rosalia
ADDRESS
Agribusiness Department Agriculture Faculty
Universitas Muhammadiyah Yogyakarta
Jl. Lingkar Selatan, Tamantirto, Kasihan, Bantul, Yogyakarta, 55183 Phone. 0274-387656 (ext. 201) Fax. 0274-387646
i
Gubernur
Daerah Istimewa Yogyakarta
Sambutan
KONFERENSI INTERNASIONAL
“
AGRIBUSINESS DEVELOPMENT FOR HUMAN WELFARE
”
Yogyakarta, 14 Mei 2016
Assalamu’alaikum Wr. Wb.
Salam sejahtera untuk kita semua. Yang Saya hormati :
- Rektor Universitas Muhammadiyah Yogyakarta;
- Para Narasumber;
- Hadirin dan Para Peserta yang berbahagia,
Puji dan syukur marilah kita panjatkan kehadirat Allah SWT karena hanya atas limpahan rahmat serta karunia-Nya, kita dapat hadir pada kesempatan acara
Konferensi Internasional “Agribusiness Development For Human Welfare” ini dalam keadaan sehat wal’afiat.
Pada kesempatan kali ini, secara ringkas Saya akan menyampaikan mengenai industri kecil menengah nasional yang menjadi tema pada pembukaan Seminar Internasional “Agribusiness Development For Human Welfare” ini.
Hadirin dan Saudara-saudara sekalian yang Saya hormati,
Berdasarkan data BPS, pertumbuhan industri pengolahan nonmigas pada tahun 2015 secara kumulatif sebesar 5,04%; lebih tinggi dari pertumbuhan ekonomi (PDB) pada periode yang sama sebesar 4,79%. Pada periode Januari-Desember 2015, nilai ekspor produk industri pengolahan nonmigas mencapai USD 106,63 Milyar, dan nilai impor mencapai USD 108,95 milyar, sehingga neraca perdagangan insdustri pengolahan nonmigas pada periode yang sama sebesar USD 2,32 milyar (nerasa defisit).
ii
telah berkontribusi sebesar 34,82% terhadap pertumbuhan industri pengolahan nonmigas secara keseluruhan.
Angka ini dapat tercapai karena dukungan lebih kurang 3,6 juta unit usaha, yang merupakan 90 persen dari total unit usaha insutri nasional. Jumlah unit usaha tersebut telah mampu menyerap tenaga kerja sebesar 8,7 juta orang, yang tentunya berdampak pada meningkatnya ekonomi nasional serta mengurangi kemiskinan.
Industri Kecil dan Menengah (IKM) memiliki peran yang strategis dalam perekonomian nasional. Hal ini sejalan dengan Visi Pemerintah dalam Rencana Pembangunan Nasional Jangka Menengah (RPJMN) 2015-2019 yaitu “Terwujudnya Indonesia yang berdaulat, mandiri, dan berkepribadian berlandaskan gotong royong”.
Untuk lebih meningkatkan peran tersebut, Penumbuhan dan Pengembangan Industri Kecil dan Menengah diarahkan untuk memiliki tujuan jangka menengah guna mewujudkan industri kecil dan industri menengah yang berdaya saing, berperan signifikan dalam penguatan struktur industri nasional, pengentasan kemiskinan dan perluasan kesempatan kerja, serta menghasilkan barang dan/atau jasa Industri untuk keperluan ekspor.
Hadirin dan Saudara-saudara sekalian,
Awal tahun ini, kita telah memasuki era Masyarakat Ekonomi ASEAN (MEA). Dengan demikan, perekonomian nasional akan langsung bersaing dengan para pelaku pasar di kawasan ASEAN. Produk dan jasa termasuk investasi negara-negara anggota telas bebas memasuki pasar di kawasan ASEAN.
Dalam rangka menghadapi hal tersebut, Pemerintah mengambil langkah-langkah strategis berupa peningkatan daya saing industri dan mendorong investasi di sektor industri; di mana peningkatan daya saing industri itu sendiri dilakukan melalui penguatan struktur industri dengan melengkapi struktur industri yang masih kosong serta menyiapkan strategi ofensif dan defensif dalam akses pasar.
Pemerintah telah melakukan Penguatan Sektor IKM dengan strategi ofensif dan defensifnya melalui beberapa program pelaksanaan, diantaranya antara lain: Penumbuhan Wirausaha Baru; Pengembangan IKM melalui Pengembangan Produk IKM serta Peningkatan Kemampuan Sentra dan UPT; Pemberian Bantuan Mesin dan Peralatan Produksi; Perluasan Akses Pasar melalui Promosi dan Pameran; Fasilitasi Pendaftaran Hak Kekayaan Intelektual; Fasilitasi Sertifikasi Mutu Produk dan Kemasan; serta Fasilitasi Pembiayaan melalui Skema Kredit Usaha Rakyat (KUR).
iii
Industri, khususnya dalam program pemberdayaan Industri Kecil dan Menengah, didukung dengan sepenuh hati, agar dapat lebih bermanfaat bagi masyarakat dalam rangka pengembangan industri kecil menengah.
Hadirin dan Saudara-saudara sekalian yang Saya hormati,
Demikian beberapa hal yang dapat Saya sampaikan. Akhirnya dengan memohon ridho Allah Subhanahu Wata’ala, seraya mengucap “Bismilahirrahmanirrahim”,
Konferensi Internasional “Agribusiness Development For Human Welfare” dengan
ini secara resmi Saya nyatakan dibuka. Semoga Allah SWT memberikan petunjuk, bimbingan, perlindungan dan kemudahan dalam setiap langkah dan upaya kita. Amien.
iv
WORDS OF WELCOME
Assalamu'alaikum warahmatullahi wabarakatuh
Alhamdulillah, all praise be to Allah SWT, who has given us His blessings so that this International Seminar of Agribusiness Development for Human Welfare (ADHW) 2016 entitled ”Small and Medium-sized Enterprises Competitiveness” can be conducted. This International Conference is held in cooperation among Agribusiness Study Program of Muhammadiyah University of Yogyakarta with Putra University of Malaysia (UPM), Kasetsart University (KU), Association of Indonesian Agricultural Economy (PERHEPI), and Agribusiness Association of Indonesia (AAI), Universitas Gadjah Mada (UGM) and Universitas Brawijaya (UB).
Countries of ASEAN members like Indonesia, Malaysia, and Thailand have more than 90% Small and Medium-sized Enterprises (SMEs). In general, SMEs play important role in economic developments such as in terms of employment, added value, improve foreign exchange, and economic growth. For Indonesia, the role of SMEs is limited to employment and added value, while the foreign exchange from SMEs is still low. According to the General Director of SMEs of Industrial Ministry, in 2013 the total SMEs being able to pass through export market is just under 5 percent. For that required many breakthrough and innovation so that the role of SMEs becomes real economic development, especially in Indonesia, and generally in ASEAN countries.
On behalf of Agribusiness Department of Universitas Muhammadiyah Yogyakarta, we would like to express our gratitude Putra University of Malaysia (UPM), Kasetsart University (KU), Association of Indonesian Agricultural Economy (PERHEPI), Agribusiness Association of Indonesia (AAI), Universitas Gadjah Mada (UGM) and Universitas Brawijaya (UB) for all supports, sponsors, and all committee members having worked so hard that this International Conference can be conducted.
Hopefully, these sinergies coming from various parties can provide contribution for developing SMEs in Indonesia and other ASEAN countries as well.
Wassalamu'alaikum warhmatullahi wabarakatuh
Head of Agribusiness Department Universitas Muhammadiyah Yogyakarta
v
PREFACE
Assalaamualaikum, Warahmatullaahi., Wabarakaatuh. Dear Honorable Governor of Yogyakarta Special Province Dear respectable Prof. Dr. Zainal Abidin Mohamed
Dear respectable Asist. Prof. Pornthipa Ongkunaruk
Dear respectable Rector of UMY Prof. Dr. Bambang Cipto, MA.
Dear all invited Guests, Speakers, and Participants of International seminar of ADHW 2016.
Alhamdulillah, all praise be to the Almighty God, so that we can be gathering here today at Muhammadiyah University of Yogyakarta in order to attend the Conference on Agribusiness Development for Human Welfare (ADHW) 2016.
Ladies and Gentlemen,
On behalf of the committee, I would like to say welcome to this International Conference on ADHW 2016 and thank you for attending our invitation.
Especially, we are grateful to invited speakers, Prof. Zainal Abidin Mohamed and Asist. Prof. Pornthipa Ongkunaruk, for their willingness to share information and thoughts in this conference. As a bit report, that this conference has been attended by 85 speakers coming from five countries.
This conference entitled “Small and Medium-sized Enterprise Competitiveness”. ASEAN Economic Community is the largest economic integration that is going to be implemented at the beginning of 2016 (December 31, 2015). Through this integration, SMEs will have opportunity to expand access to markets, technology, and capital. But at the same time SMEs are required to improve their competitiveness in order to survive in the market. We expect that this seminar is capable of producing thoughts building SMEs within ASEAN, especially Indonesia, to face the free trade.
This event can be done by support and efforts from all sides. Therefore, I would like to say thank you to all committee members having worked hard to conduct this event. We, as the organizer commitee, do apologize when there is a shortage in conducting this event.
Wassalamualaikum, Warahmatullaahi., Wabarakaatuh.
Chairman
International Conference on ADHW 2016
vi
LIST OF REVIEWERS
1. Prof. Dr. Mad Nasir Shamsudin (Universiti Putra Malaysia) 2. Prof. Dr. Zaenal Abidin Mohamed (Universiti Putra Malaysia)
3. Dr. Ismail Abd. Latif (Universiti Putra Malaysia)
4. Dr. Juwaidah Sharifudin (Universiti Putra Malaysia) 5. Assist. Prof. Dr. Amin Mahir Abdullah (Universiti Putra Malaysia) 6. Assist. Prof. Dr. Nitty Hirawaty K. (Universiti Putra Malaysia) 7. Assist. Prof. Dr. Parthana Parthanadee (Kasetsart University) 8. Assist. Prof. Dr. Pornthipa Ongkunaruk (Kasetsart University)
9. Dr. Jumpol Vorasayan (Kasetsart University)
10. Prof. Dr. Ir. Masyhuri (Universitas Gadjah Mada)
11. Prof. Dr.Ir. Irham, M.Sc. (Universitas Gadjah Mada)
12. Dr. Jamhari, SP. MP. (Universitas Gadjah Mada)
13. Dr. Jangkung HM, SP.M.Ec. (Universitas Gadjah Mada)
14. Subejo, SP, M.Sc., Ph.D. (Universitas Gadjah Mada)
15. Dr. Ir. Rini Dwiastuti, M.S. (Universitas Brawijaya) 16. Ir. Edi Dwi Cahyono, M.Sc., Ph.D. (Universitas Brawijaya) 17. Wisynu Ari Gutama, S.P., M.MA. (Universitas Brawijaya) 18. Hery Toiba, S.P., M.P., Ph.D. (Universitas Brawijaya)
19. Yuniar Khasanah, M.Sc. (Lembaga Ilmu Pengetahuan Indonesia)
20. Lusty Istiqamah, M.Biotech (Lembaga Ilmu Pengetahuan Indonesia)
21. Ir. M. Kismuntono (Lembaga Ilmu Pengetahuan Indonesia)
22. Dr. Ir. Sriyadi, MP. (Universitas Muhammadiyah Yogyakarta)
23. Dr. Ir. Widodo, MP. (Universitas Muhammadiyah Yogyakarta)
24. Dr. Ir. Indardi, M.Sc. (Universitas Muhammadiyah Yogyakarta)
25. Dr. Ir. Triwara BS, MP. (Universitas Muhammadiyah Yogyakarta)
vii
ATTENDED REVIEWER
1
2
3
4
5
6
7
8
9
10
viii
EDITOR FOREWORD
The economic integrations by ASEAN certainly have given a major influence on Small and Medium-sized Enterprises (SMEs). Beside economic integration in the form of free trade area (FTA) that has been going on since the early 2000s, economic integration in the form of ASEAN Economic Community (AEC) has been ongoing since the beginning of 2016. Through this integration, SMEs have opportunity to expand access to markets, technology, and capital. But at the same time SMEs are required to improve their competitiveness in order to survive in the market.
In order to explore ideas, concept, and innovations related to the competitiveness of SMEs, International Conference on Agribusiness Development for Human Welfare (ADHW 2016) was held in Yogyakarta on May 14, 2016. The conference organized by Department of Agribusiness Universitas Muhammadiyah Yogyakarta, in collaboration with Department of Agribusiness and Information System Universiti Putra Malaysia, Department of Agro-Industrial Technology Kasetsart University, Department of Agriculture Socio-Economics Universitas Gadjah Mada, Department of Agriculture Socio-Economics of Universitas Brawijaya, Indonesian Society of Agriculture Economics, Agribusiness Association of Indonesia. Hopefully proceedings of ADHW 2016 provide stimulus for increasing competitiveness of SMEs in ASEAN, especially in Indonesia.
Furthermore, we are grateful to Allah, the Sustainer of all word, who always makes it easy for our affairs. We would like to acknowledge with thanks to all the institution and individual who joined with resources and efforts in organizing the conference that resulted in the papers which are published in this proceeding. Special thanks to all authors and discussants who contributed with their intellectual capital and responded to our call papers. Thanks and acknowledgment are also due to all reviewers of the conference who helped in evaluating submitted papers; and to the members of the Organization Committee, who ensured smooth execution of the event.
ix
TABLE OF CONTENTS
WELCOME FROM GOVERNOR OF YOGYAKARTA ... i
WORDS OF WELCOME ... iv
PREFACE ... v
LIST OF REVIEWERS ... vii
EDITOR FOREWORD ... viii
TABLE OF CONTENTS ... ix
RICE SELF-SUFFICIENCY IN INDONESIA: AN ANALYSIS ON BUDGET ALLOCATION AND THE ACHIEVEMENT ... 1
Sri Nuryanti MODELING OF COOPERATION TO IMPROVE RURAL ECONOMIC IN LANGKAT ... 8
Muhammad Buchari Sibuea GRANARY GROUP PERFORMANCE IMPACT TO THE PRICE AND FOOD SELF-SUFFICIENCY ON THE FARM HOUSEHOLDS ...20
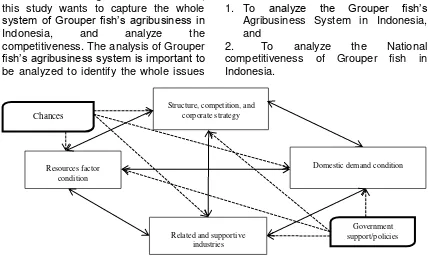
Sri Mardiyati, Jamhari, Jangkung Handoyo Mulyo Dwidjono Hadi Darwanto ANALYSIS OF AGRIBUSINESS SYSTEM AND COMPETITIVENESS OF GROUPER FISH IN INDONESIA ...28
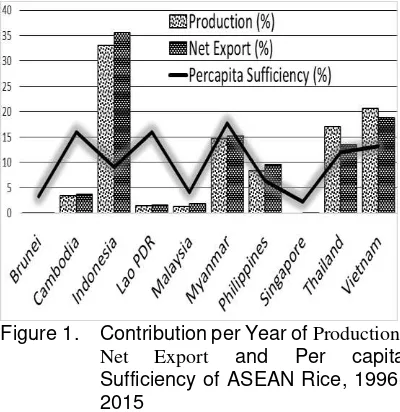
Grace Maharani Putri, Venty F. Nurunisa ANALYSIS OF COMPETITIVENESS ASEAN RICE TRADE IN THE ERA OF ASEAN ECONOMIC COMMUNITY ...36
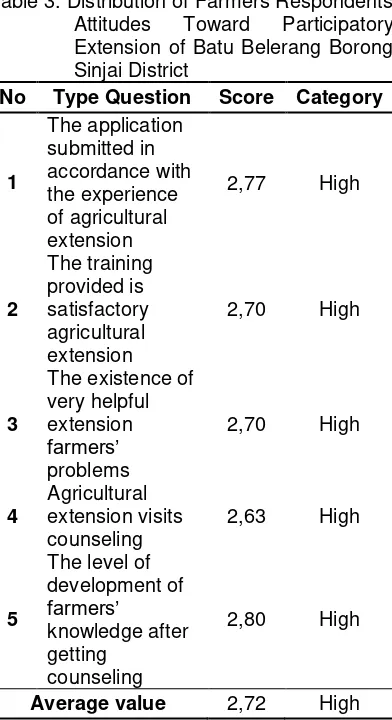
Mohammad Natsir, Sri Mardiyati PARTICIPATORY EXTENSION AND FARMERS ATTITUDE CHANGE (CASE PASSION FRUIT FARMERS IN THE VILLAGE BATU BELERANG SINJAI DISTRICT) ...42
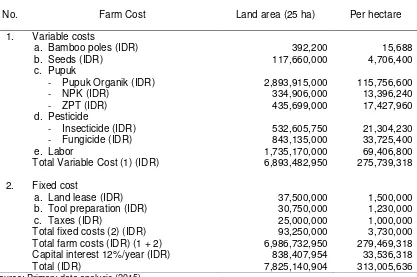
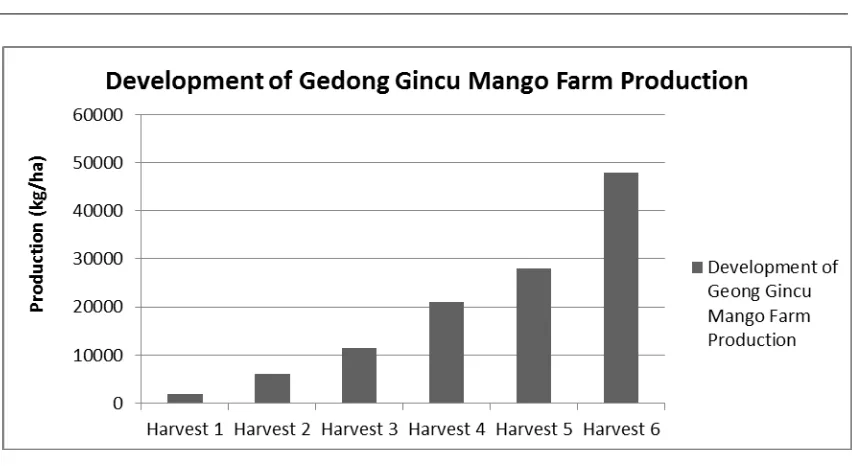
Muh. Arifin Fattah and Amruddin THE RELATIONSHIP BETWEEN EMPOWERMENT OF FARMER GROUP ASSOCIATION (GAPOKTAN) AND MANGO FARM INCOME ...47
Achmad Faqih, Nurul Atikah Fauzi, Siti Aisyah EFFECTIVENESS OF TRAINING MODEL ON CRAFTSMEN CALLIGRAPHY GOAT LEATHER IN AN ATTEMPT TO STRENGTHEN THE COMPETITIVENESS IN SUKOHARJO, INDONESIA ...57
Shanti Emawati, Endang Siti Rahayu, Sutrisno Hadi Purnomo, Ayu Intan Sari EFFORTS TO IMPROVE COMPETITIVENESS OF WOMEN FARMERS GROUP "MELATI" IN SENDANGSARI VILLAGE, PENGASIH DISTRICT, KULON PROGO REGENCY ...62
Siti Hamidah, Indah Widowati INSTITUTIONAL CHANGE AND ITS EFFECT TO PERFORMANCE OF WATER USAGE ASSOCITION IN IRRIGATION WATER MANAGEMENTS ...68
Mohammad Rondhi, Yasuhiro Mori, Takumi Kondo FOOD PROCESSING INDUSTRY EMPOWERMENT EFFECTIVENESS IN BANGUNTAPAN SUB-DISTRICT, BANTUL, YOGYAKARTA SPECIAL REGION ...76
x
EFFECTIVENESS OF WELFARE DEVELOPMENT SCHEME ON QUALITY OF LIFE TO RURAL POOR COMMUNITY IN MALAYSIA ...93 Mohd Nizam Abdul Aziz, Fazlin Ali, Zainal Abidin Mohamed and Hanina
Halimatusaadiah Hamsan
ASSOCIATION BETWEEN SOCIO-DEMOGRAPHIC CHARACTERISTICS WITH PINEAPPLE FARMER’S KNOWLEDGE, SKILLS AND PRACTICES IN MALAYSIA . 106 Melissa Alina Yusoff, Norsida Man, Nolila Mohd Nawi, Khadijat Jaji
MARKET STRUCTURE AND ANALYSIS OF SEA FISH MARKETING AT DISTRICT OF JEMBER... 112 Syamsul Hadi, Edy Sutiarso, dan Henik Prayuginingsih
MARKET STRUCTURE, EFFECTIVENESS, AND EFFICIENCY OF THE RUBBER RAW MATERIALS MARKETING IN MUSI RAWAS DISTRICT ... 121 May Shiska Puspitasari
ANALYSIS OF BEEF SUPPLY CHAIN MANAGEMENT AT AGRIBUSINESS BASED SLAUGHTERHOUSE IN UPTD OF ANIMAL SLAUGHTERHOUSE OF PALU ... 129 Muh Zulfadhli Prasetyo, Yulianti Kalaba, Lien Damayanti, dan Erny
ANALYSIS OF INFLUENCE OF MARKETING MIX AGAINST PURCHASE DECISION OF GROWING UP MILK ON THREE SOCIO-ECONOMIC CLASS IN MALANG ... 139 Sunardi, Jabal Tarik Ibrahim, Anas Tain
TRANSACTION COST ANALYSIS ON CARDAMOM MARKETING IN PADASARI VILLAGE, CIMALAKA DISTRICT, SUMEDANG REGENCY ... 152 Ermalinda Zebua,Juarini, and Nanik Dara Senjawati
RICE SEEDS MARKET STRUCTURE IN EAST JAVA ... 161 Rini Dwiastuti, Riyanti Isaskar, Nur Baladina, Tri Wahyu Nugroho
NUTMEG’S (MYRISTICA FRAGGAN HAITT) ANALYZE MARKETING MARGIN AND EFFICIENCY OF TANJUNG SANI VILLAGE TANJUNG RAYA SUBDISTRICT AGAM DISTRICT ... 177 Devi Analia, Faidil Tanjung, Syofyan Fairuzi dan Ramita Sari Pimura
THE EFFICIENCY OF SUPPLY CHAIN EMPING MELINJO IN BANTUL REGENCY YOGYAKARTA ... 183 Eni Istiyanti, Diah Rina Kamardiani
VALUE CHAIN OF PINEAPPLE IN MALAYSIA ... 191 Norsida Man, Nolila Mohd Nawi, Khadijat Jaji, Melissa Alina Yusoff
DYNAMIC SYSTEM OF INDONESIAN HALAL MEAT INDUSTRY: SUSTAINABLE SUPPLY CHAIN MANAGEMENT PERSPECTIVE ... 206 Akhmad Mahbubi, Pita Merdeka
ANALYSIS OF THE PROFITABILITY OF DAIRY FARMERS BASED ON THE SCALE OF LIVESTOCK OWNERSHIP IN DISTRICT SEMARANG ... 216 Mukson, S.I.Santoso, H.I.Nisa, H. Setiyawan and M. Handayani
DEVELOPMENT STRATEGY OF LEADING COMMODITY THROUGH COMMUNITY-BASED ENTERPRISE IN INDONESIA-MALAYSIA BORDER AREA ... 223 Jangkung Handoyo Mulyo, Irham, Hani Perwitasari, Fatkhiyah Rohmah
BUSINESS DEVELOPMENT STRATEGY SOYBEAN SAUCE PRODUCTION IN CAP
BAWANG SOY SAUCE COMPANY AT NGAWI REGENCY ... 230 Feti Munika Sakti, Mohamad Harisudin, Raden Rara Aulia Qonita
xi
MICRO ENTREPRENEURS’ INTENTION TO BECOME MEMBER OF MICROCREDIT SCHEME WITH EDUCATIONAL TRAINING AND MOTIVATIONAL PROGRAM ... 250 Rika Terano, Zainalabidin Mohamed and Fatin Najiha Mohd Tammili
FARMING INCOME ANALISYS OF DRY LAND IN THE GUNUNGKIDUL DISTRICT ... 257 Aris Slamet Widodo, Retno Wulandari
ANALISYS OF FACTOR THAT INFLUENCE THE DEMAND FOR ORGANIC
VEGETABLES IN MEDAN ... 264 Sasmita Siregar, Hadriman Khair, Yudha Andriansyah Putra
RICE CONSUMER BEHAVIOR IN THE MUSI RAWAS DISTRICT ... 272 Zaini Amin
ANALYSIS OF CONSUMER PERCEPTIONS AGAINST LOCAL AND IMPORT
FRUITS IN MEDAN ... 280 Hadriman Khair
CONSUMERS’INTENTION TO PURCHASE GENETICALLY- MODIFIED SOYBEAN PRODUCTS IN MALAYSIA ... 288 Welson Chin Vui Son, Kelly Wong Kai Seng, and Juwaidah Sharifuddin
CONSUMER PREFERENCE TOWARDS ORGANIC VEGETABLES AT SUPER INDO SULTAN AGUNG YOGYAKARTA ... 299 Nisa Murty Andari, Widodo, Sriyadi
STRENGTHENING THE ECONOMIC OF FOREST FRINGES COMMUNITY
THROUGH MODEL FOR ENHANCING LOCAL CATTLE COMPETITIVENESS ... 306 Teguh Hari Santosa, Toni Herlambang, Nurul Qomariah, dan Oktarina
FACTORS AFFECTING THE PRODUCTION AND BENEFIT ON THE PLANTING SYSTEM OF JAJAR LEGOWO AND TEGEL IN THE DISTRICT MUSI RAWAS ... 317 Nila Suryati
PLANTING DISTANCE AND DOSE OF ORGANIC MANURE ON THE SOIL
CHEMICAL PROPERTIES AND YIELD OF LOWLAND RICE ... 324 Abdul Azis and Damasus Riyanto
TECHNOLOGY ADOPTION OF HIGH QUALITY GREENBEANS SEED BY
FARMERS’ HOUSEHOLD IN CENTRAL JAVA ... 334 Wiludjeng Roessali, Wahyu Dyah Prastiwi, Tutik Dalmiyatun
PRODUCTION EFFICIENCY OF IRRIGATION LOWLAND ORGANIC PADDY
FARMING SYSTEM AT BAROKAH FARMER’S GROUP IN SEMARANG REGION . 340 Titik Ekowati, Edy Prasetyo, and Bambang Trisetyo Eddy
THE FARMER’S KNOWLEDGE AND ATTITUDES FOR ENVIRONMENTAL
FRIENDLY OF SHALLOT CULTIVATION IN BALI ... 346 Nyoman Ngurah Arya, I Ketut Mahaputra, Suharyanto, Jemmy Rinaldi
THE ANALYSIS OF A VERTICALLY INTEGRATED ORGANIC RICE COMPANY: A CASE STUDY IN THAILAND ... 354 Yaniga Prasertwattanakuland Pornthipa Ongkunaruk
EFFECTIVENESS AND GROUP COMMUNICATION NETWORK ... 361 Indardi
xii
INCREASE RICE PRODUCTIVITY TROUGH MODELS OF CROPPING SYSTEMS AND THE USE OF HYBRID VARIETIES ... 379 Suharno, Rika Nalinda
THE FARMER’S PERCEPTION TO THE USING OF TECHNLOGY AFTER PADDY’S HARVEST IN SOUTH SULAWESI ... 386 Irmayani, Hariyono, Nur Rahmah Safarina Hamzah
VALUATION IRRIGATION OF RICE FARMING AT UPSTREAM AND DOWNSTREAM AREAS IN SPECIAL REGION OF YOGYAKARTA ... 392 Habibullah, Triyono, Aris Slamet Widodo
RICE FARMER’S PERCEPTION AND ITS EFFECT TOWARD INTENTION TO
ADOPT ORGANIC FARMING ... 399 Ashari, Juwaidah Sharifuddin, Zainal Abidin Mohammed, Rika Terano
1
RICE SELF-SUFFICIENCY IN INDONESIA: AN ANALYSIS ON
BUDGET ALLOCATION AND THE ACHIEVEMENT
Sri Nuryanti1*
1) Graduate Student at Bogor Agricultural University
Reseach Associate at Indonesian Center for Agricultural Socio Economics and Policy Studies, Jl. A. Yani 70 Bogor
*corresponding author: [email protected]
ABSTRACT
Rice is the main staple food of Indonesia and being a strategic and important commodity as it has upstream and downstream linkages connecting many stakeholders from input to output markets. Any regimes of the Government of Indonesia take it into account and conduct many agricultural programs in order to achieve rice self-sufficiency through production, post harvest, marketing, trading and price stabilization policies. Budget had been allocated through related ministries to support any programs achieving rice self-sufficiency targets. This study aimed to evaluate the program achievement by comparing budget allocation and rice self-sufficiency ratio as the indicator. The result showed that budget allocation of rice self-sufficiency tended to increase, while rice self-sufficiency ratio tended to decrease, thus rice self-sufficiency had not been achieved yet. The result implied that Indonesia should stabuilize rice reserve and rice price by reducing import dependency of rice. that budget allocation tengrew positively, while rice self-sufficicency ratio grew negatively. It concluded that the more budget allocation did not solely push target achievement of rice self-sufficiency.
Keywords: rice, self sufficiency, budget.
INTRODUCTION
Rice self-sufficiency policy is an important part of agricultural development program of Indonesia (Baharsjah et al., 2014). Along with agricultural history Indonesia, during 1970-1990 rice development not only reached the highest yield rate by 4.1 percent/year, but also the highest rate of production, it was 5.6 percent/year. Therefore Indonesia reached rice self-sufficiency (Sawit, 2014) and could be said that all applied programs related to rice self-sufficiency were effective and efficient (Heyten, 1991; Mears, 1981; Sawit, 2014).
New Order Regime gave many supports from on farm level to off farm level, post harvest, and marketing activities by developing simple rice miiling unit, providing financial support through low interest credit, and stabilizing rice price through parastatal function of State Trading Enterprise, i.e. National Food Authority (Badan Urusan Logistik/Bulog) to achieve self sufficiency target of rice (Amang dan Sawit, 2001; Mears, 1981).
It showed that rice self-sufficiency was achieved by involving many stakeholders, starting from the government as policy maker, farmers as producer, state trading enterprises (producer of fertilizer, chemical, rice market controller), traders, cooperative,
extension workers, banks, and
2
METHOD
Data
Secondary data from 2005 to 2015 was used in this study. Period of analysis started from 2005 to 2015. Budget data came from Ministry of Finance, while data of production, import, and export of rice came from Ministry of Agriculture.
Method Analysis
Quantitative analysis was done to compute average annual growth rate of budget allocation of rice self-sufficiency program, rice production, rice import, rice export and rice self-sufficiency ratio along analysis period. Data of rice production, rice import, and rice export were used to compute rice self-sufficiency ratio by using this formula:
SSR = �
�+ −� (1)
P is production quantity, M is import quantity, and X is export quantity.
Qualitative analysis was done by using method developed by Bamberger (2000 cit Schouwtra and Ellman, 2006), that follows analytical framework that comprise six steps of policy cycle by evaluating (1) target (strategy), (2) objective (operational target), (3) method/instrument (choice, alternative,
critical factor), (4) activity (measurement base, target measurement), (5) performance (indicator), and (6) evaluation (comparing between fact and target).
RESULT AND DISCUSSION
Result
In order to achieve rice self-sufficiency target, the government allocated budget through two ministries, Ministry of Public Work and Residential and Ministry of Agriculture. The government allocated budget subsidy, government expenditure, and transfer to regional governments.
Subsidy was provided in kind of food, seed, and credit interest. Government expenditure was provided in kind of governmental rice reserve, food stabilization reserve, national seed reserve, and food security reserve. On regional level, budget was allocated for irrigation and other agricultural activities, through transfer mechanism.
The allocated budget for rice self-sufficiency from 2005 to 2015 tended to increase from IDR 3.4 trillion in 2005 to IDR 22.0 trillion in 2015 and showed positive average annual growth rate by 14.7 per cent/year (Figure 1).
Figure 1. Budget Allocation for Rice Self-Sufficiency, 2005-2015.
In the mean time, rice production increased from 35.8 million ton in 2005 to 44.7 million ton in 2015, rice import
increased from 195 thousand ton in 2005 to 472.7 thousand ton in 2015, and rice export decreased from 44.9 thousand ton
0 10 20 30 40 50 60
2005 2006 2007 2008 2009 2010 2011 2012 2013 2014 2015
Budget Allocation, 2005-2015
3 in 2005 to 2.9 thousand ton in 2015. The average annual growth rate of rice production, rice import, and rice export were 2.5 percent/year, 7.0 percent/year, and 11.3 percent/year respectively. By using Equation (1) it was found that rice self-sufficiency ratio from 2005 tp 2015
decreased from 99.6 percent to 99.0 percent. Therefore, the average annual growth rate of rice self-sufficiency ratio was -0.1 percent/year or negative (Figure 2).
Figure 2. Rice Production, Import, Export, and Self-Sufficiency Ratio, 2005-2015.
Discussion
Based on the finding above, it was known that budget allocation of rice self-sufficiency program tended to increase, while rice self-sufficiency tended to decrease indicating by one of indicator, i.e. self sufficiency ratio. The budget was dominated by subsidy, following by transfer and government expenditure.
This finding was in line with Amang and Sawit (2001) that subsidy was provided starting from on farm and off fram activities to marketing activities, from regional level to national level, from individual life support to collective or public investment. Seed subsidy was given to support encourage farmers applying recommended dosage of fertilizers, especially urea, the most influencing fertilizer on rice yield (Osorio et al., 2011).
Based on Sawit (2001), the other types of subsidy that given by government according to rice self-sufficiency program were concerned as general food subsidy. Nevertheless, those kinds of subsidy might have impact on price depression in domestic rice market, thus deteriorated
performance of domestic market price stabilization.
In the same analysis period, rice production and rice import increased significantly. However, the average annual growth rate of rice import was higher than rice production, so rice self-sufficiency ratio decreased accordingly. From 2005 to 2015, rice self-sufficiency ratio changed from almost maximum level by 99.6 percent then fluctuated between 94.0 percent and 99.4 percent.
Even though rice production increased continuously from 2005 to 2015, the number of population was also increased. Consequently, the government had to meet domestic rice supply and demand. In case of shortage of domestic rice supply, the government would delegate Bulog to import rice to stabilize domestic rice market and national rice reserve in certain months beyond main harvest time that generally happens from March to August.
Above facts proved that rice is the most impotant food stuff as mentioned in previous studies, so the government should control the market to avoid economical and political issues according
0 10000 20000 30000 40000 50000
90% 92% 94% 96% 98% 100% 102%
2005 2006 2007 2008 2009 2010 2011 2012 2013 2014 2015
0
0
0
to
n
SSR
Rice Production, Import, Export, and Self-Sufficiency Ratio, 2005-2015
4 to rice price and supply, even though by importing rice.
Furthermore, rice was being industry by creating jobs in rural area, supporting household security and rural development in Indonesia (Sawit and Lokollo, 2007). Most of rice producers were smallholders and only few medium and large industries worked on rice (Masyhuri dan Novia, 2014). Rice was consumed by 95 percent of Indonesian population (Amang and Sawit, 1999), while only 15 million households produced rice (Anggoro, 2014) using small sized land less than a hectare (Masyhuri and Novia, 2014; Suryana et al., 2001). The producing farmers included including landless that reached 70 percent of farmers and net consumer that accounted for 60 percent (Suryana, et al., 2001). In accordance with rice characteristics above, government intervention was needed (Hariadi dan Yamin, 2014).
The availability of rice had strong relationship with national economy of Indonesia. Rice issue could extend to social and economic issues. Rice production failure, increasing rice price, and shortage of rice supply could trigger political issue and imply on national stability (Subejo, 2014). One of efforts of the government to manage domestic rice availability was by implementing rice self-sufficiency program as mentioned above. Technological breakthrough on production and post harvest activities were done to improve rice production level effectively and efficiently from upstream level to downstream level, including human resource empowerment and institutional capacity building (Subejo, 2014).
Based on Bamberger (2000 cit Schouwtra and Ellman, 2006), it showed that (1) one of rice self-sufficiency targets/strategies was achieved, it was production increase, (2) the operational target or objective had not been achieved yet, such as stable national rice reserve, zero import, and stable domestic rice price, (3) the choice of policy method/instrument were subsidy, government expenditure, and transfer to regional governments through two
ministries and the budget of the three instruments tended to increase, (4) the target measurement of rice self-sufficiency had not been achieved yet, (5) the performance indicator was rice self-sufficiency ratio, during the analysis period the indicator tended to decrease, and (6) until the end of evaluation period in 2015 the fact showed that rice was not self sufficient. In general, the indicator showed that rice self-sufficiency program had not achieved effectively and efficiently yet.
From economy point of view, self sufficiency policy was concerned as a non efficient policy because self sufficiency policy would affect on budget allocation for other commodities instead of targeted commodity. Therefore, budget would be allocated more for targeted commodity while for other commodities would be less. As consequence, the production level of targeted commodity could increase, while other commodities might decrease. On national level, the aggregate income could decrease as the magnitude of production cost for targeted commodity increased target swasembada (Monke and Pearson, 1989).
5
CONCLUSION
Based on discussion above, it concluded that budget allocation of rice self-sufficiency tended to increase, while rice self-sufficiency ratio tended to decrease, thus rice self-sufficiency had not been achieved yet. The result implied that Indonesia should stabuilize rice reserve and rice price by reducing import dependency of rice.
REFERENCES
Amang, Beddu and M. H. Sawit. 2001. Rice and National Food Policy Lesson Learn from New Order and Reformation Order. Second Ed. IPB Press, Bogor.
Anggoro, U. K. 2014. Fight for Food Sovereignity under Comparative
and Competitive Advatages
Framework. Fightful Establishing Food Sovereignity The Voice from
Bulaksumur. Gama Press.
Yogyakarta.
Baharsjah, Sjarifudin, Faisal Kasryno, and Effendi Pasandaran. 2014. Political Reposition on Agriculture New Hacking Direction in Agriculture Development. Yayasan Pertanian Mandiri. Jakarta, 5.
Hariyadi, S. S. and A. Yamin. 2014. Rice Policy and Life Destiny of Smallholders. 2014. Rice Economy of Indonesia. Bayu Krisnamurthi Ed. IAES.
Heytens, Paul. 1991. Rice Production Systems. Pearson et al. Ed. Pearson, Scott, W. Falcon, P. Heytens, E. Monke, and R. Naylor. 1991. Rice Policy in Indonesia. Cornell University Press, Ithaca and London: 38-57.
Masyhuri and R. A. Novia. 2014. Rice Marketable Surplus. Rice Economy of Indonesia. Bayu Krisnamurthi Ed. IAES.
Mears, L. A. 1981. The New Rice Economy of Indonesia. Food Research Institute, Standford University.
Monke, J. and S. R. Pearson. 1989. The Policy Analysis Matrix for Agricultural Development. Cornell University Press, Ithaca, New York. Ortiz, Jaime. 1999. The Role of Interest Groups in Agricultural Policy Design: Chile 1960-1988. Journal of International Development, 11: 241-258 .
Osorio, C. G., D. E. Abriningrum, E. B. Armas, and M. Firduas. 2011. Who Is Benefiting from Fertilizer Subsidies in Indonesia. Policy Research Working Paper. 5758, The World Bank.
Sawit, M. H. 2001. Rice Price Policy: New Order and reformation Period. Vademecum of Rice Economy. LPEM UI, Jakarta: 123-150.
Sawit, M. Husein and E. M. Lokollo. 2007. Rice Import Surge in Indonesia. Collaborative report between ICASEPS and The ActionAid International. Bogor.
Sawit, M. Husein. 2014. The Performance of Rice Self-Sufficiency in The Last Five Deacdes: Agenda for New Government. The Direction and Challenges for The New Agriculture Development 2014-2019. IAARD Press: 1-36.
Schouwstra, M. and Ellman, M. 2006. A New Explanatory Model for Policy Analysisand Evaluation. Tinbergen Institute Discussion Paper. TI 2006, 063 2.
Subejo. 2014. Rice and National Food
Problem. Rice Economy of
Indonesia. Bayu Krisnamurthi Ed. IAES.
Suryana, Achmad, S. Mardianto, and Review Team of National Rice
Policy (Indonesia). 2001.
Vademecum of Rice Economy. Investigating Institute of Economy and Community, Economic Faculty of Indonesia University.
Swinnen, J. and F. A. van der Zee. 1993.
7
DISCUSSION FROM PARALLEL SESSION
PAPER TITLE Rice Self-Sufficiency in Indonesia: An Analysis on Budget
Allocation and The Achievement
AUTHOR Sri Nuryanti
DISCUSSION
QUESTION
- What is the reason why the correlation is negatif? Budget allocation may be in supply demand and trade activites - What is the measurement effiency?
ANSWER
SUGGESTION
- Abstract, there should be method mentioned - Abstract not concret, your research is very simply
8
MODELING OF COOPERATION TO IMPROVE RURAL
ECONOMIC IN LANGKAT
Muhammad Buchari Sibuea1*
1Department of Agribusiness, Faculty of Agriculture
Universitas Muhammadiyah Sumatera Utara *corresponding author: [email protected]
ABSTRACT
Koperasi Unit Desa is a representation of public institutions should be able to become a pillar of the economy right in the rural, although currently experiencing a crisis of confidence. The research aims to improve the effectiveness and efficiency of service cooperatives in increasing the members' income. Outcomes research resulted in the cooperative model is ideal as an economic institution efficient, effective in increasing the members' income. The study was conducted in Langkat where the population are Koperasi Unit Desa’s active in the agricultural sector. The sampling technique used purposive random sampling. Research methods and development with a preliminary survey measures, planning models, test models, model validation and dissemination. Research instruments include a questionnaire, recording documents and tests. Data were analyzed by using descriptive analysis and t test. The initial stage of analysis cooperative services that match the demands of the members, then the appropriate service strategy used in the agricultural sphere. Also the analysis of the needs of members with regard to farming, so found materials to create a model for cooperative services that serve as the ideal next research materials. The results showed a success rate of cooperatives in rural economic development is influenced by many aspects such as the characteristics of the members, basic capabilities, management and performance of cooperatives. Best cooperative model is consistent with the character and potential of the community. There is a very close relationship between the aspects examined by the success rate of the cooperative. The government's role in building the economy is expected to create policies that favor the cooperatives. Build strong through Koperasi Unit Desa to exploit the potential of the community is the best way to build the economy so as to form agri-based cooperatives. The implication being offered is that in designing a development, should be implemented according to the characteristics and potential of an integrated approach to the region.
Keywords: cooperative, the rural economy
INTRODUCTION
In the implementation of agricultural development in Indonesia have always found very fundamental issues that comes from the inability of farmers. For example, ownership of resources or factors of production and limited production facilities owned so as to make the farmers trapped in a system that is very detrimental. This situation is exacerbated by the inability to manage his farm and ignorance about the importance of communication and interaction with the surrounding environment, including the importance of an institution.
According to Mosher (1966) in order to build advanced and progressive rural
structure, there are three institutions that should exist in the villages, namely (1) the existence of the marketing agency for agricultural inputs; (2) the existence of counseling or educational institution for farmers and (3) their financial institution or funding. Should the presence of an institution can register complaints or concerns of farmers and provide the best solution. With a strong institution, essentially farmers can minimize weaknesses and maximize the strengths of farmers were geared towards increasing revenue economically and sociologically mental attitude.
9 the largest area, so this study is expected to be a representation of a phenomenon that is found in cooperative institutions in other districts in North Sumatra. Although in general the characteristics and cooperative phenomena in North Sumatra is the same, but it must be recognized that this area has different characteristics that are not found in other districts.
The basic weakness that
characteristic the classical economic thinking, among others, the notion that environmental factors including institutional structure, the external factors are thought to remain, so the cooperatives are only described by behavioral technology. Companies theory like this same to the theory of production that causes people to see the cooperative as an aggregate (Pakpahan, 1990). Unconsciously, these thoughts coloring inspiration developing countries in planning their economic, environmental and institutional whereas a factor that will determine the success of an optimal utilization of resources in economic development to improve the welfare of the community. According to Todaro (1984) village economic development contain elements (1) technological and social innovation, (2) information, (3) incentives, (4) infrastructure, (5) investment and (6) the institution or institutions. The first aspect to the fifth aspect are complementary with each other, while the sixth is fifth manipulate the elements above.
One form appropriate for the institution and has been built in the village is the Village Unit Cooperatives (KUD). Options to KUD determined by the considerations in terms of ideology and of the rules of rational economic institutions needed to meet the requirements. Cooperative institutions is intended to provide a forum for the process of allocating resources optimally in the village.
KUD in Indonesia has increased both the number and quality of members although fluctuated sharply and has not been as expected. But KUD activities that are closely related to the services, the quantity decreased business volume and
the value of capital. Changes to government policies also influence changes in the performance of KUD. This is evident from the decline in the average amount of business in addition to the increasingly strong relationship between business activities KUD on government programs. Activities of the government program basically aims in addition to improving the welfare of farmers as well as a means to collect and capital accumulation and perform a wide variety of efforts towards self-help business development are closely related to the needs of members. Expected capital program activities as a driver capable of making cooperatives as an independent business (Asaad and Mhd. Buchari Sibuea, 2008).
Another problem faced by the cooperatives is unfavorable image, low participation of members, difficult integration of farmers, fishermen, other business groups, low partnerships with related institutions as well as the slow pace of business development. These are show that the optimization activities in the economic and social fields is still doubtful (Cook, 1995).
Empirically, some facts become the source of problems encountered in the development of cooperatives is (1) Field of the organization, especially in terms of fittings cooperatives have not functioning properly; the implementation of the annual meeting of members not yet effective and
timely manner; membership
10 Monitoring and audit systems, especially in terms of inadequate supervision and control; the ability of the auditing body is very weak; development of audit services is still very weak; (4) Aspects of undeveloped business activities in various sectors of the economy; network/chain of distribution in geographic coverage is not adequate; the limited ability of business
manager KUD; inadequate means
business ownership; capital growth efforts alone have not been able to run effectively and efficiently; amenity or facility for the implementation of activities has not been absorbed and used based on the principles of efficiency and effectiveness; planning business activities are still weak; (5) Environmental aspects, especially in terms of the spirit of joint effort is still weak; wisdom and bank systems do not support the growth of cooperatives; implementation support and political will has not been effective; research activities are still not able to support the purposes of fostering an integrated territory (Sibuea, 2011).
Cooperatives activities an important role in the Indonesian economy which represents a constitutional form of business for the nation of Indonesia as stated in article 33, paragraph 1 of the UUD 1945 where it is stated that the economy is structured as a joint venture on family principles. The consequence is supposed that in any national development dynamics should continue to provide a large space and the cooperative movement, because it is considered a manifestation of the existence of social economy. In the execution of the cooperative is run through Act No. 25 of 1992 regarding cooperatives and Presidential Decree No. 18 of 1998 on an increase in the promotion and development of cooperatives.
KUD is a vital enterprise for rural communities to stimulate and improve the performance of farmers so that the resulting increased production of both quantitative and qualitative. KUD is a collection of people who work together to meet one or more of economic necessity or partnership to do business that is very clearly different from other types of
businesses, which are typically oriented to capital and profit earned (Edi Cahyono, 1998). Cooperative prefers human factors and work on the basis of the economy for the welfare of the members. Nevertheless the situation cooperatives are not charity institution.
Key to progress is essentially cooperative lies in its ability to collect savings from members and the business surplus in the form of net income. With stronger capital and the ability to serve members better, then the agricultural cooperative course will gain wider confidence in the midst of society so that it will further increase the number of cooperative members (Lubis, 2007). His ability is stronger it will allow the cooperative to accommodate the aspirations of members of other communities so that the scope of the cooperative can include diverse activities. In this context is expected that the cooperatives could be a basis for activities once a pillar of the rural economy (Ropke, 2005).
The agricultural sector in general is one of the prime movers are intended to increase national production, improving people's living standard is a lot that most of them work in the agricultural sector and to create a strong foundation for the implementation of development gradually. In the context of the implementation of these objectives, since the beginning of nation-building, development of the agricultural sector has been placed as the first priority is gradually directed toward economic development (Baharsjah, 1985).
The objective conditions in the study area are perceived less optimal
co-operation between farmers and
cooperatives in the shelter business distribution, marketing of palm oil and the lack of participation by farmers to the cooperative and vice versa is still not good service cooperatives that have not been touched for all levels of members.
11 as many as 4,612 people which include the auditing body, trustees, managers and employees/employee. The cooperatives spread over 20 districts.
While in terms of formal educational qualifications of implementing cooperative visible is dominated by graduates SMTA equal (50.43%) and graduates SMTP
equal (26.69%) were in fact very unfavorable performance of a cooperative education that they took not much less specific. Even if traced further seen that there are as many as 60 people who did not finish primary role as a caretaker and 50 employees do not complete primary school. Learn shown in Table 1 below.
Table 1. Number of KUD According Implementing Formal Education Level
Education BP Trustees Manager Employee Total Percent (%)
PT 121 13 21 30 185 4.01
Akad. 468 71 17 85 641 13.90
SMTA 720 1344 52 210 2326 50.43
SMTP 216 936 12 67 1231 26.69
Non SD 112 60 - 57 229 4.93
Total 4612 100
Source: BPS, 2014
METHOD
Research Approach
Overall research using methods of research and development (Borg and Gall, 1983). According to the model approach to research and development, the implementation is to follow these steps: a preliminary survey, planning models, test models, model validation and dissemination. Meanwhile, to determine the effect of cooperative management model developed approach is quasi experimental design with control group post-test only.
Place and Time Research
The study was conducted at the Village Unit Cooperatives (KUD) based agriculture is still active in Langkat. Selection of study area was made because: First, Langkat is one of the districts with the largest area in North Sumatra province, so it will be very representative of the existence of cooperatives that there are other areas in North Sumatra. Second, that Langkat has the diversity and the number of institutions is pretty much moving in the village by focusing attention to the economic development of the village. In 2012 there were 36 KUD and 429 non KUD spread in 20 sub-districts located in Langkat. The
number of members of KUD and Non KUD in 2012 is estimated at 127.439 inhabitants. Thirdly, that this area is central to the production of food crops and plantations are very big potential, because in terms of the value of GDP Langkat agricultural sector is the biggest contribution. Fourth, the election Langkat as an area of research is also based on the fact that although the quantity has a number of KUD are many but the quality is very low.
Population and Sample
The study population was KUD still active based agriculture in Langkat to the target population among other members, administrators, managers, supervisors
and employees and supervisors
12 and KUD Rahmat Tani considering both KUD have the largest number of members and in accordance with the characteristics of the study.
RESULT AND DISCUSSION
Economic Potential of North Sumatra
Langkat economic potential is closely connected with the state of geography and topography. This area has significant potential, especially in the construction of agricultural commodities, agriculture, forestry, fisheries and tourism. Based on data from the GDP shows that the main source of livelihood and most potential are agriculture and associated with it. Since 2000 until now, even the majority of the GDP comes from the agricultural sector are far superior compared to other sectors.
Based on data obtained from the Kementerian Perkebunan dan Kehutanan (2007) that the plantation commodities is a flagship in the region so that these commodities should be developed and managed professionally. Commodity plantations is a leading oil palm, cocoa, rubber, sugar cane, coffee and coconut. With the commodity, the government together with the people trying to manage this potential is such that plantation companies both public and private national and foreign, and the people (who in this case are managed by private and cooperative) sign and present to the region. Data shows that there are four components companies present in the region, namely (i) smallholder, namely plantation business is actually managed by the people or groups of people together for example through the Village Unit Cooperatives with a total area of 90.250 hectares; (Ii) country estate,
professionally managed by PT
Perkebunan Nusantara area of 64.694 hectares; (Iii) national private plantations, professionally managed by a plantation company in the country covering an area of 27.211 hectares and (iv) a foreign state-owned company covering an area of 11.577 hectares.
Characteristics of Respondents
The majority of respondents were men with an ownership of 93.87% of the total members, whereas the cooperative management are all men. While the average age was 47 years and most are ranging between 45-55 years including mature age category. Formal education cooperative members are relatively varied, most are graduates of junior high school or the equivalent of 37.5%. As the level of formal education graduated from high school board majority is equal as much as 54.17%. But the non-formal education or education cooperative owned by its members and cooperative management of the majority there is as much as 80% is included in the low category. As for the number of dependents of members of the majority were cooperative in many categories of 5-6 people as much as 35.53%.
Overall cooperative members have become members with an average year, while the board 10:34 15:32 years. The majority of the length of a member is very old category as much as 67.93% and the cooperative management including very old category that is equal to 83.33%.
Members Basic Capabilities
In order to facilitate the process of adaptation to a person to enter into cooperative would require fairly deep search of the aspects of basic knowledge possessed, motivation, adaptability, cosmopolite members. For it is necessary to obtain information relating to the level of ability of members in terms of motivation to become members, the cooperative basic knowledge, adaptability to the existence of cooperatives, cosmopolite.
13 the activities of the cooperative middle category that is equal to 42.93%.
There are various indicators to determine the level of basic knowledge of members, among others: (1) the existence of a cooperative which is a joint venture, (2) the benefits of cooperatives in obtaining additional revenue, business loans, goods daily necessities at lower prices and the science of how trying to be better, (3) the purpose of cooperatives, especially in improving the ability of the economically disadvantaged, improving the socioeconomic status of the community, spurring rural development, increasing members' knowledge through counseling, training and education on cooperatives and other skills, (4) about the purpose of the presence of cooperative members, especially in the case to avoid the practice of bonded labor, debt, improve social and economic life and add insight, (5) the function of cooperatives to help members of the shortage of venture capital through lending in accordance with the rights and obligations of members, (6) the cooperative membership between the other based on the similarity of the economic needs of the members, the nature of membership in cooperatives that contains elements of freedom, voluntary and openness, (7) the obligations of members in comply with the provisions or decisions of the meeting, (8) the right of members to obtain services and (9) in each year member entitled to receive the remaining results of operations. From the findings, it seemed the level of basic knowledge is narrow majority of 42.39% even some members are at the level of knowledge is very narrow at 5:43%.
Level members need to look very prominent production facilities where 75% of the members are in the category of need and very necessary to the availability of production facilities. Then there is 53.80% which is included in the category of being able to adapt to the situation and the social environment of physical cooperatives. Therefore, need to do more intensive socialization to the members on a periodic basis so that they
can interact and adapt more quickly to the cooperative.
Cosmopolite level is how far the intensity of the relationship of the cooperative members of the various sources of information that are outside the social system of the member itself, for example with the Agricultural Extension Workers, print media, electronics, government and private institutions. Therefore, the degree cosmopolite can be seen from (1) the relationship with the
members of new technological
discoveries agricultural resources; (2) how often listen to or monitor agricultural information sourced from print and electronic media, (3) member visits to shelters and marketing of agricultural products, (4) a visit to the pilot areas managed by the government agriculture and farmers more advanced in a comparative study, (5) a visit to the exhibition events agricultural production. The results showed that the majority of the members cosmopolite level included rare category that is 47.83%.
Perceptions member of the cooperative is known that the majority fall into this category amounted to 33.15% is good enough then included both category 25.54% and 21.74% very good category. While members expressed a bad perception to the cooperative each only 9.78% in poor or very poor category. The level of trust to the cooperative members known to the majority of the category of trust 29.35%, then 25% category of doubtful and very trusting of 15:22%.
14 included in the very low category as much as 47.83%, followed by as much as 32.61% lower categories. A very low number and phantasmagoric show that the cooperative members are less or not at all involved in order to construct a cooperative planning.
Participation in the conduct of members of KUD intended as active participation in the activities of cooperatives and the utilization of existing services for the purposes of the common welfare. The indicator used is the level of participation in terms of (1) utilizing or empower cooperatives to acquire the means of production, (2) utilizing KUD to obtain household purposes, (3) save or save money, (4) store savings, compulsory savings and voluntary savings regularly, (5) utilizing agricultural extension services and (6) utilizing credit granting services. Seen that members have sufficient participation and higher and higher because more than half the members are at a high enough level of participation as much as 32.07% as the majority of high and very high 30.43% and 14.67% for a total of 77.17%.
Indicators used to observe the level of participation in the field of supervision are (1) participate in supervising the business and financial cooperative monitoring either through meetings or indirectly, (2) participate cope with the loss of cooperatives and (3) come to feel sad if the cooperative is always a loss. The majority of cooperative members included in the category of extremely low at 38.59% following a low category 35.33% which means that half the members have a low participation rate in the context of supervision of the cooperative. Seen that the meager participation of members so that there is dominance of the board of the planning, implementation and supervision of cooperatives.
In the context of ministry of production facilities studied among other things of service (1) the availability and amount of the means of production, (2) ease of obtaining inputs especially fertilizers and pesticides in the form of credit facilities of production, (3) provide
guidance or counseling about using the production facilities either and true, (4) provide good production facilities and cutting-edge quality for farmers and (5) gives the prices of sold production facilities are always cheaper than in other markets. Service member cooperatives satisfied the majority fall into this category 40.22%, 33.15% are quite satisfied and very satisfied 13:04%. This means that more than half the member states are satisfied with the service provision of the means of production cooperatives.
Cooperative services to the provision and distribution of business loans to farmers studied among other things (1) the availability of credit facilities of business in sufficient quantities, (2) help members obtain business loans in accordance with its requirements, (3) providing small loans in accordance with the amount requested, (4) extension of business loans on time, (5) the provision of loan interest rates are set is a light floral or soft loans. The majority of member states including category are satisfied as much as 42.31% following the category quite satisfied 32.07%.
15 The level of satisfaction with the service cooperatives are seeing how far the members perceive the services it receives such a way with a variety of indicators, especially satisfaction in terms of (1) obtaining credit, (2) obtain and availability of production facilities, (3) market their agricultural products, (4) efforts to get an education cooperative's members, (5) disseminating information to members, (6) the provision of means of transport, (7) the process of storing savings and obligations of members, (8) distribution of net income, (9) provides training for its members and (10) processing results agriculture. The majority of member states quite happy and satisfied with the services provided by the cooperative, where as many as 34.24% of respondents categorized quite satisfied as much as 26.63% category are satisfied and even 19.02% very satisfied category.
Relationship of Characteristic, Member
Basic Capabilities, Performance
Against The Success of the Village Unit Cooperatives
According to the research there are many aspects which allegedly have close ties and influence the success of cooperatives in the context of economic development. Because cooperatives are considered capable of being a form of economic organization service centers, then these aspects became the focus of attention in the planning of cooperative activities in the future. These aspects include characteristics, basic abilities,
socioeconomic factors and the
performance of cooperative management. Some aspects of the characteristics of farmers referred members include (i) the level of formal education farmer cooperative members; (ii) non-formal education (in this case is the education of cooperative education and other fields are not formal); (iii) the length of a member (since the first entry into the cooperative members); (iv) the number of dependents (all dependents of heads of household and non-biological child birth); (v) the area of agricultural land cultivated (meaning all
cultivated land into farming activities to not look at the status of land ownership).
While aspects of the basic ability of farmers, among others, (i) motivation to enter cooperative members (consisting of three types of motivation is motivation for the needs, motivations because it expects profit and member motivation to follow the activities of cooperatives); (ii) the basic knowledge about the presence of members of the cooperative and everything associated with it; (iii) the level of the cooperative members' needs, especially with regard to the need for the availability of means of agricultural production; (iv) the ability of adjustment member of the social and physical environmental conditions of the cooperative itself; and (v) the level cosmopolite of member cooperatives to circumstances beyond the cooperative and outside of oneself.
Aspects of the management of cooperatives and the performance of the cooperative in this regard include (1) an increase in the attainment of the objectives of a cooperative received; (2) an increase in morale of members and cooperative management; (3) an increase in the sense of responsibility of each member and the board; (4) an increase in the seriousness of work; (5) increase the satisfaction of members and cooperative management; (6) an increase in the confidence of the board members of the cooperative; (7) an increase in the desire of members and administrators to get a cooperative education; (8) increased promotion of cooperatives both by members and officials and (9) an increase in donations from members and officials to the cooperative.
16 right time and the right amount of repayment of the loan; (6) the level of income (both from farming activities as well as outside of farming) and the level of expenditure from the cooperative members; (7) the perception of members of the cooperative; (8) the perception of the level of trust of the members of the cooperative; (9) the perception of the level of participation of members of the cooperative; (10) the perception of the level of cooperative services to members; (11) the perception of the level of satisfaction of members of the cooperative services.
In connection with these variables, this study analyzes the factors that influence the success of cooperatives in building the rural economy in terms of various aspects as described above. What this means is that other aspects of the characteristics of the farmer members, the basic ability farmer members, socioeconomic aspects farmers and members of their management and performance of the cooperative effect on the success rate of the cooperative economic development in the village.
To analyze the relationship between the above factors used chi square test and also to calculate the value of X2 and contingency coefficient C (Sugiono, 2003).
In order for the price of C obtained can be used to assess the strength of the relationship between the value of the factor C need to be compared with the maximum contingency coefficient where the maximum price of C was calculated using the formula (Sudjana, 1996).
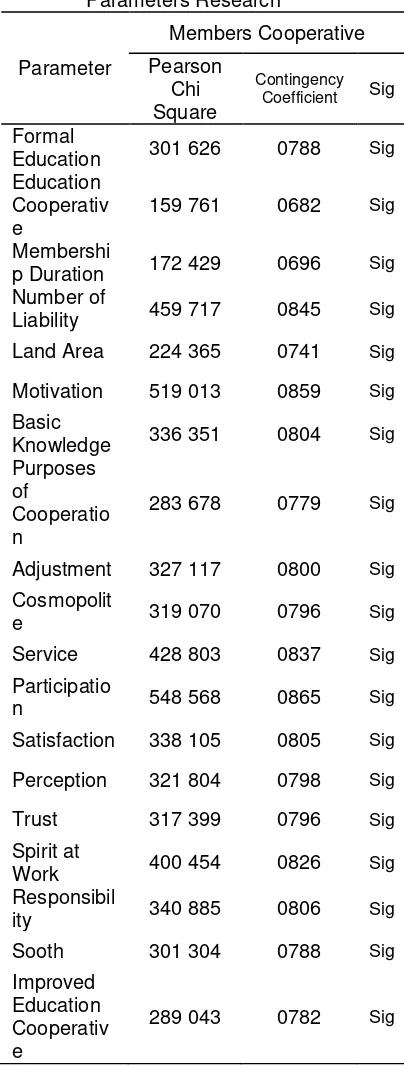
Based on the results of testing non-parametric statistical performed using SPSS (Statistical Package for Social Sciences) obtained the resumes of the data processing are shown in Table 2, which contains parameters or variables studied (factors of socioeconomic, handling, performance, characteristics of the farmer members and the success rate of the cooperative). Then load the Pearson Chi Square to see whether or not a significant relationship between factors and contingency coefficient to see the strength or the relationship between the
factors studied. And last, made a record of significant or not significant relationship between independent variables and the dependent variable is the level of success of cooperatives.
Table 2. Analysis of Relationship between Parameters Research
Parameter
Members Cooperative
Pearson Chi Square
Contingency
Coefficient Sig
Formal
Education 301 626 0788 Sig
Education Cooperativ e
159 761 0682 Sig
Membershi
p Duration 172 429 0696 Sig
Number of
Liability 459 717 0845 Sig
Land Area 224 365 0741 Sig
Motivation 519 013 0859 Sig
Basic
Knowledge 336 351 0804 Sig
Purposes of
Cooperatio n
283 678 0779 Sig
Adjustment 327 117 0800 Sig
Cosmopolit
e 319 070 0796 Sig
Service 428 803 0837 Sig
Participatio
n 548 568 0865 Sig
Satisfaction 338 105 0805 Sig
Perception 321 804 0798 Sig
Trust 317 399 0796 Sig
Spirit at
Work 400 454 0826 Sig
Responsibil
ity 340 885 0806 Sig
Sooth 301 304 0788 Sig
Improved Education Cooperativ e
289 043 0782 Sig
Source: Primary data processed, 2015
[image:30.595.321.523.177.710.2]17 basic capabilities of members, management and performance) to the level of success of cooperative economic development in the village at a significance level of 95%, it can be described as working hypotheses:
H0: There is no real relationship between
various factors (the basic capabilities of
members, management and
performance) to the level of success of cooperative economic development in the village at a significance level of 95%. H1: There is a real relationship between
various factors (the basic capabilities of
members, management and
performance) to the level of success of cooperative economic development in the village at a significance level of 95%.
It is seen that the relationship between the independent variable factors with cooperative success rate showed a significant relationship at the level of 95% which means reject H0 and accept H1. This
means that there is a real relationship between these variables with a success
rate of co-operative economic
development in the village.
While looking at the relationship between factors seen the close relationship because of the contingency coefficient between each factor is quite large. Where the lowest contingency coefficient was 0.682, namely variable non-formal education (cooperative education) and the highest in 0,865, namely the participation of member variable. It is seen that there is a close relationship between the real and the factors investigated with a success rate of cooperative and very real (very significant) at the 95% confidence level.
If examined closely the test results, in general these factors substantially affect result cooperative efforts in building the rural economy. Therefore, it is natural that when the variables of this study can really be considered and addressed the board and related institutions especially the government so that it can be formed formulas in an effort to make the right coaching and continuous. This means, if the research variables are constructed such that the harmonious cooperation between board members, the board with
the government and other agencies related financial institutions and companies, then what is described in this study will actually applied by good. And all the variables studied are the starting point of the existence of the cooperative members and administrators are always exist in everyday economic life in the village. Therefore, cooperative education, training, upgrading, socialization and similar to him is an early solution in the context of fostering cooperatives in the village.
CONCLUSION
The success rate in building the village economic cooperative influenced
various aspects such as the
characteristics of the members, the basic ability of members, management