SWELLING AND COMPRESSIBILITY CHARACTERISTICS OF
SOIL – BENTONITE MIXTURES
Agus Setyo Muntohar
Department of Civil and Environmental Engineering, Faculty of Engineering, University of Malaya, Kuala Lumpur Malaysia
Email: [email protected]
ABSTRACT
Understanding characteristics of soil mixtures lead to increasing the confidence level before applying such materials in the field. The outcomes of this study can provide insight into the swelling and the compressibility behavior of soil – bentonite mixtures, between non-swelling materials and swelling materials. A simple swell and compression laboratory test has been conducted for the purposes of this study. The result of this study indicated that the existence of bentonite in the soil mixtures influence the swelling behavior, which follows a hyperbolic curve model. Amount and size of non-swelling fraction affected the non-swelling and compressibility.
Keywords: bentonite, soil mixtures, swelling, swelling pressure, compressibility.
INTRODUCTION
The swelling behavior of expansive soils often causes unfavorable problems, such as differen-tial settlement and ground heaving. Recently, expansive soils are attracting greater attention. The soil is often designed as soil mixtures
requiring among others low shrinkage and
swelling properties, low hydraulic conductivity, and high strength. There are various applications where the soils have to be engineered to suit the desired behavior as back-filling (buffer) materials for high-level nuclear waste [1], and soils barrier for landfill liner [2, 3].
Many attempts have been performed in the past to understand the properties, indices and geotechnical properties, of the soil mixtures. Previous researchers have concentrated on the swelling behavior of expansive clays but with little attention given to the compressibility characteristics. The soil mixtures are commonly a blend of swelling soils (montmorillonite) with non-swelling soils (kaolinite, and/or sand) [2, 4]. The engineering properties of clay soils, such as the plastic limit and liquid limit, depend upon the moisture content of the clays which in turn is attributable to the amount of clays with high cation exchange capacity and to the type of interlayer cations. The plasticity index, i.e. the
Note: Discussion is expected before November, 1st 2003. The
proper discussion will be published in “Dimensi Teknik Sipil” Volume 6 Number 1 March 2004.
liquid limit minus the plastic limit, is a common indicator of an expansive soil. At liquid limit, Na-montmorillonite may have water films between 100Å and 200Å thick and Ca-montmorillonite may have water films between 15Å and 19Å thick [5]. Shrink and swelling behaviour of montmorillonite soils make unstable slopes and cause building foundation problems. Swelling or uplift pressures generated by montmorillonite may approach values as high as 981 kPa [6].
The solution to some of these engineering problems may be resolved by understanding the behaviour of clays composed of single and/or mixtures of clay minerals. This paper presents the result of a study in the volume change and compressibility of soil – bentonite mixtures. An experiment is carried out to study swell – deformation characteristics of bentonite mixed with different amount and types of non-swelling soil such as coarser fraction (sand) and finer fractions (silt).
LABORATORY EXPERIMENTS
Materials
Table 1. Physical properties of the soil used.
µm LiquidLimit Plastic
Note:a Wyoming bentonite,b Mining sand (24.5% Gravel), NP = non-plastic,
PI = plasticity Index, CF = Clay fraction
0
Particle size (mm)
Percent passing Bentonite Kaolin Sand
Clay Silt Sand Gravel
Figure 1. Particle size distribution of soils.
0
Liquid Limits, LL (%)
Plasticity Index, PI (%)
Kaolin-Benonite Clay content (%)
Plasticity Index (%)
Very High Swelling Potential
Figure 2. Potential expansiveness and plasticity chart of soil-bentonite mixtures
The kaolin comprised predominantly silt (75.6%), whereas 73.2% of the bentonite is clay. The sand comprised 35.6% coarse, 23.6% medium, and 12.3% fine size. Uniformity coefficient (Cu) and coefficient of curvature (Cc) are 9.08 and 1.19 respectively. Further, the sand can be classified into well-graded sand with gravel (SW).
Tests Scheme
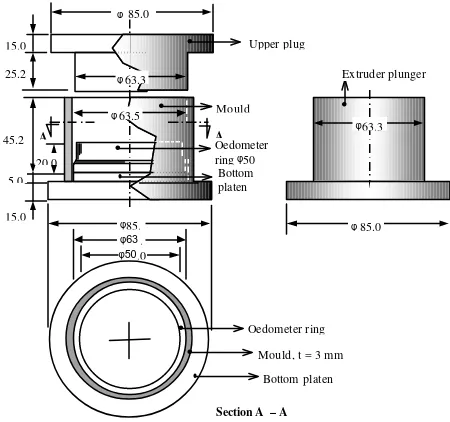
A conventional oedometer apparatus was used for determination of the swelling and compressibility of soil mixtures. The calculated quantities of soil mixtures, at optimum moisture content (OMC), were transferred to consoli-dation ring of 50 mm internal diameter and 20 mm height. All the soil mixtures were com-pacted statically in the specially constructed mould (Fig. 3) to their maximum dry density (MDD) using the hydraulic jack. The com-pressive force was applied to the upper plug until the flange is in contact with the barrel of
the mould. The moisture content and dry density of the specimens after moulded was determined as a control to their OMC and MDD. The results are presented in Table 2.
The specimen was positioned in the loading frame with a seating load of 3.89 kPa. The soil samples were then inundated with distilled water and allowed to swell until they reached equilibrium values of swelling. At this point a standard consolidation test is conducted by applying incremental loads starting with 14 kPa and ending with 1600 kPa. The pressure required to revert the specimen to its initial height was determined as the swelling pressure.
45.2 Upper plug
Mould Extruder plunger
A A
φ63.
Section A – A
φ50.0
Bottom platen Mould, t = 3 mm Oedometer ring
Figure 3. Static compaction mould for swelling specimens.
Table 2. Compaction Properties Soil Mixtures.
Soil Code KB1 KB2 KB3 KB4 SB1 SB2 SB3
OMC (%) 32.4 30.6 30.7 31.5 18.2 17.9 16.5
Moisture *(%) 32.43 30.20 31.03 31.24 18.53 18.10 16.64
Variability (%) 0.09 1.30 1.07 0.82 1.80 1.11 0.84
MDD (Mg/m3) 1.28 1.29 1.30 1.31 1.72 1.67 1.60
Dry density
*(Mg/m3) 1.275 1.294 1.308 1.314 1.719 1.662 1.610
Variability (%) 0.39 0.31 0.61 0.30 0.05 0.47 0.62
Note: *After molded; OMC : optimum moisture content; MDD:
maximum dry density
Clay mineralogy
mica-like clay minerals, phlogopite (brown mica) was observed at 8.89o. The montmorillonite mineral was found strongly in bentonite at basalt spacing of 5.75 Å, 17.25 Å, and 19.98 Å. Quartz and illite mineral was strongly appeared at basalt spacing of 3.36 Å and 3.19 Å respectively. The quartz was also found at 4.28 Å, 2.46 Å, and 2.29 Å in the low intensities. Mixed layer between illite and montmorillonite was found at 4.52 Å of basalt spacing.[4].
5 10 15 20 25 30 35 40
Diffraction Angle (2θθ) M
Q Q K
I
K
I
Bentonite Kaolin
I/M
I/M/K K K K
I/M
I
K/M Q Q
Note: I: Illite, K: Kaolinite, M: Montmorillonite, Q: Quartz
Figure 4. X-Ray diffraction of kaolin and bentonite soils.
RESULT AND DISCUSSION
Swelling Characteristics
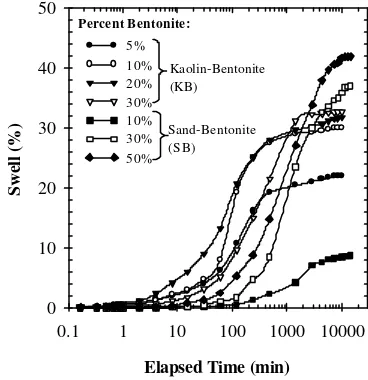
The swell potential was defined as the percentage swell of a laterally confined sample, which has soaked under a surcharge pressure of 3.89 kPa after being compacted to maximum density at optimum moisture content according to the compaction test. The results obtained are presented in Fig. 5 in the form of percentage of swell versus time with varying percentage of bentonite content. The swell is expressed as a percentage increase in sample height.
It has been observed that for all the mixtures, increase in swelling with log time is slow initially, increases steeply, and then reaches an asymptotic value. The time required to reach an asymptotic value varies considerably, depending upon the percentage of bentonite and the type and amount of non-swelling fraction. The maximum amount of swelling generally increases with increasing bentonite content. Fig. 5 depict, even at the same percentage of bentonite, that considerable differences exist in
the nature of time-swell relationship. At low bentonite content, the rate of swelling is very slow with sand but increases gradually with decrease in the particle size of the non-swelling fraction.
Fig. 6 replots the time-swell relationship as percentage of the maximum swell. Here, the percent swell at a particular time is calculated as the ratio of amount of swell of the mixture at that time to the total swell and is denoted as a percentage. This is observed that for sand – bentonite mixtures, the rate of swelling is very slow and follow a similar swell path. In other hand, it was observed that the swelling almost completed within 1440 min (±24 hrs) for kaolin mixtures for all percentage of bentonite.
Elapsed Time (min)
0.1 1 10 100 1000 10000
Swell (%)
0 10 20 30 40 50
5% 10% 20% 30% 10% 30% 50% Percent Bentonite:
Kaolin-Bentonite (KB)
Sand-Bentonite (SB)
Figure 5. Swelling behaviour (as percent of initial height) of soil-bentonite mixtures
Elapsed Time (min)
0.1 1 10 100 1000 10000
Percentage of Total Swell (%)
0 20 40 60 80 100
5% 10% 20% 30% 10% 30% 50% Percent Bentonite:
(KB)
(SB)
There is very limited reference about the rate of swelling. However, the rate of swelling may be approached as similar as in the coefficient of consolidation determination as given in Equation 1a. symbolized with cs, then the equation can be expressed as follows:
cs≈ 50
1
t
(1b)The t50 is the time required to achieve 50% of swell. For all mixtures 50% of swell are achieved within 100 min (±1 hr, 40 min) and 1000 min (±16 hrs, 40 min) for kaolin and sand mixtures respectively.
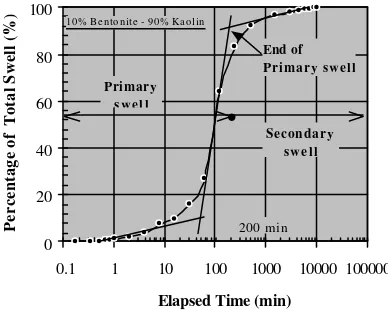
Dakshanamurthy [8] noticed two stages of swelling. In the first stage of hydration of dry clay particles, water is adsorbed in successive monolayers on the surface of montmorillonite clay apart which referred to as interlayer or intercrystalline swelling. The second phase of swelling is due to double-layer repulsion. Large volume changes accompany this stage of swelling. These occurrences can be approached closer as illustrated in Fig. 7, which the curve can be divided into three phases. Initial swelling is generally less than 10% of the total swelling. This is essentially due to swelling of the bentonite clay particles within the voids of the coarser non-swelling fraction.
0
0.1 1 10 100 1000 10000 100000
Elapsed Time (min)
Percentage of Total Swell (%)
Primary
10% Bentonite - 90% Kaolin
200 min
Figure 7. Typical time-percent swell of total swell curve
Primary swelling develops when the void can no longer accommodate further clay particle swelling. It occurs at a faster rate. After the primary swelling was completed, slow continued swelling occurs. It is observed that the end of primary swelling of kaolin-bentonite mixtures are varies within 200 – 1000 minutes. In general, the time needed for completion the primary swelling increase associated with increase in bentonite content. But, this is not appeared in the sand-bentonite mixtures.
Furthermore, the swelling mechanism of compacted expansive clay can be illustrated by the model as given in Fig. 8. The volume of swelling clay particles such as montmorillonite increase by absorbing water into the interlayers of montmorillonite, and the void in the compacted expansive clay are filled by this volume.
Void Swelling
clay (+ interlayer
water)
Nonswelling clay/soil Swelling clay
Before water
uptake After uptake water
During water
uptake
Figure 8. The model of the swelling deformation of compacted expansive clay
After water uptake, the compacted expansive clay can swell at a constant vertical pressure as in the swelling deformation test. The volume of compacted clay increases as the volume of swelling clay particles increases until the swelling pressure of the clay particles equals the vertical pressure (see Fig. 8).
Maximum Swelling
where t is time from the start of water inundation, Sv(t) is vertical swelling at time (t),
and a and b are constants determined by fitting procedures. The calculated maximum swelling is presented in Table 3 and the curves of the hyperbolic are also shown in Fig. 9. This is observed that the swelling take longer time to reach the maximum swelling.
Table 3. Swelling, swelling pressure and com-pressibility index
Soil Mix
Percent Bentonite
SP (%)
Hyperbolic constants (Eq. 3)
Max.
Swell (%)aPs (kPa) Csv (10-2)
a b
5 21.92 4.475 0.0449982 22.22 114 26.99 Kaolin: 10 29.96 3.199 0.0324435 30.82 325 25.58 20 31.75 2.194 0.0316716 31.57 356 29.14 30 32.65 8.299 0.0293099 34.37 420 39.36 Fine 10 8.68 167.25 0.1007024 9.93 165 7.50 Sand: 30 36.96 31.815 0.0244295 40.93 580 32.38 50 41.96 37.675 0.0205627 48.63 660 31.48
Note: SP: swelling potential (measured for 10 days observation), Ps:
swelling pressure. a Predicted using Eq. 3, Csv : Coefficient of Compressibility (after swell)
Elapsed Time (min)
0 5000 10000 15000 20000
Swell (%)
0 10 20 30 40 50
10% (SB) 5% (KB) 10% (KB) 20% (KB) 30% (KB) 30% (SB) 50% (SB) Number in percent
indicates bentonite content
Figure 9. Time-swell hyperbolic relationship for estima-tion of maximum swelling
Swelling Pressure
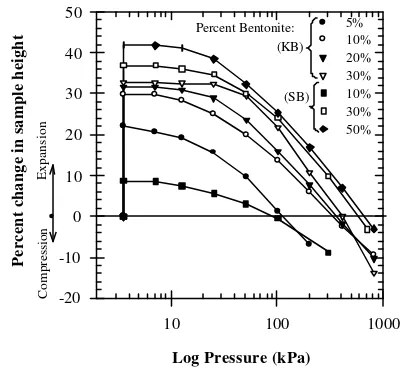
Swell pressure is defined here as the pressure required to compress the specimen, that has been soaked and completed the swell under 3.89 kPa pressure, back into its original configuration (before swell). The swell pressure was measured by the pre-swelled method for simplicity; however, there is experimental evidence that different methods gave similar results [11, 12] especially at high density.
Figure 10 shows the change in sample height (%) and pressure (kPa) curves for soil – bentonite mixtures, which is determined from
oedometer test. At least two essential values can be attracted from this results i.e. compressibility and swelling pressure of compacted soil.
Log Pressure (kPa)
10 100 1000
Percent change in sample height
-20 -10 0 10 20 30 40 50
5% 10% 20% 30% 10% 30% 50%
Expansion
Compression
Percent Bentonite: (KB)
(SB)
Figure 10. Percent change in sample height versus loading applied pressure
The figure shows that the swell pressure increase with increasing bentonite content. Sand – bentonite mixtures exhibit greater swelling pressure than other mixtures. It is perhaps caused by the greater initial dry density and lower water content when the specimen was compacted. This is in agreement with El-Sohby and Rabba [12].
Mathew and Rao [13] indicated that by increasing the valence of exchangeable cations in homoionized clay, the overall compression in the system is reduced and the pre-consolidation pressure (pc) is increased. The equilibrium void ratio at any applied pressure is a direct function of the repulsive forces arising from the interaction of adjacent diffuse double layers and pore fluid. As the valence of exchangeable cations in the clay increased, there is a reduction in the diffuse double –layer thickness and in the magnitude of the repulsive forces. These finally result in a lower equilibrium void ratio at any given pressure until higher pressures are reached [14].
Compressibility Characteristics
The virgin compressibility is defined as the linear part of the volumetric strain (εv) vs. log
linear portion of the virgin loading curve after the specimen was allowed to swell, as given in Equation 4.
Csv =
( )
p logSv
∆
∆ (4)
It is observed that the compressibility of soil increase with increase in swelling and percent of bentonite. The higher swollen soil compress rapidly subjected to applied load. It can be affected by absorbing water during swell, which caused reducing the strength.
CONCLUSION
Based on the study undertaken thus far it can be concluded that:
1. The swelling, swelling pressure, and
compressibility of bentonite mixed kaolinite and sand, generally, increases associated with bentonite percentage. Apart of the mineralogical and clay content, the amount and size of the non-swelling fraction play role in governing the swelling and compression behavior
2. In general, the swelling behavior occurred in two distinct stages i.e. primary swelling and secondary swelling. Secondary swelling occurred after primary swelling completed. 3. The swell behavior was time dependent,
which follows a hyperbolic relationship during the stages and hence can be used to predict the magnitude of maximum swelling.
Acknowledgement
The author gratefully appreciates the funding provided by Ministry of Science, Technology and Environmental (MOSTE) Malaysia through Fundamental and Short Term Research Vot-F 0153/2002B.
REFERENCES
1. Yong, R.N., Boonsinsuk, P., and Wong, G., “Formulation of backfill material for a nuclear fuel waste disposal vault”, Canadian Geotechnical Journal, Vol. 23, pp. 216 – 228, 1986.
2. Alawaji, H.A., “Swell and compressibility characteristics of sand – bentonite mixtures inundated with liquids”, Applied Clay Science, Vol. 15, Issues 3-4, pp. 411 – 430, 1999.
3. Daniel, D.E. and Wu, Y.K., “Compacted clay liners and covers for arid sites”, Journal of Geotechnical Engineering, ASCE Vol. 119 (2), pp. 223 – 237, 1993.
4. Misra, A., Sivalingan, S., and Sharma, M.C., “Properties of known kaolinite– montmorillonite mixtures”, In H.Y. Fang and H.I. Inyang (Eds), Environmental Geotechnology, John Wiley & Sons Inc, New York, pp. 219 – 228, 1999.
5. Mitchell, J.K., Fundamentals of Soil
Behaviour, Second Edition, John Wiley & Sons Inc., New York, 1993, ch. 3.
6. Grim, R.E., Applied Clay Mineralogy, McGraw Hill, New York, 1962, ch. 8.
7. Muntohar, A.S., and Hashim. R., 2002,
“Properties of engineered expansive soils”, Proc. The 1st Technical Postgraduate
Symposium, University of Malaya, 16 – 17 October 2002, pp. 272 – 276.
8. Dakshanamurthy, V., 1978, “A new method to predict swelling using a hyperbolic equation”, Geotechnical Engineering, Vol. 9, pp. 79 –87.
9. Al-Mukhtar, M., Touray, J.C., and Bergaya, F., “Une argile modèle pour l’étude du gonflement des sols argileux: la laponite-Na de synthèse”, Sciences de la terre et des planètes, Vol. 329, pp. 239 – 242, 1999.
10. Komine, H., and Ogata, N., “Experimental study on swelling characteristics of compacted bentonite”, Canadian Geotech-nical Journal, Vol. 33, pp. 11 – 22, 1994.
11. Borgesson, L., “Laboratory testing and computer simulation of clay barrier behavior”, Proceeding of the Ninth Inter-national Clay Conference, AIPEA, Stras-bourg, pp. 117 – 126, 1989.
12. El-Sohby, M.A., and Rabba, E.A., “Some factors affecting swelling of clayey soils”, Geotechnical Engineering Journal, SEAGS, Vol. 12, pp. 19 – 39, 1981.
13. Mathew, P.K., and Rao, S.N., “Influence of cations on compressibility behavior of a marine clay”, Technical Note, Journal of Geotechnical and Geoenviromental
Engi-neering, ASCE Vol. 123 (11), pp. 1071–
1073, 1997.
14. Sridharan, A., and Choudhury, D.,